The strongest number, and its label
The decade-level split in the nearest academic test runs in the claim's direction: as untested medians the paper itself files as a non-reported analysis.
Reference & Evidence
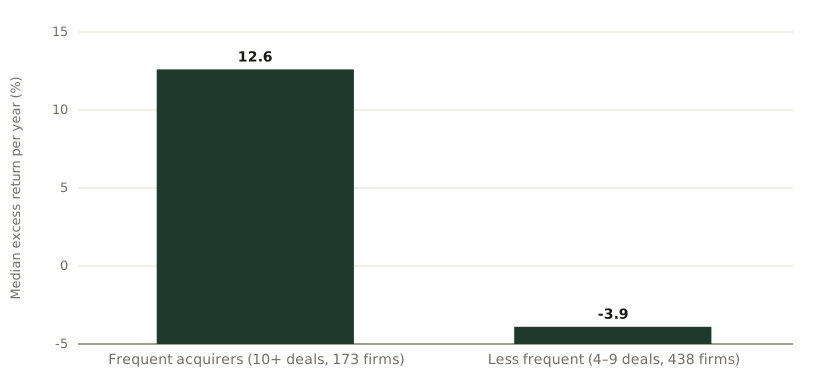
Source: Laamanen & Keil (2008), robustness note: median excess market returns per year over 10–13 years, 611 U.S. serial acquirers (1990–99); the paper prints the buckets as 'over 10' (173 firms) and '4–9' (438 firms), which partition the full 611. Its prose calls the split significant; the analysis is non-reported and no test statistic for it appears in the article. Descriptive medians; the authors disclaim causality.
Each line is a claim from the register this journal publishes against, resolved from the register at build time.
- A Laamanen and Keil studied 5,518 acquisitions by 611 active U.S. acquirers from 1990 to 1999 using three-year excess market returns Laamanen & Keil (2008), Strategic Management Journal 29(6) ·
LK08-C1 - A Over the 10 to 13 year horizon, 173 frequent acquirers had median excess returns of 12.6% per year versus -3.9% for 438 less frequent acquirers; the split was descriptive and non-reported Laamanen & Keil (2008), robustness note ·
LK08-C2
Grades: A, verified against the printed page of the primary source · B, primary source, text layer only · C, authoritative secondary · D, reported.
Related exhibits
-
The claim, beside its test
From the essay Programmatic M&A: the claim that outlived its test
-
Programmatic, defined seven ways
From the essay Programmatic M&A: the claim that outlived its test
-
What does cohort analysis measure?
From the essay What is cohort analysis? A stable entry event before a retention curve