Figure 1From “The integration plan spends what the deal bought.”
The base rate, drawn: acquirer returns drift negative
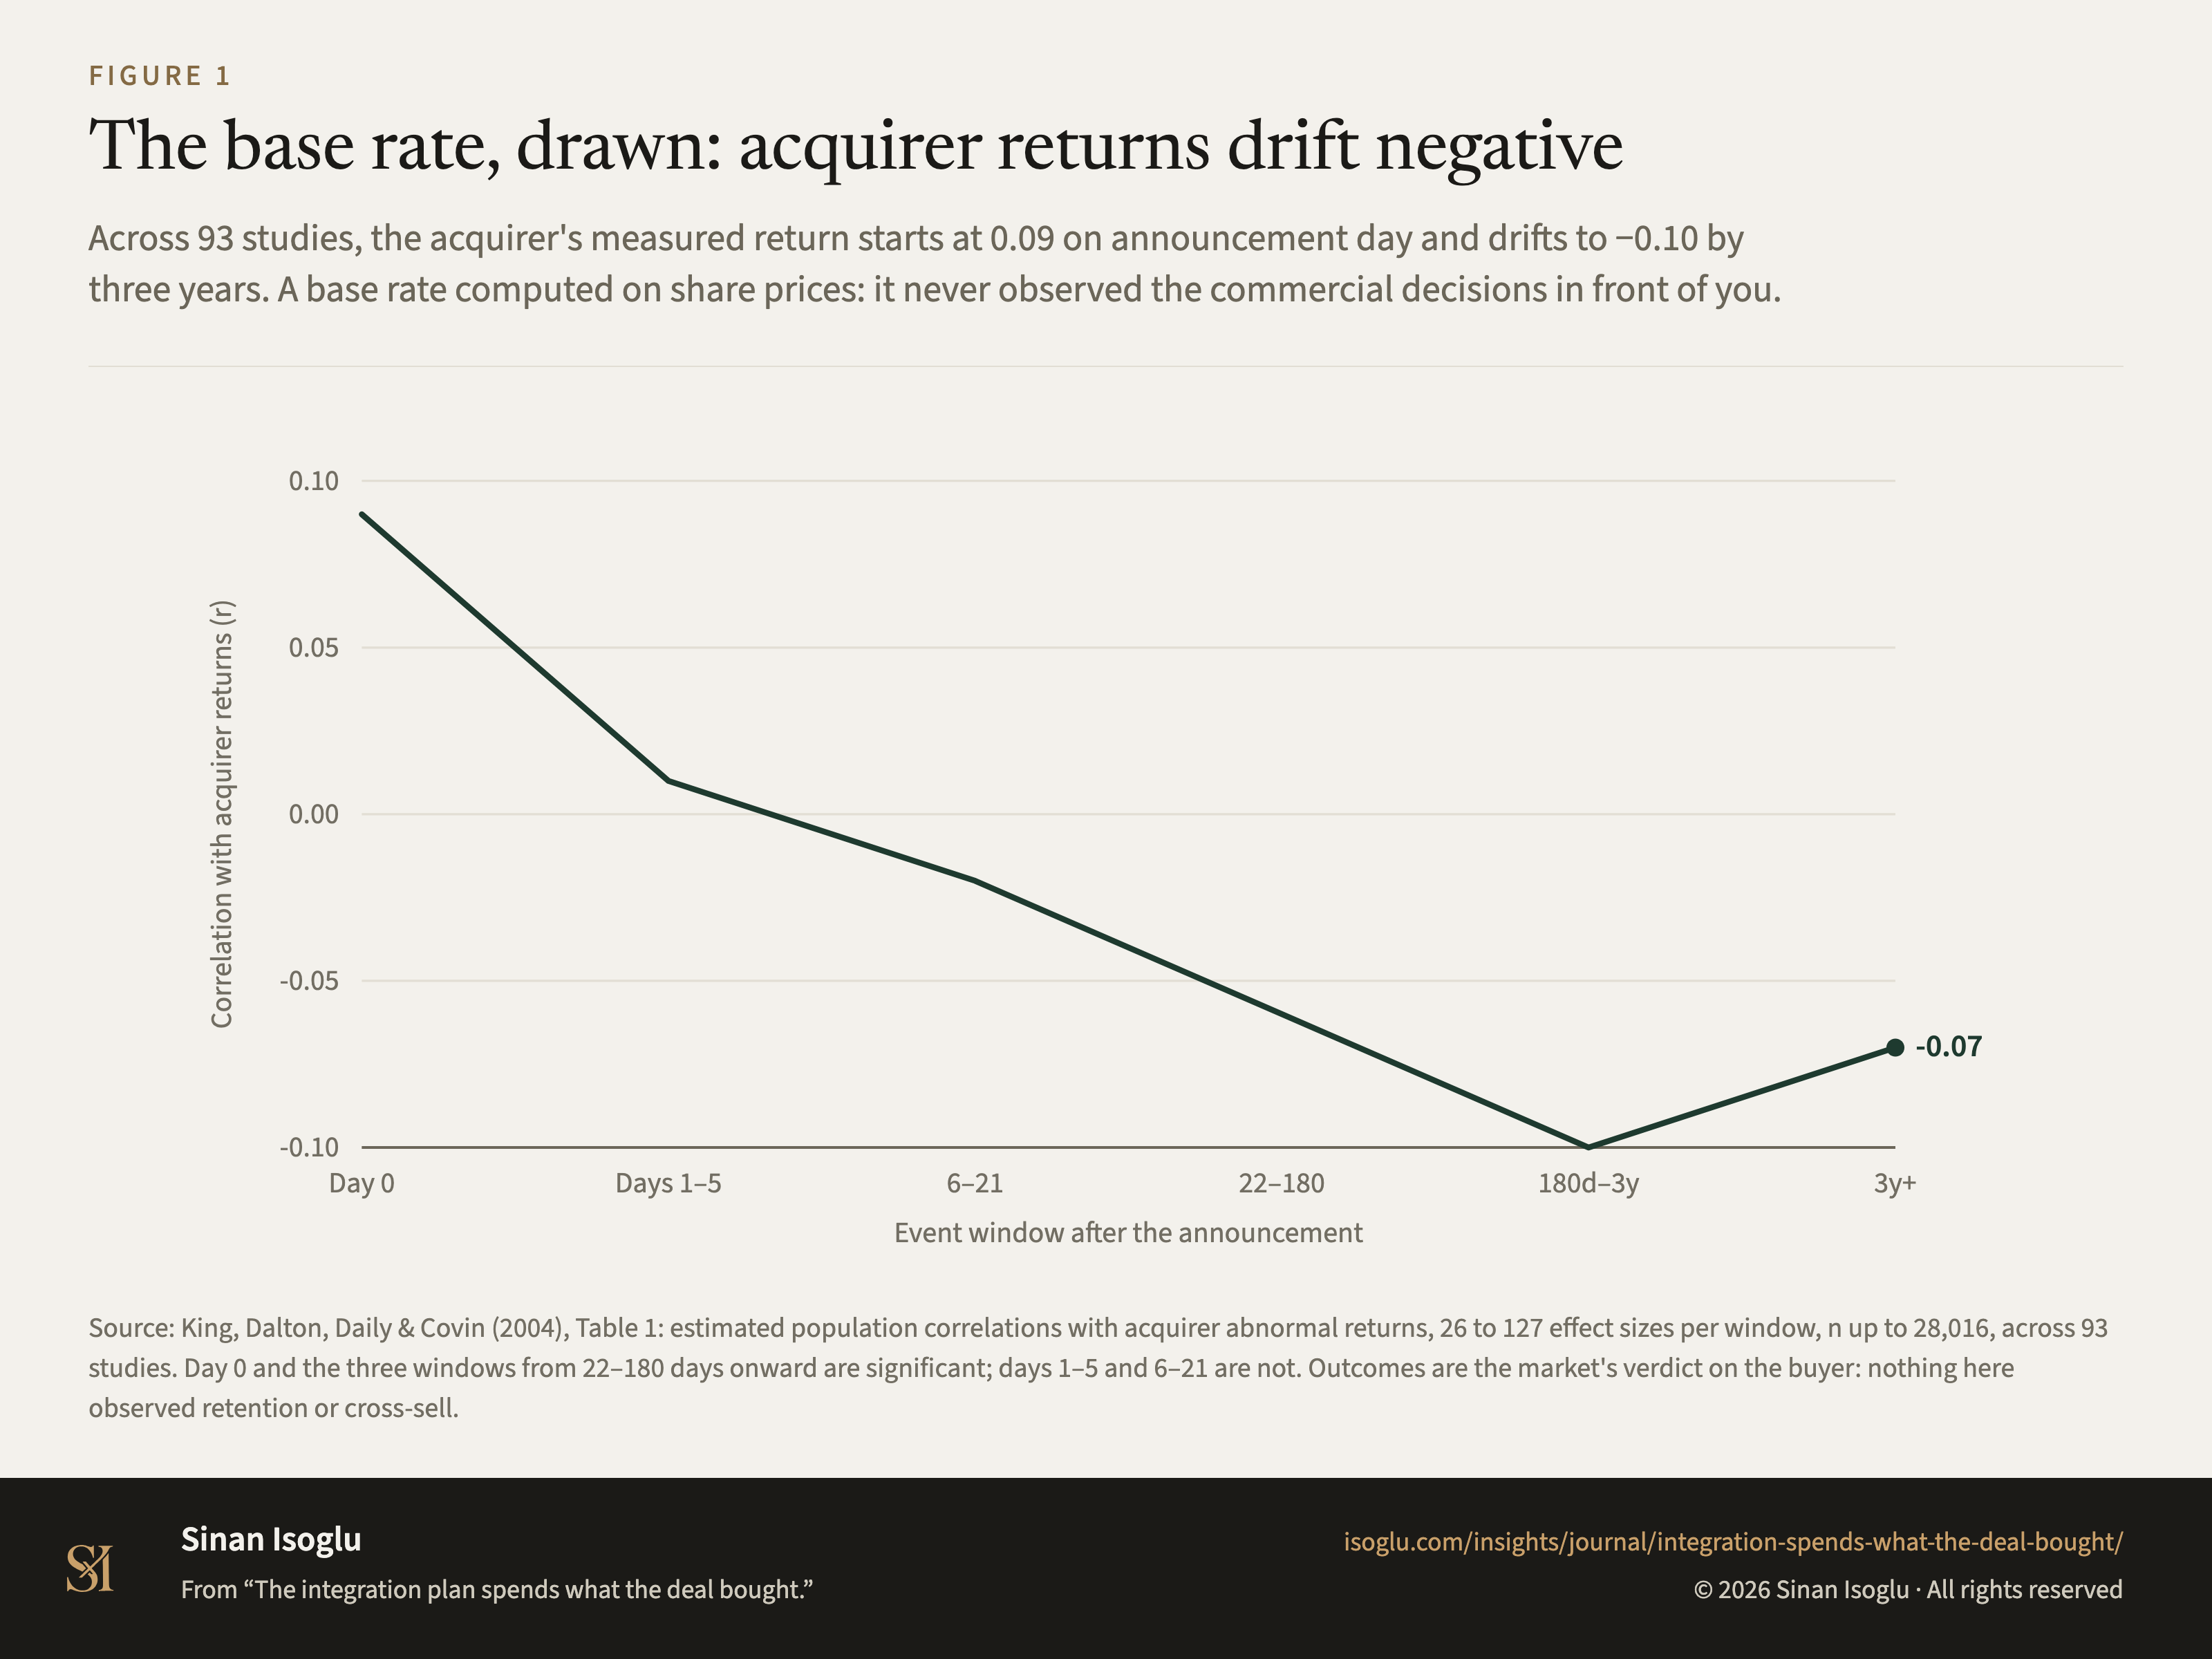
Across 93 studies, the acquirer's measured return starts at 0.09 on announcement day and drifts to −0.10 by three years. A base rate computed on share prices: it never observed the commercial decisions in front of you.
Figure 1The base rate, drawn: acquirer returns drift negative
Source: King, Dalton, Daily & Covin (2004), Table 1: estimated population correlations with acquirer abnormal returns, 26 to 127 effect sizes per window, n up to 28,016, across 93 studies. Day 0 and the three windows from 22–180 days onward are significant; days 1–5 and 6–21 are not. Outcomes are the market's verdict on the buyer: nothing here observed retention or cross-sell.
Source and evidence
Each line names a claim related to this exhibit, its source, and how it was checked.
- A KDDC04-C1 Across the meta-analysis, "acquiring firms' performance does not positively change as a function of their acquisition activity, and is negatively affected to a modest extent" (p. 187, abstract)King, Dalton, Daily & Covin (2004) · VoR held, Marquette deposit of the typeset article
- A KDDC04-C4 Acquirer abnormal returns by event window (estimated population r): Day 0 0.09\\\ (127 effect sizes, n = 28,016) · Days 1–5 0.01 (114; 19,269) · Days 6–21 −0.02 (54; 8,548) · Days 22–180 −0.06\\\ (64; 5,698) · 180 days to 3 years −0.10\\\ (103; 25,205) · beyond 3 years −0.07\\\ (26; 5,966) (Table 1)King, Dalton, Daily & Covin (2004) · VoR held, Marquette deposit of the typeset article
Grades: A, verified against the printed page of the primary source · B, primary source, text layer only · C, authoritative secondary · D, reported.
From the essay
Go-to-market strategy
The integration plan spends what the deal bought.
Integration depth buys cost savings by spending market position. The measured record prices that trade, and says its sign is not fixed.
Read the essayThis exhibit belongs to an essay: the numbers live here, the argument lives there.
Cite or embed
Related exhibits
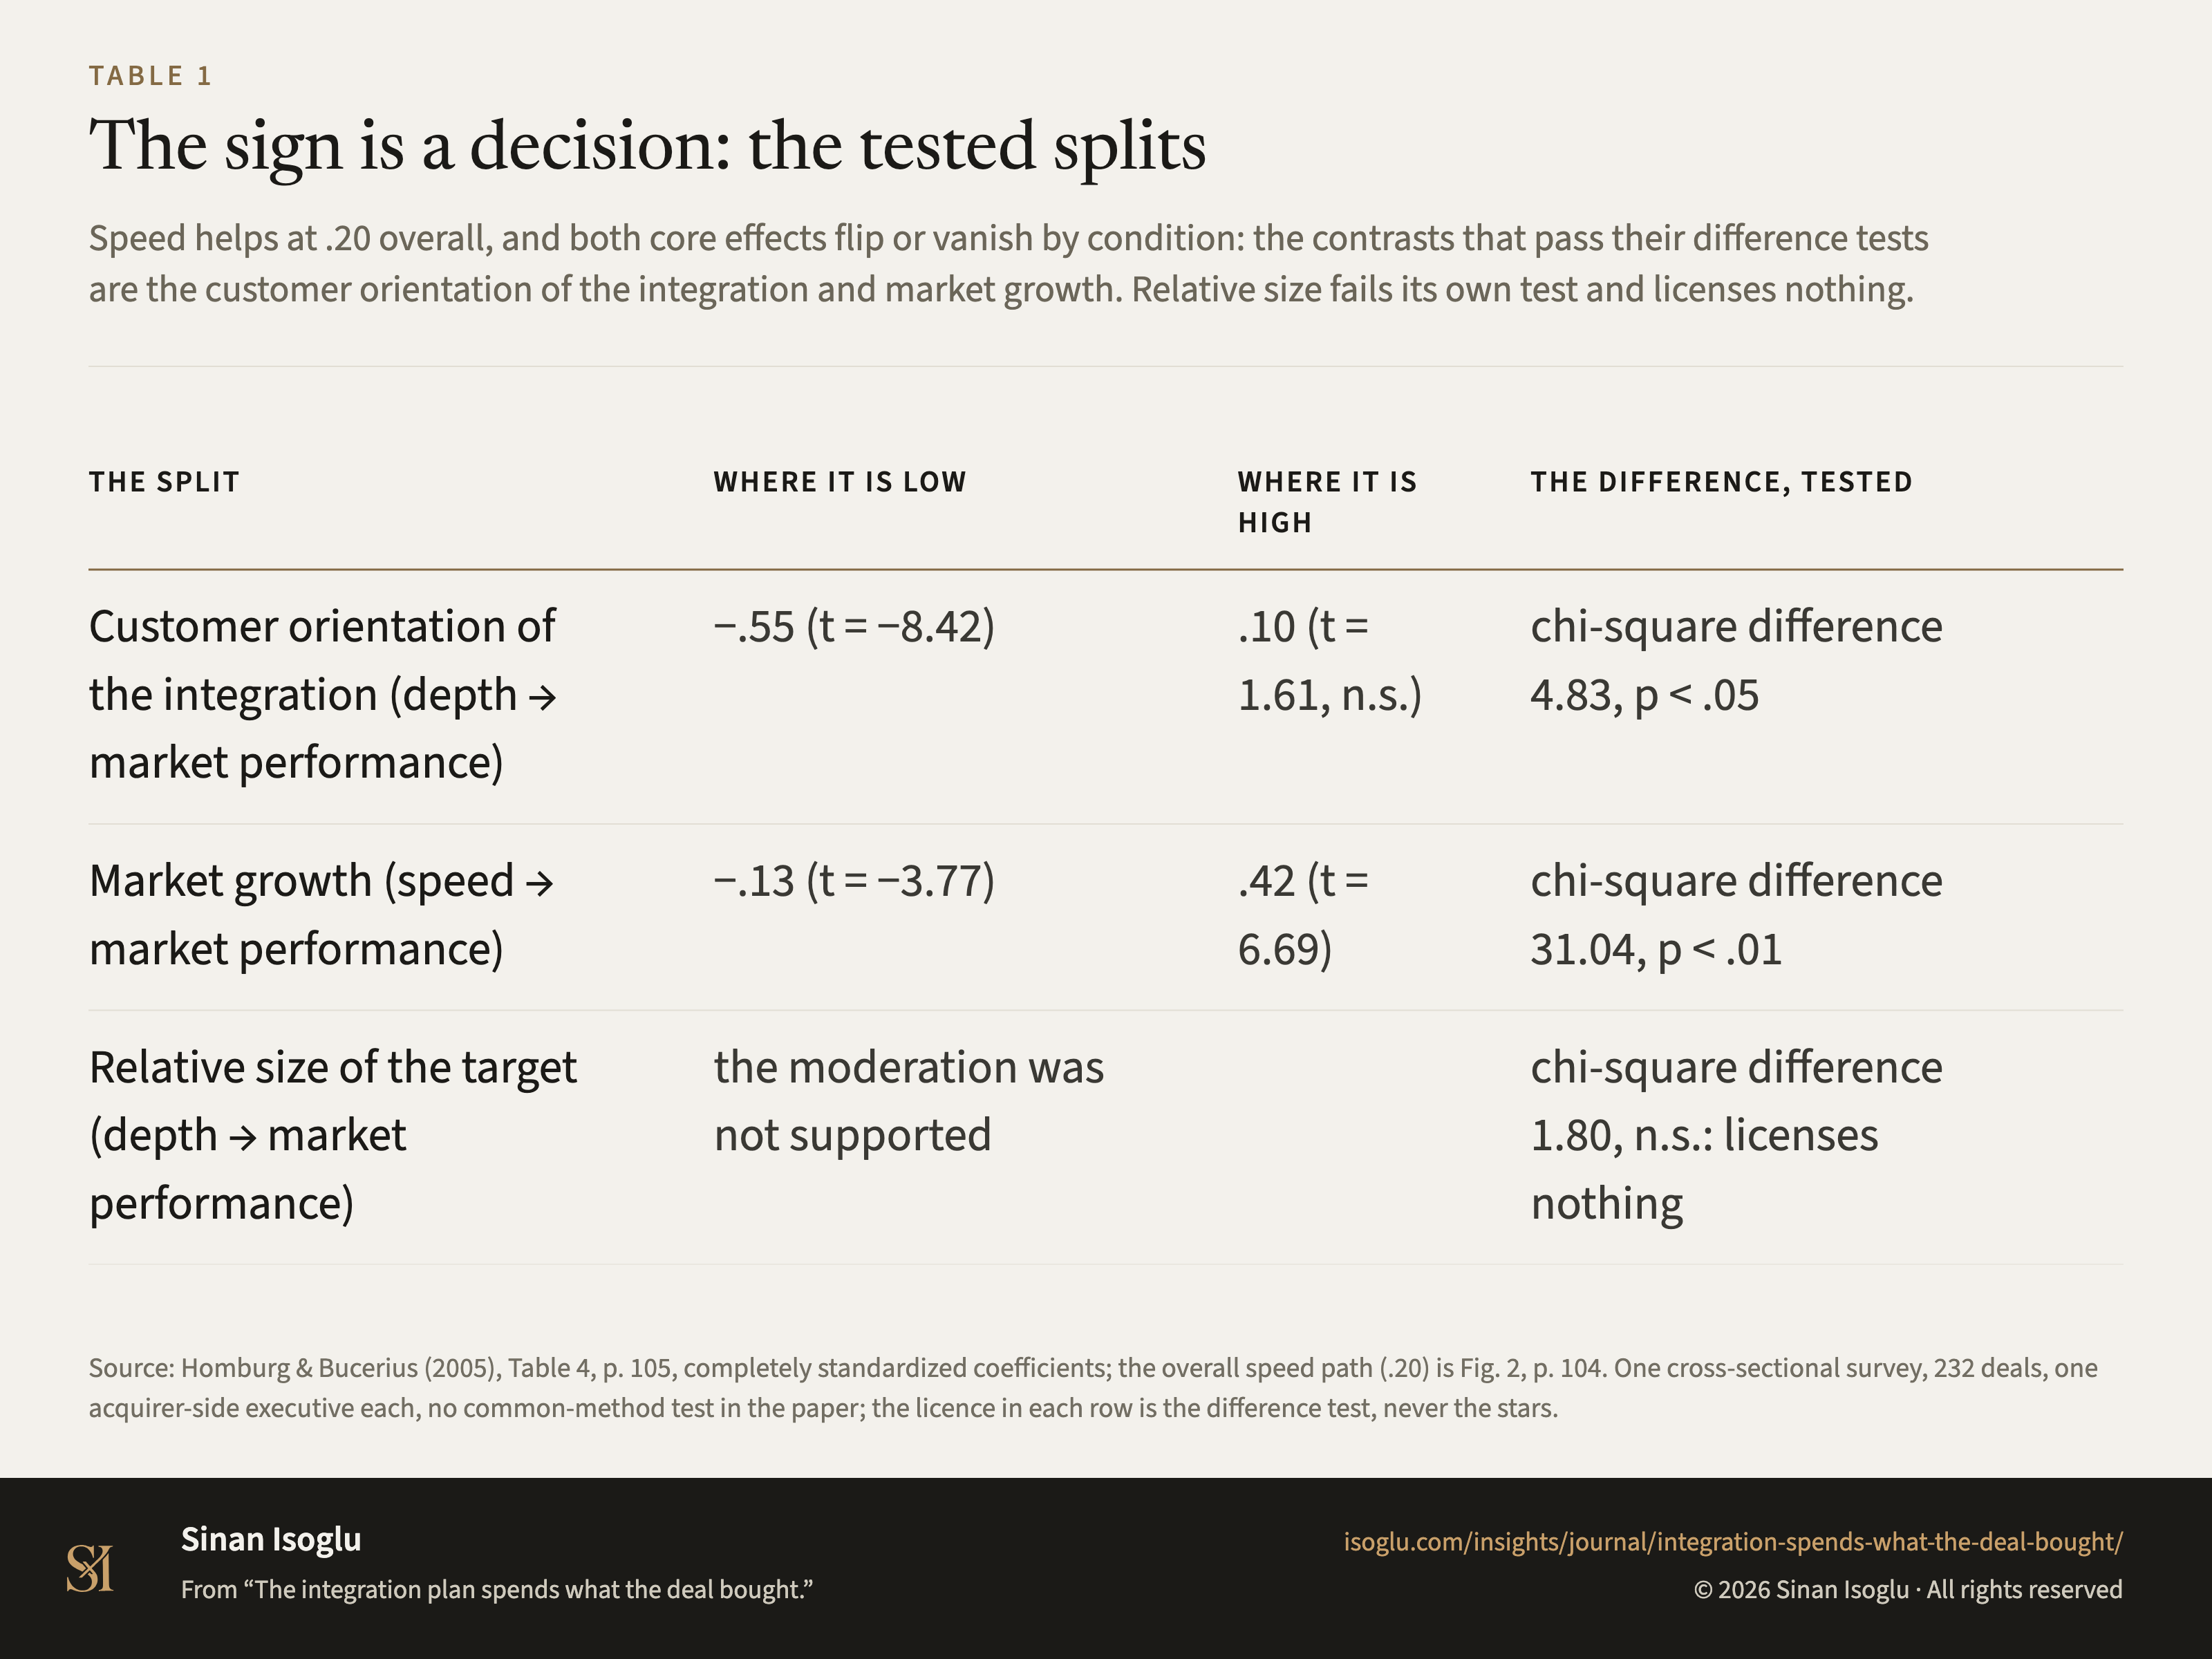
Table 1Table
The sign is a decision: the tested splits
The integration plan spends what the deal bought.
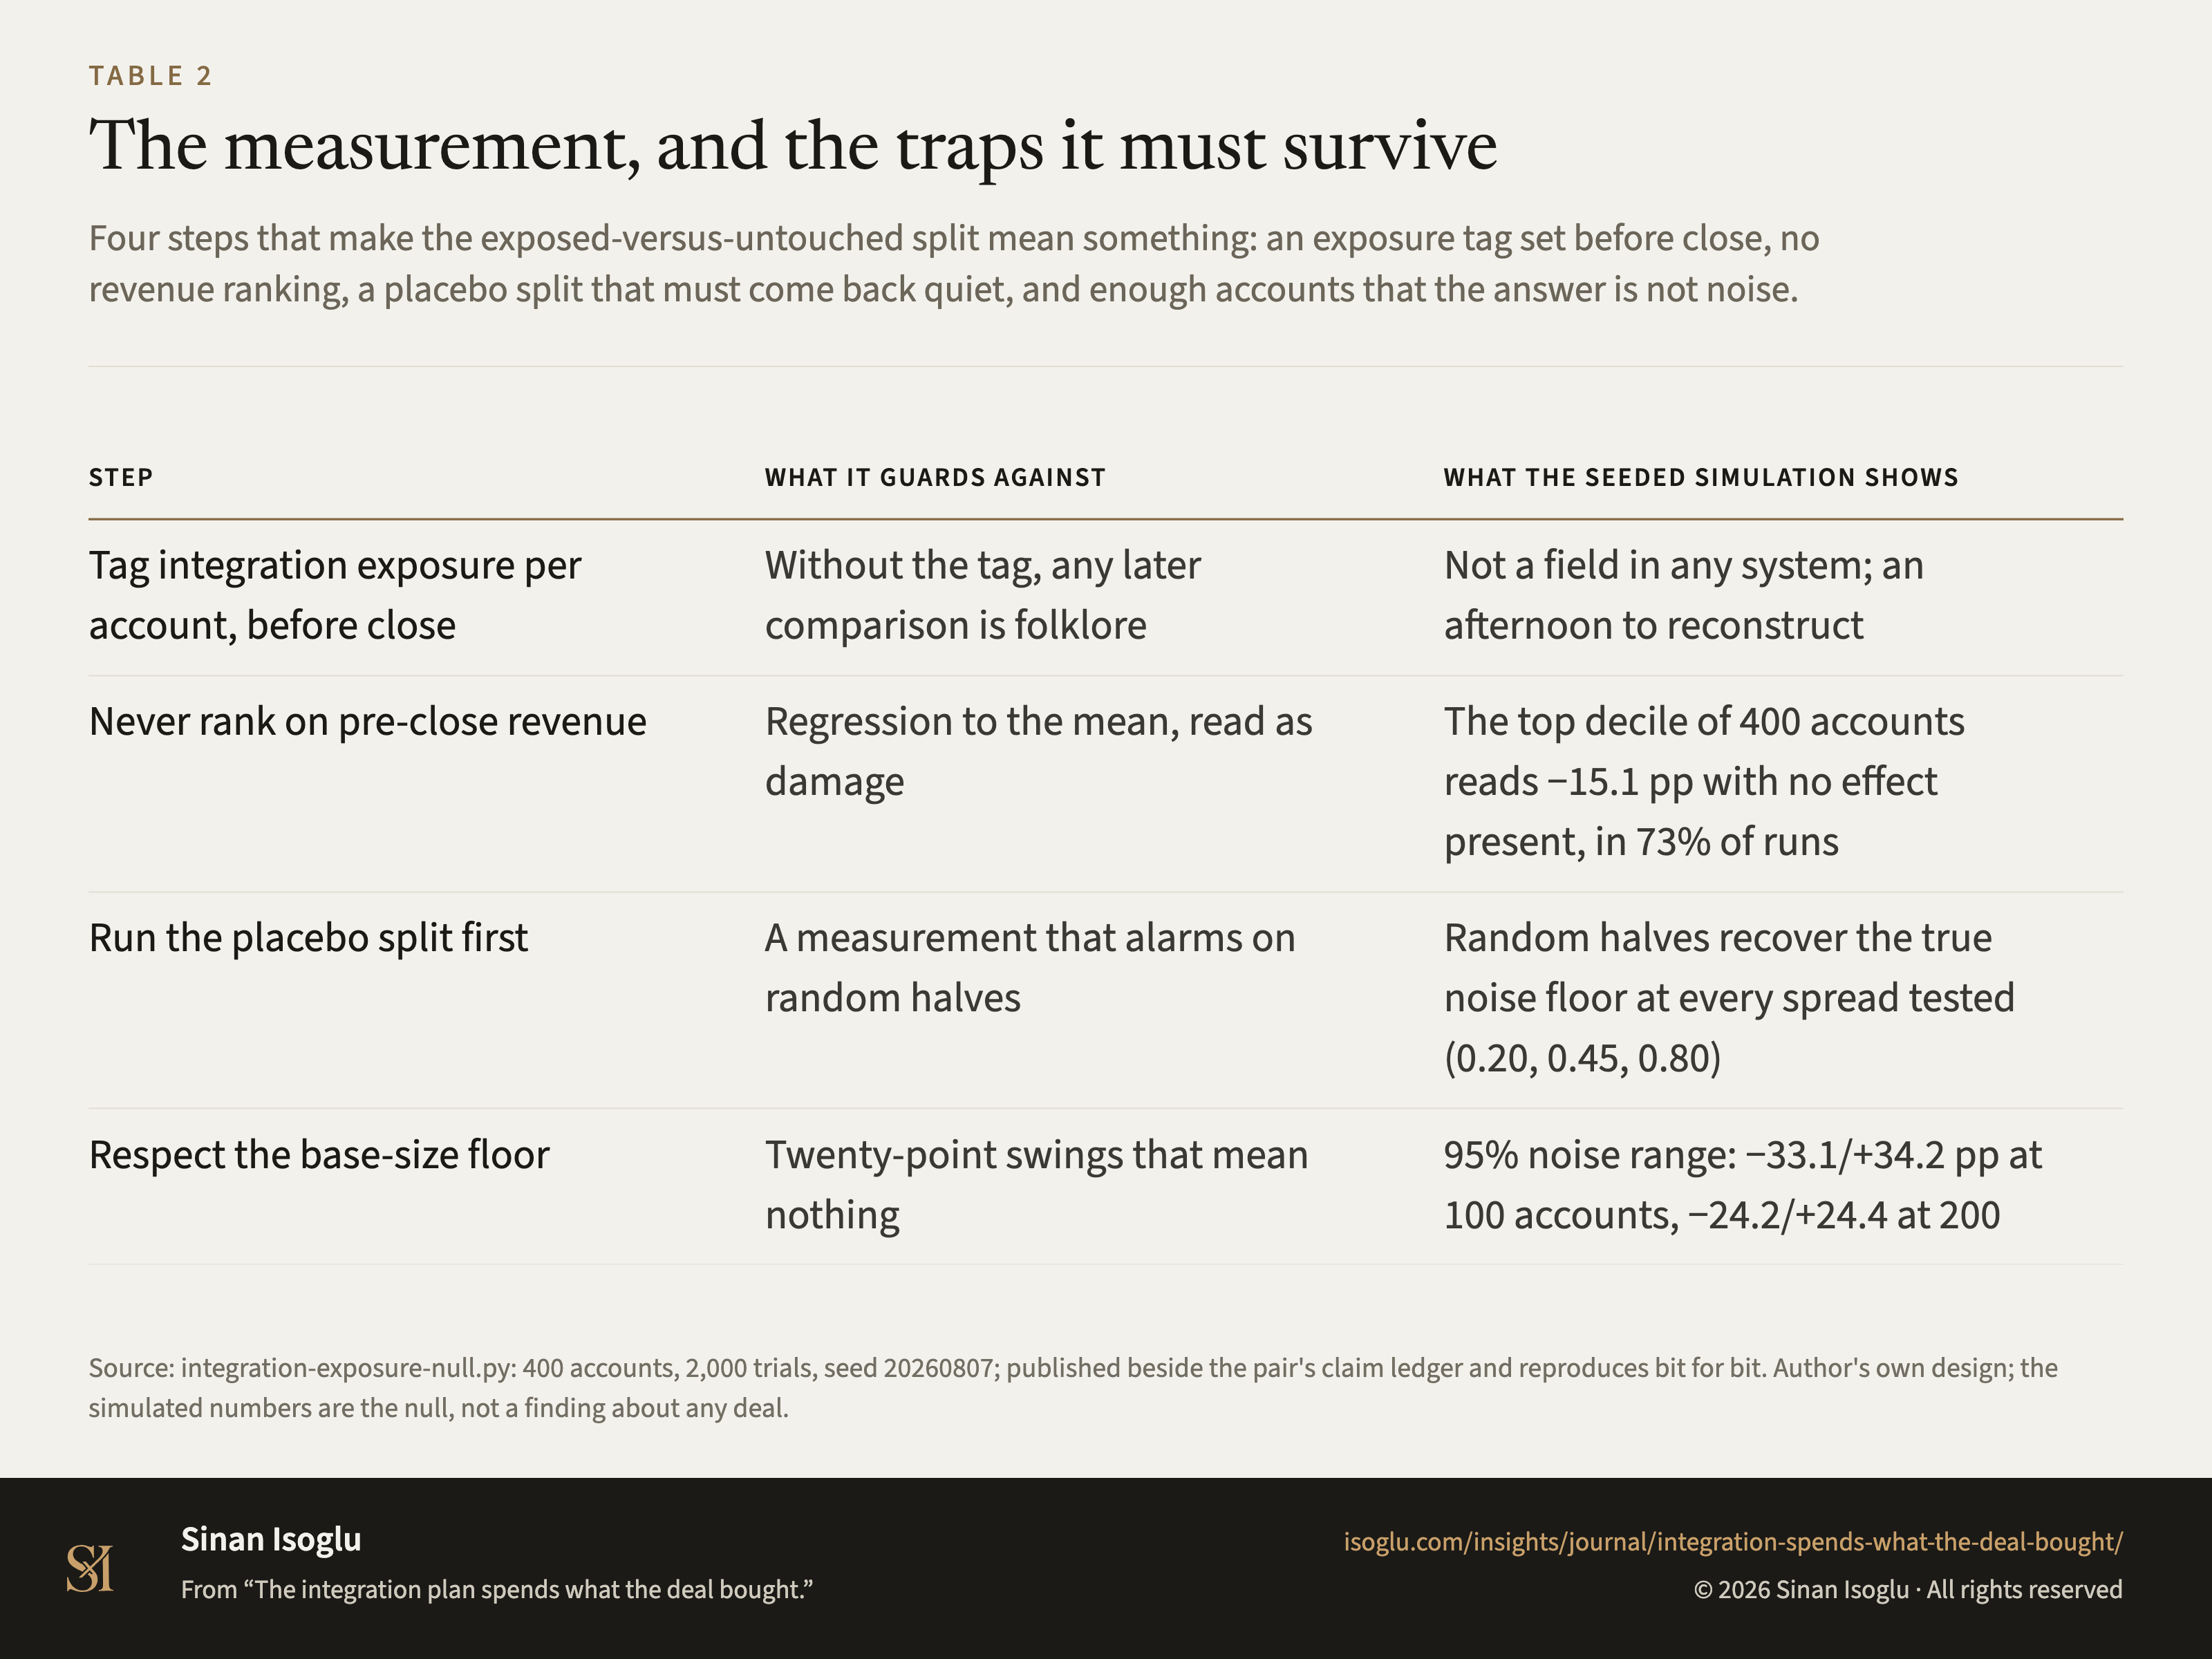
Table 2Table
The measurement, and the traps it must survive
The integration plan spends what the deal bought.
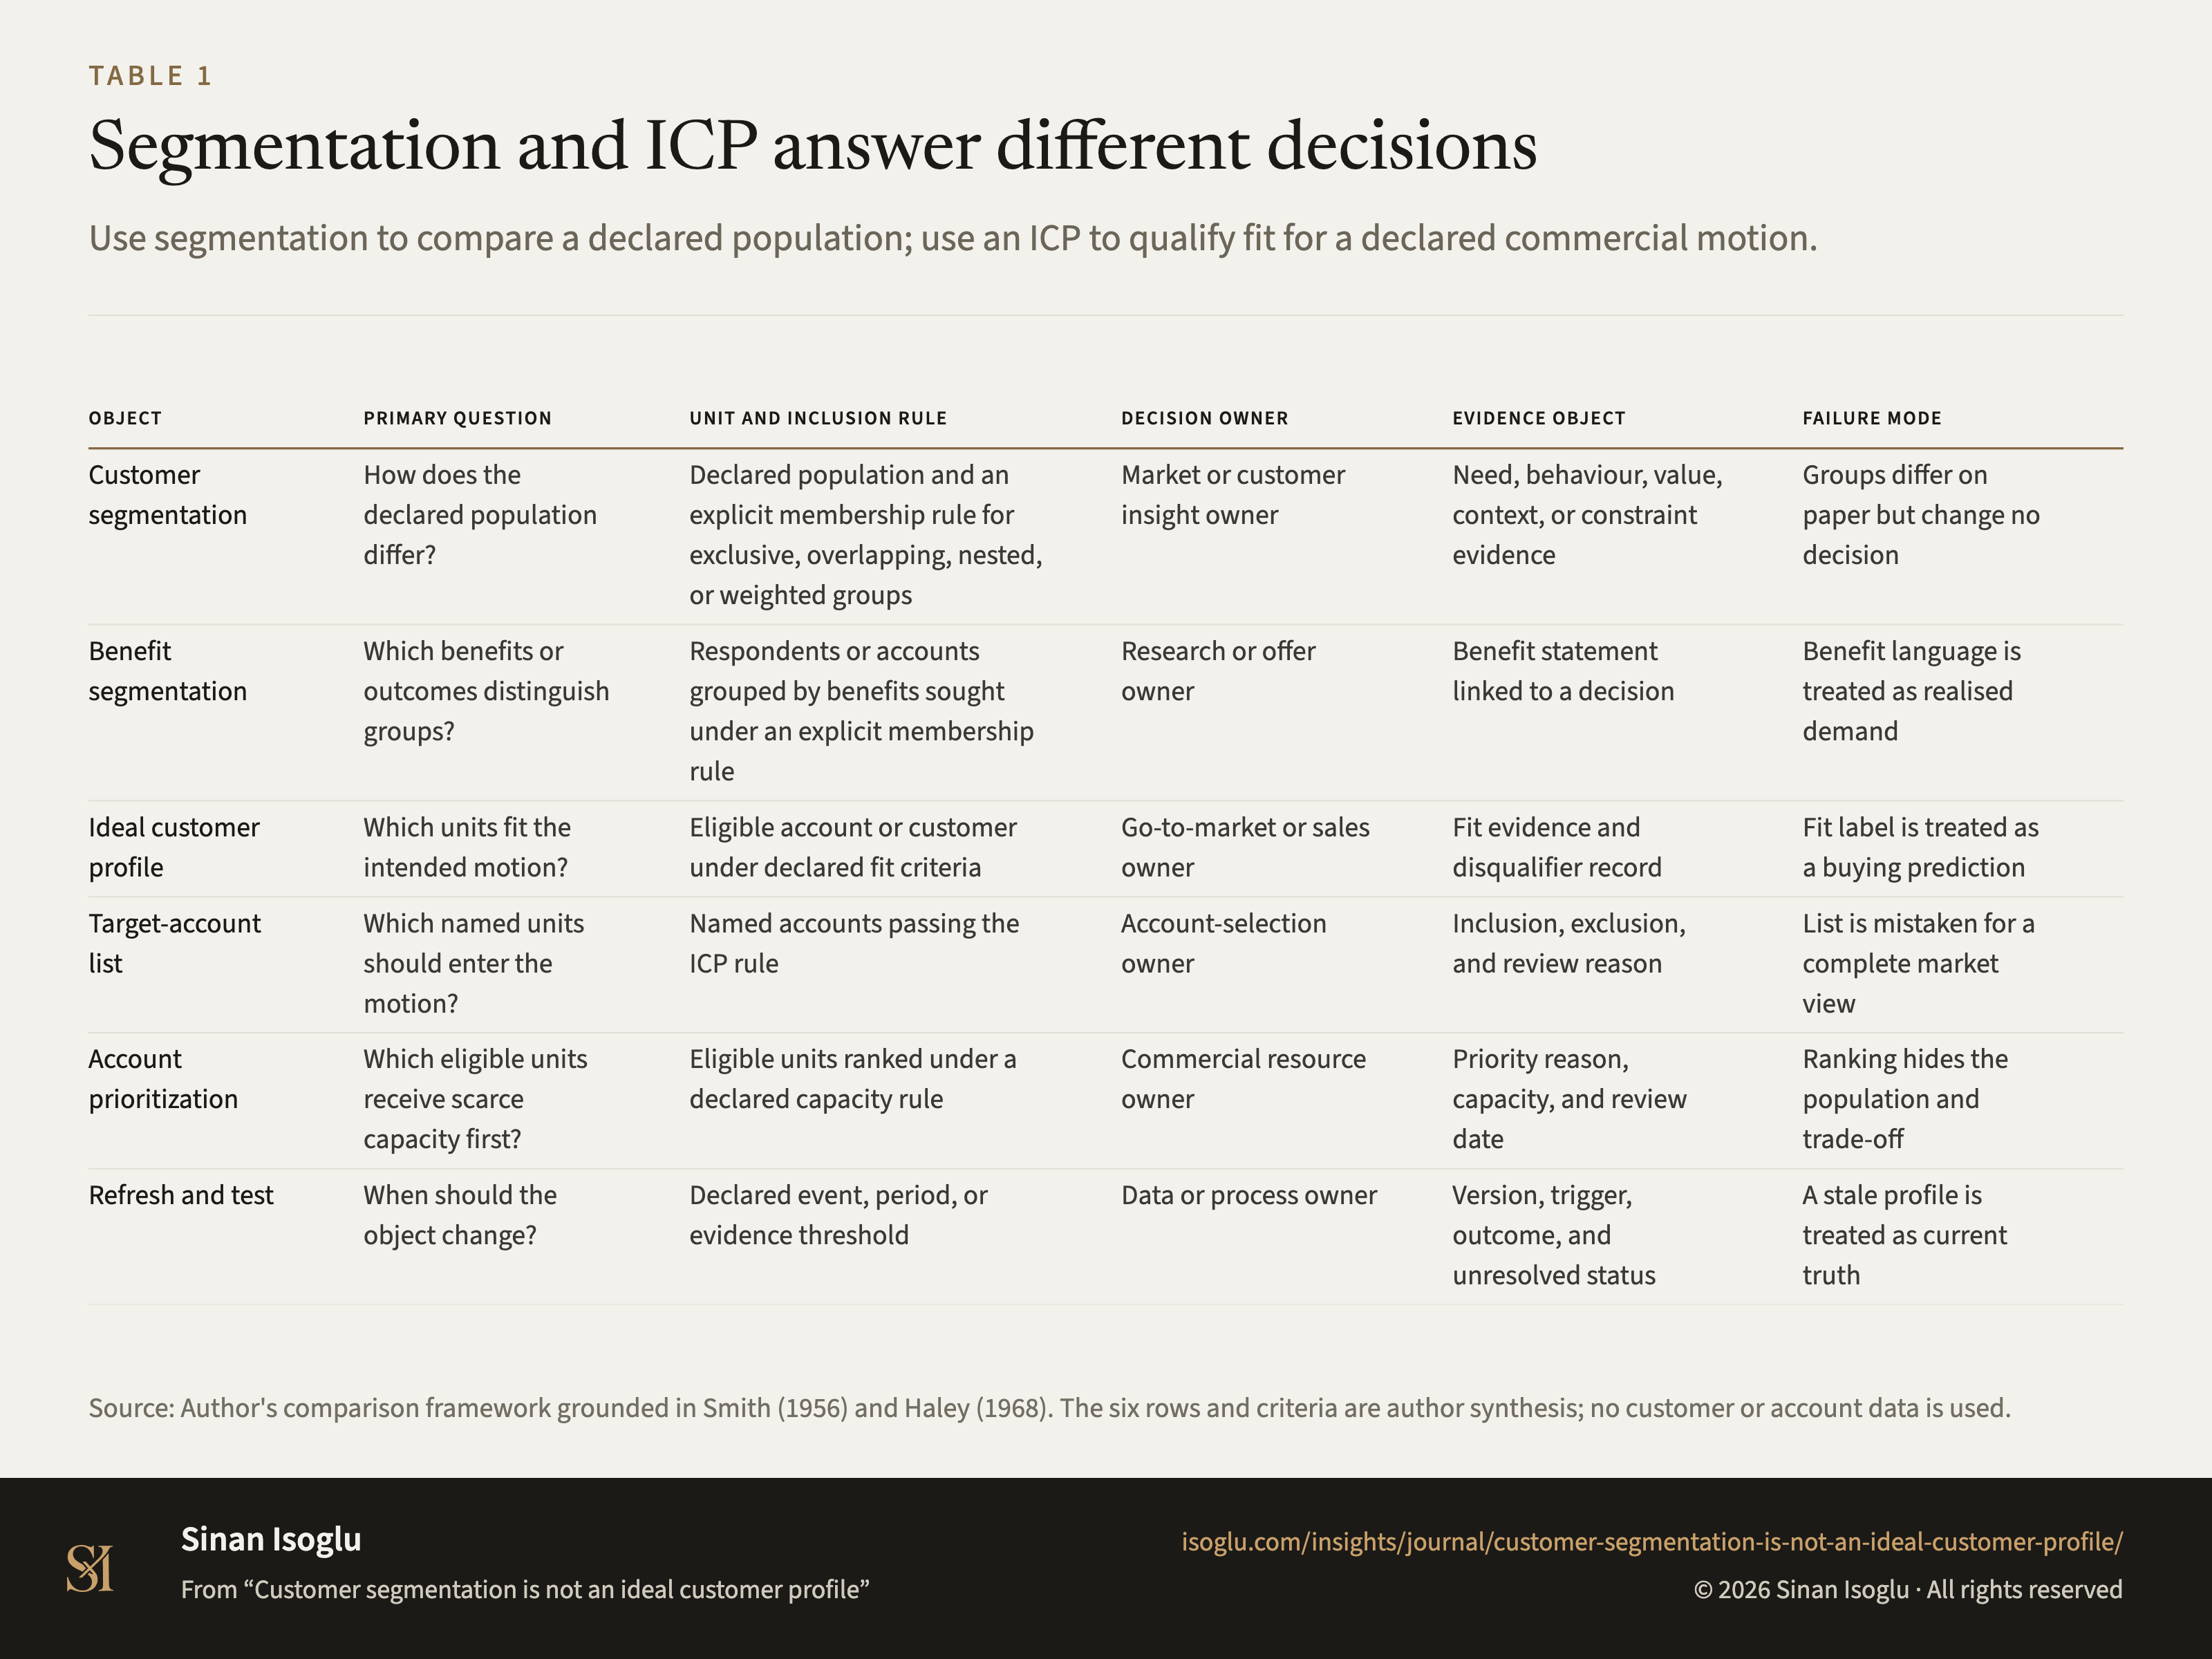
Table 1Table
Segmentation and ICP answer different decisions
Customer segmentation is not an ideal customer profile
Contact
Bring the question you're working on.
Research, a guest lecture, or a commercial question.