← Every exhibit

Figure 2From “Every growth budget is a gross number”

What the stop test reports when there is nothing to report

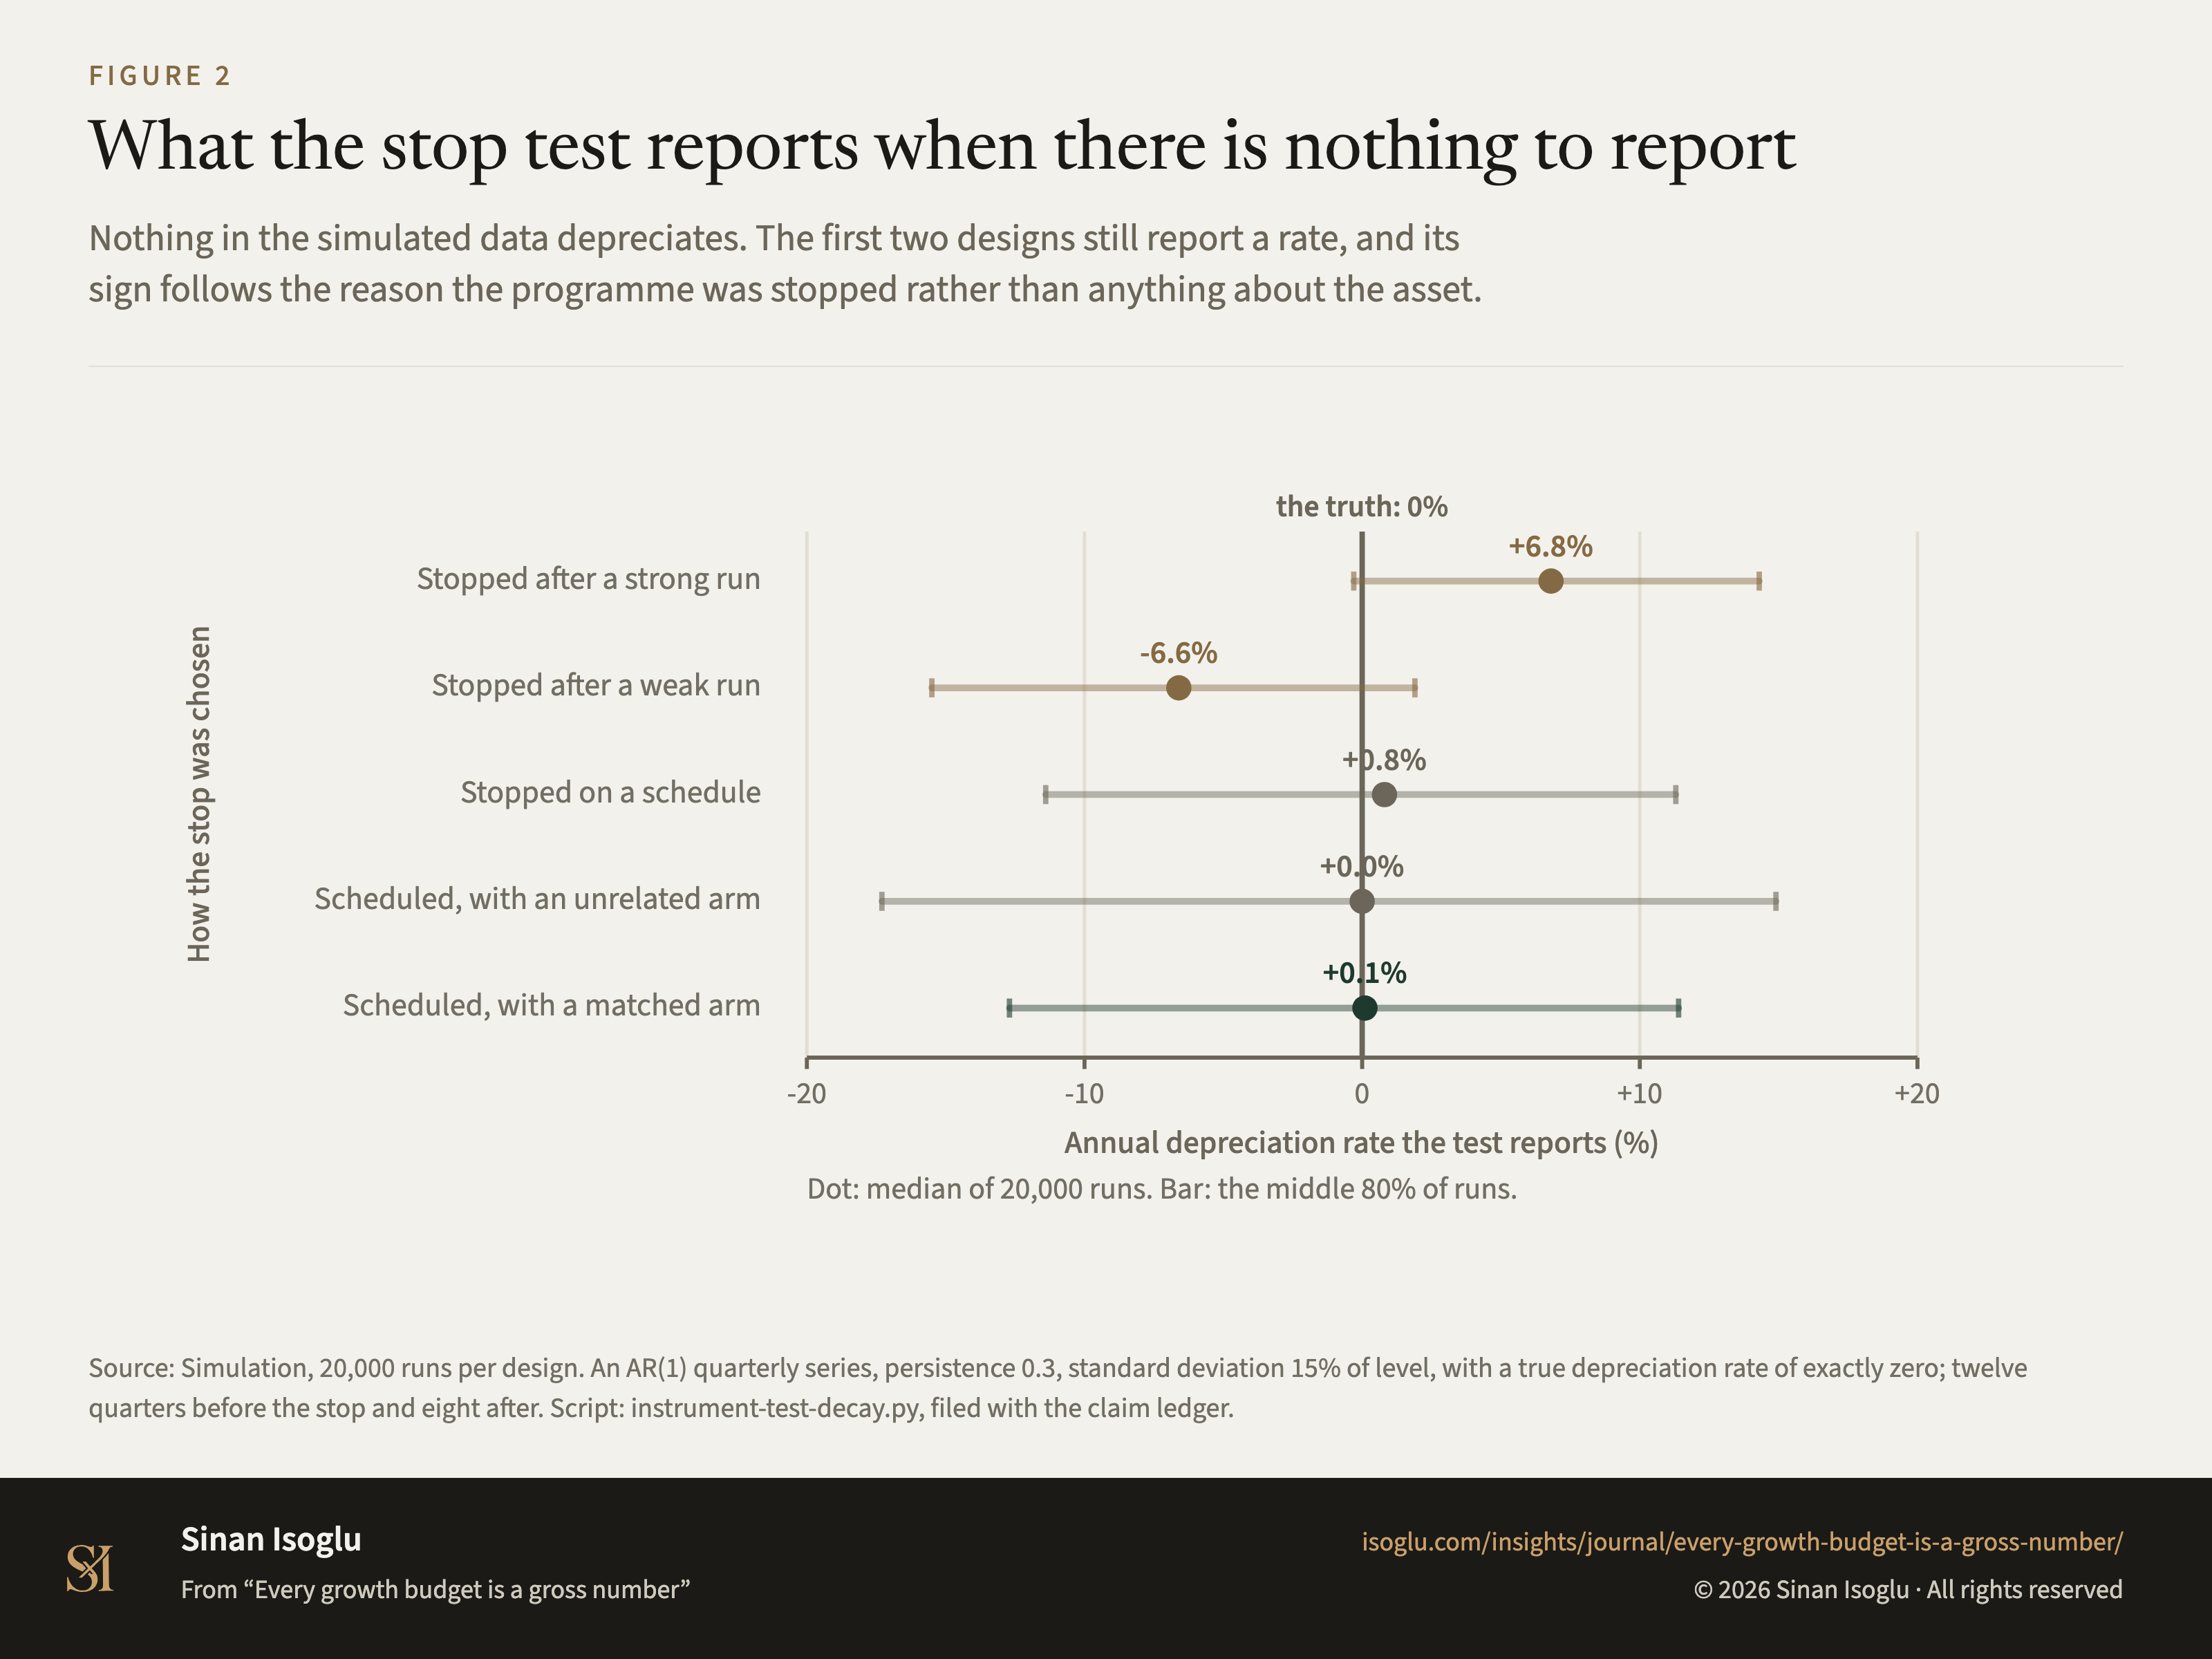
Nothing in the simulated data depreciates. The first two designs still report a rate, and its sign follows the reason the programme was stopped rather than anything about the asset.

Cite Embed

Figure 2What the stop test reports when there is nothing to report

What five versions of the stop test report when the true rate is zero A dot-and-range chart. The horizontal axis is the annual depreciation rate the test reports, from minus 20 to plus 20 per cent, with a heavy line at zero marking the truth. Four rows. Stopping after a strong run reports a median of plus 6.8 per cent. Stopping after a weak run reports minus 6.6 per cent. Stopping on a schedule reports plus 0.8 per cent but with a range from minus 11.4 to plus 11.3. Scheduling with a matched comparison arm reports plus 0.1 per cent over a similar range. the truth: 0% Stopped after a strong run +6.8% Stopped after a weak run -6.6% Stopped on a schedule +0.8% Scheduled, with an unrelated arm +0.0% Scheduled, with a matched arm +0.1% -20-100+10+20 Annual depreciation rate the test reports (%) How the stop was chosen Dot: median of 20,000 runs. Bar: the middle 80% of runs.

Source: Simulation, 20,000 runs per design. An AR(1) quarterly series, persistence 0.3, standard deviation 15% of level, with a true depreciation rate of exactly zero; twelve quarters before the stop and eight after. Script: instrument-test-decay.py, filed with the claim ledger.
PNG4:3, 1600 × 1200, with the title, the source line and the attribution set in the image isoglu-2026-every-growth-budget-is-a-gross-number-fig03.png

Cite or embed

APA 7

Isoglu, S. (2026). What the stop test reports when there is nothing to report [Figure]. isoglu.com. https://isoglu.com/insights/exhibits/isoglu-2026-every-growth-budget-is-a-gross-number-fig03/

BibTeX
@misc{isoglu-2026-every-growth-budget-is-a-gross-number-fig03,
  author = {Isoglu, Sinan},
  title = {{What the stop test reports when there is nothing to report}},
  year = {2026},
  howpublished = {Figure 2, isoglu.com},
  url = {https://isoglu.com/insights/exhibits/isoglu-2026-every-growth-budget-is-a-gross-number-fig03/},
  note = {From the essay {Every growth budget is a gross number}}
}
Embed this exhibit

Copy this HTML to use the PNG exhibit on your site with its source line and a link back to the exhibit page.

<figure>
  <a href="https://isoglu.com/insights/exhibits/isoglu-2026-every-growth-budget-is-a-gross-number-fig03/">
    <img src="https://isoglu.com/social/isoglu-2026-every-growth-budget-is-a-gross-number-fig03.png" alt="Figure 2: What the stop test reports when there is nothing to report" width="3200" height="2400">
  </a>
  <figcaption>Figure 2: What the stop test reports when there is nothing to report. Source: Simulation, 20,000 runs per design. An AR(1) quarterly series, persistence 0.3, standard deviation 15% of level, with a true depreciation rate of exactly zero; twelve quarters before the stop and eight after. Script: instrument-test-decay.py, filed with the claim ledger. <a href="https://isoglu.com/insights/exhibits/isoglu-2026-every-growth-budget-is-a-gross-number-fig03/">View exhibit</a>.</figcaption>
</figure>