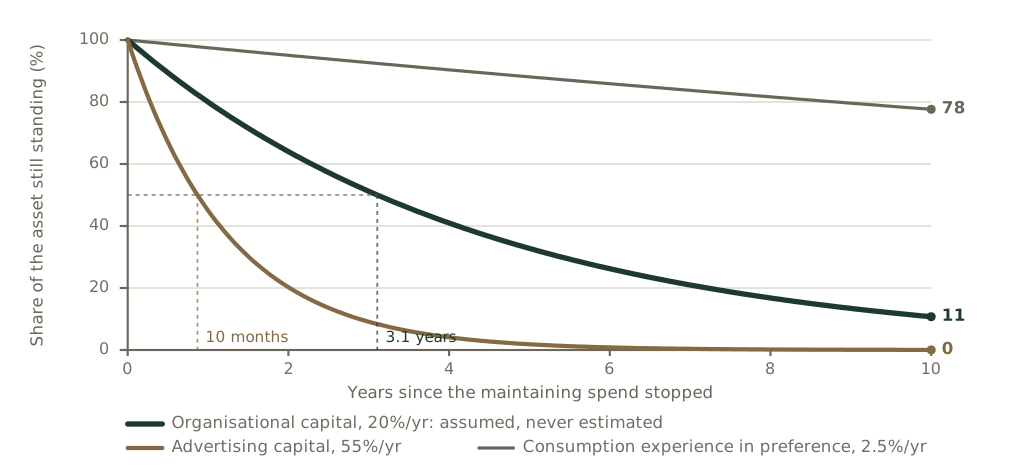
The same asset, left alone, at three published rates
Ten years after the maintaining spend stops, the same starting asset is at 78%, 11% or effectively nothing, depending only on which published rate you take. This is the spread a budget is asked to absorb.
Reference & Evidence
Source: Curves computed as (1 − d) raised to the power t, from the rates in Table 1: 2.5% a year (Bronnenberg, Dubé & Gentzkow 2012), 20% (the assumed organisational-capital rate, Ewens, Peters & Wang 2019, revised October 2023), 55% (Corrado et al. 2016 via Bronnenberg, Dubé & Syverson 2022). A disclosed model, not measured data.
Each line is a claim from the register this journal publishes against, resolved from the register at build time.
- A The 2.5% rate measures decay of one year's consumption experiences in brand preference, not advertising capital Bronnenberg, Dube & Gentzkow (2012), p. 2474 ·
BDG12-C1 - A The organisational-capital depreciation rate is assumed rather than estimated, which is why the paper's own contrast is with the estimated R&D rate: "The results of our parameter estimation imply an average 33% annual depreciation rate for R&D versus 23% for BEA R&D depreciation rates where industry coverage is available" Ewens, Peters & Wang (2019, revised 2023), note to Table 1 ·
EPW24-C1 - A They adopt a 55% annual advertising-capital depreciation rate from Corrado et al. (2016) Bronnenberg, Dube & Syverson (2022), section II ·
BDS22-C2
Grades: A, verified against the printed page of the primary source · B, primary source, text layer only · C, authoritative secondary · D, reported.
Related exhibits
-
Every published depreciation rate, and what it was measured on
From the essay Every growth budget is a gross number
-
How much of a change in spending has reached the asset
From the essay Every growth budget is a gross number
-
What the stop test reports when there is nothing to report
From the essay Every growth budget is a gross number