Table 1From “Every growth budget is a gross number”
Every published depreciation rate, and what it was measured on
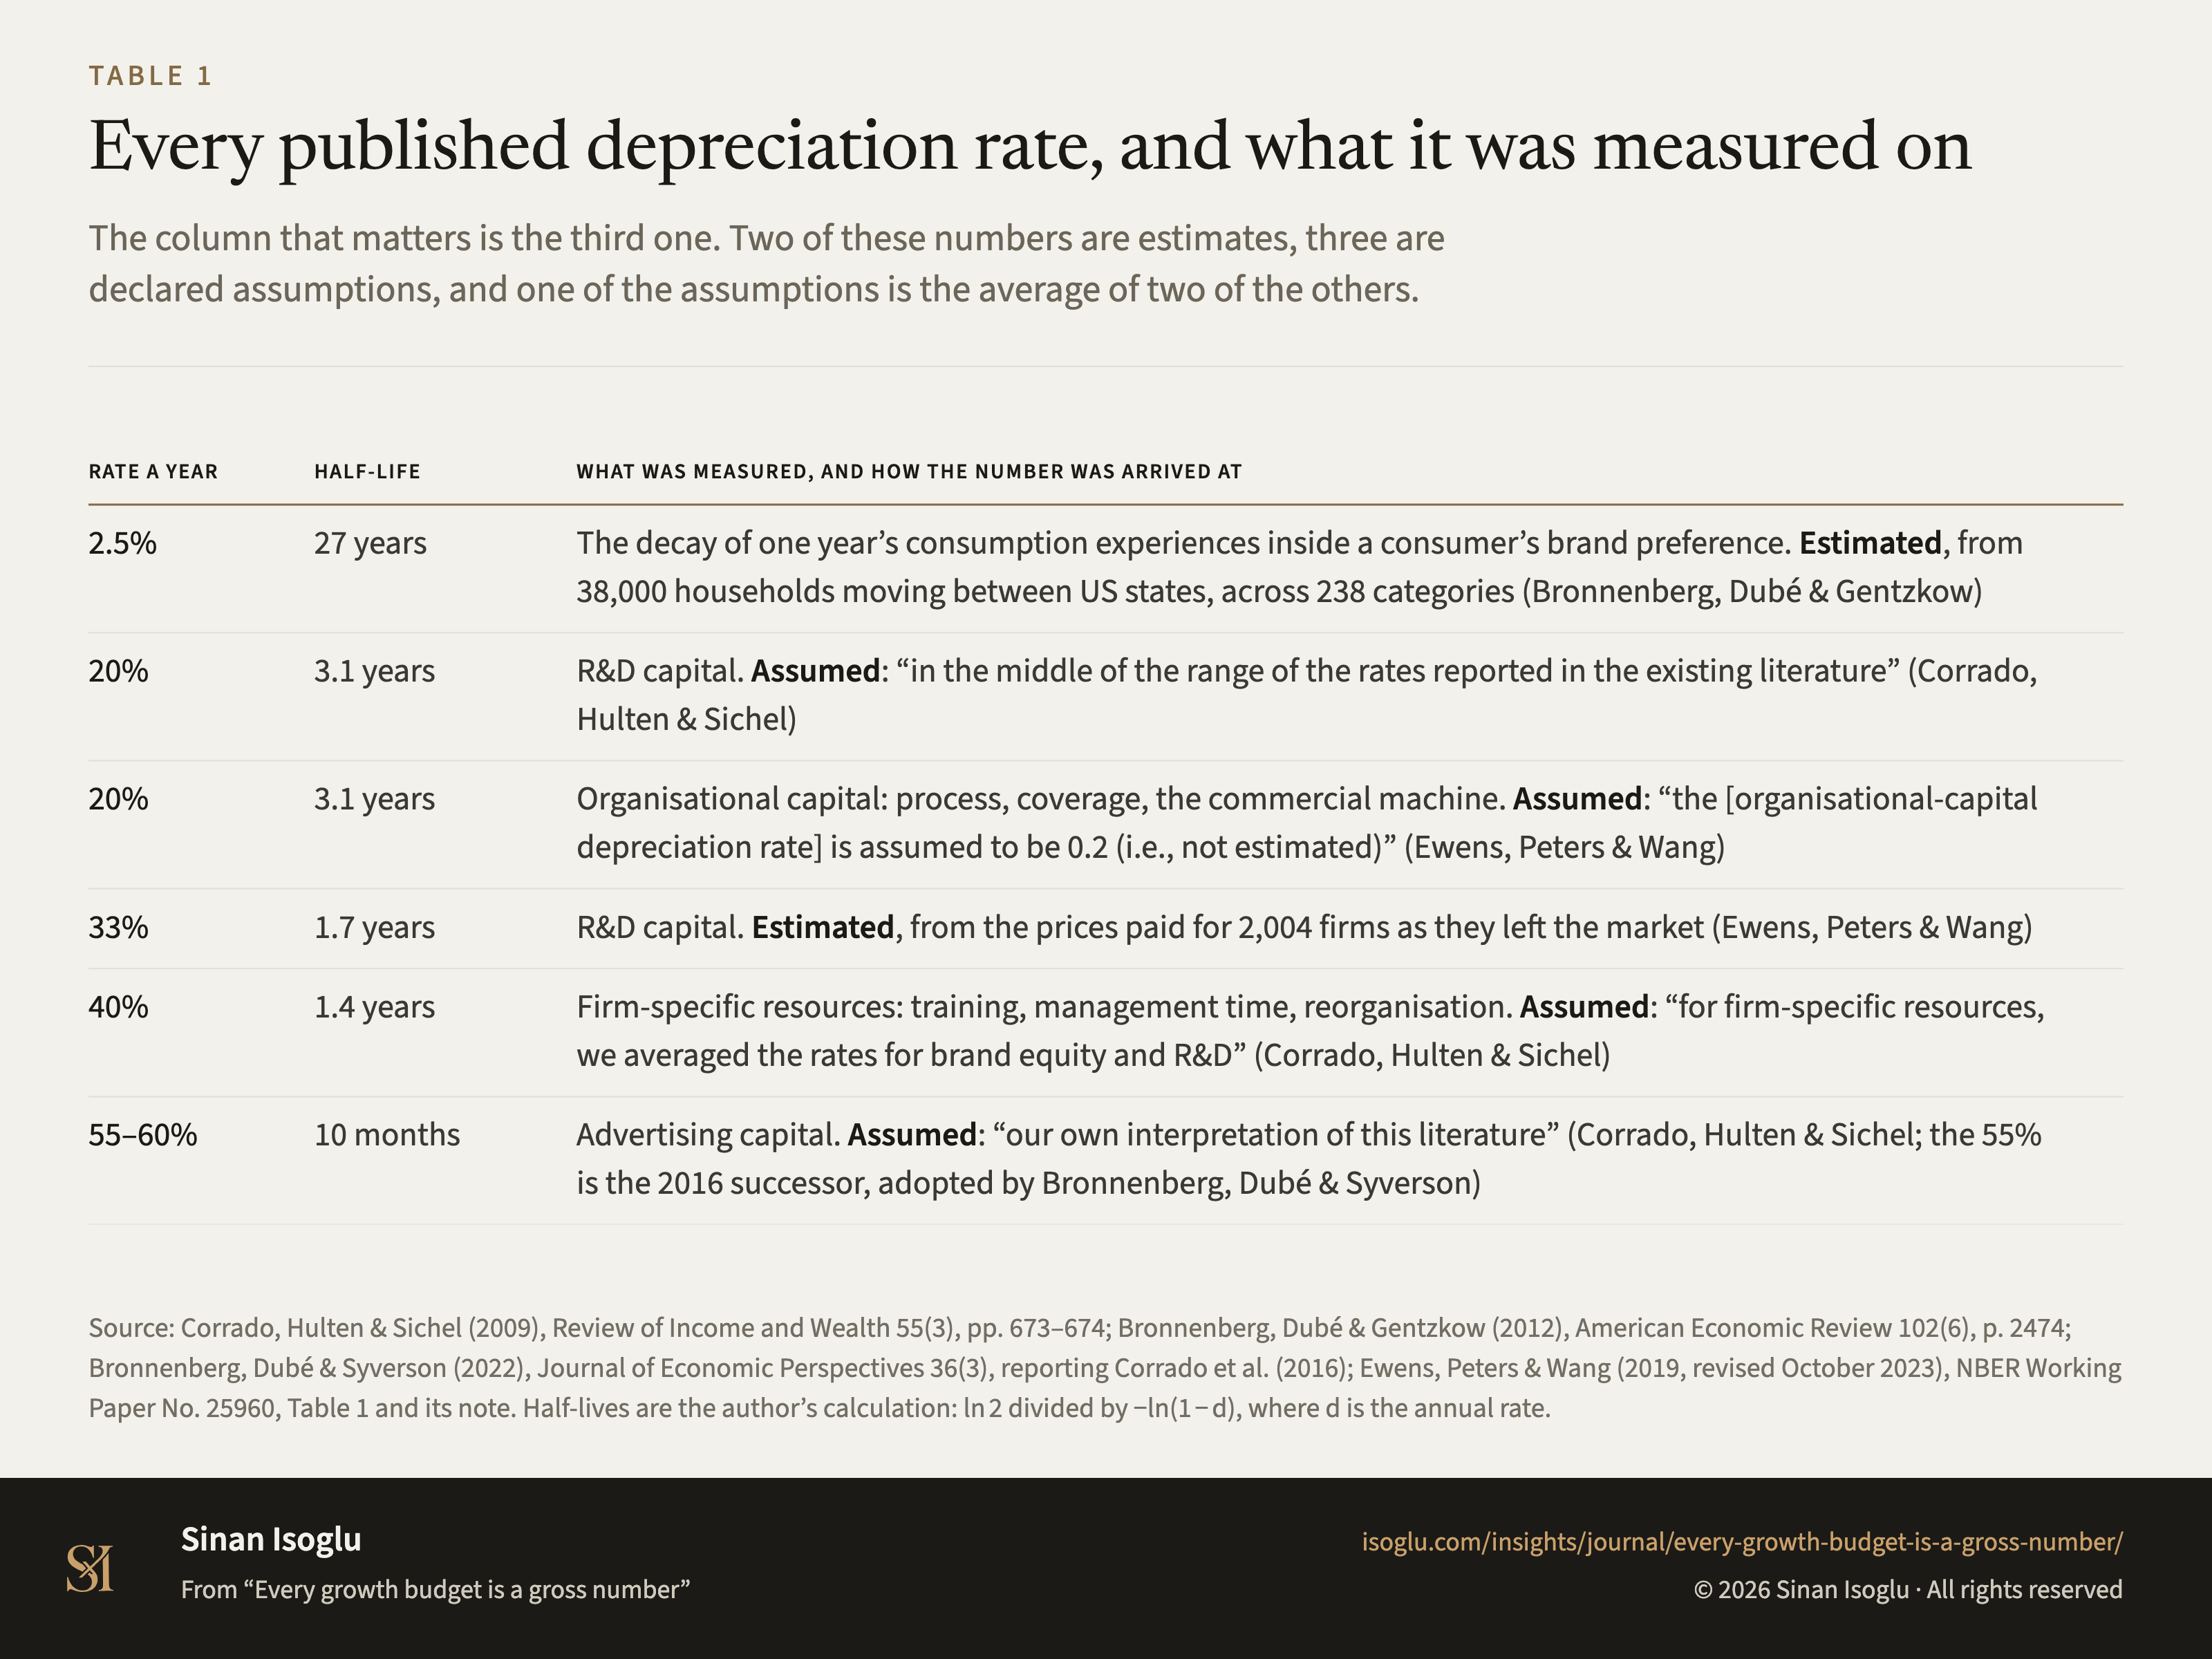
The column that matters is the third one. Two of these numbers are estimates, three are declared assumptions, and one of the assumptions is the average of two of the others.
Table 1Every published depreciation rate, and what it was measured on
| Rate a year | Half-life | What was measured, and how the number was arrived at |
|---|---|---|
| 2.5% | 27 years | The decay of one year's consumption experiences inside a consumer's brand preference. Estimated, from 38,000 households moving between US states, across 238 categories (Bronnenberg, Dubé & Gentzkow) |
| 20% | 3.1 years | R&D capital. Assumed: "in the middle of the range of the rates reported in the existing literature" (Corrado, Hulten & Sichel) |
| 20% | 3.1 years | Organisational capital: process, coverage, the commercial machine. Assumed: "the [organisational-capital depreciation rate] is assumed to be 0.2 (i.e., not estimated)" (Ewens, Peters & Wang) |
| 33% | 1.7 years | R&D capital. Estimated, from the prices paid for 2,004 firms as they left the market (Ewens, Peters & Wang) |
| 40% | 1.4 years | Firm-specific resources: training, management time, reorganisation. Assumed: "for firm-specific resources, we averaged the rates for brand equity and R&D" (Corrado, Hulten & Sichel) |
| 55–60% | 10 months | Advertising capital. Assumed: "our own interpretation of this literature" (Corrado, Hulten & Sichel; the 55% is the 2016 successor, adopted by Bronnenberg, Dubé & Syverson) |
Swipe or scroll horizontally if the table is wider than your screen.
Source: Corrado, Hulten & Sichel (2009), Review of Income and Wealth 55(3), pp. 673–674; Bronnenberg, Dubé & Gentzkow (2012), American Economic Review 102(6), p. 2474; Bronnenberg, Dubé & Syverson (2022), Journal of Economic Perspectives 36(3), reporting Corrado et al. (2016); Ewens, Peters & Wang (2019, revised October 2023), NBER Working Paper No. 25960, Table 1 and its note. Half-lives are the author’s calculation: ln 2 divided by −ln(1 − d), where d is the annual rate.
Source and evidence
Each line names a claim related to this exhibit, its source, and how it was checked.
- A CHS09-C1 The rates are assumed because they are not known: "relatively little is known about depreciation rates for intangibles". They are assumptions, not estimatesCorrado, Hulten & Sichel (2009), pp. 673-674
- A CHS09-C2 The assumed rates, verbatim from the table: "computerized information other than software 33 r d scientific 20 r d non scientific 20 brand equity 60 firm specific resources 40" percentCorrado, Hulten & Sichel (2009), Table at p. 673
- A CHS09-C3 The firm-specific resources rate is the mean of the brand equity and R&D ratesCorrado, Hulten & Sichel (2009), p. 674
- A CHS09-C4 The advertising rate is the authors' interpretation of a contested literatureCorrado, Hulten & Sichel (2009), p. 674
- A BDG12-C1 The 2.5% rate measures decay of one year's consumption experiences in brand preference, not advertising capitalBronnenberg, Dube & Gentzkow (2012), p. 2474
- A BDG12-C2 The study covers 238 consumer packaged-goods categories and more than 38,000 householdsBronnenberg, Dube & Gentzkow (2012), Table 2
- A BDS22-C1 The advertising-capital decay debate remains unresolved after decades of studyBronnenberg, Dube & Syverson (2022), section II
- A BDS22-C2 They adopt a 55% annual advertising-capital depreciation rate from Corrado et al. (2016)Bronnenberg, Dube & Syverson (2022), section II
- A EPW24-C1 The organisational-capital depreciation rate is assumed rather than estimated, which is why the paper's own contrast is with the estimated R&D rate: "The results of our parameter estimation imply an average 33% annual depreciation rate for R&D versus 23% for BEA R&D depreciation rates where industry coverage is available"Ewens, Peters & Wang (2019, revised 2023), note to Table 1
- A EPW24-C5 R&D depreciation is estimated, not assumed, and it moves with R&D intensity: "we find a significantly higher depreciation rate for the two industries with the highest R&D intensity: healthcare (33% vs 17%) and high-tech (42% vs 28%)"Ewens, Peters & Wang (2019, revised 2023), Table 1
Grades: A, verified against the printed page of the primary source · B, primary source, text layer only · C, authoritative secondary · D, reported.
From the essay
Growth that compounds
Every growth budget is a gross number
A budget records what will be spent. It does not record what wears out as you spend it, and only the second number says whether the year added anything.
Read the essayThis exhibit belongs to an essay: the numbers live here, the argument lives there.
Cite or embed
Related exhibits
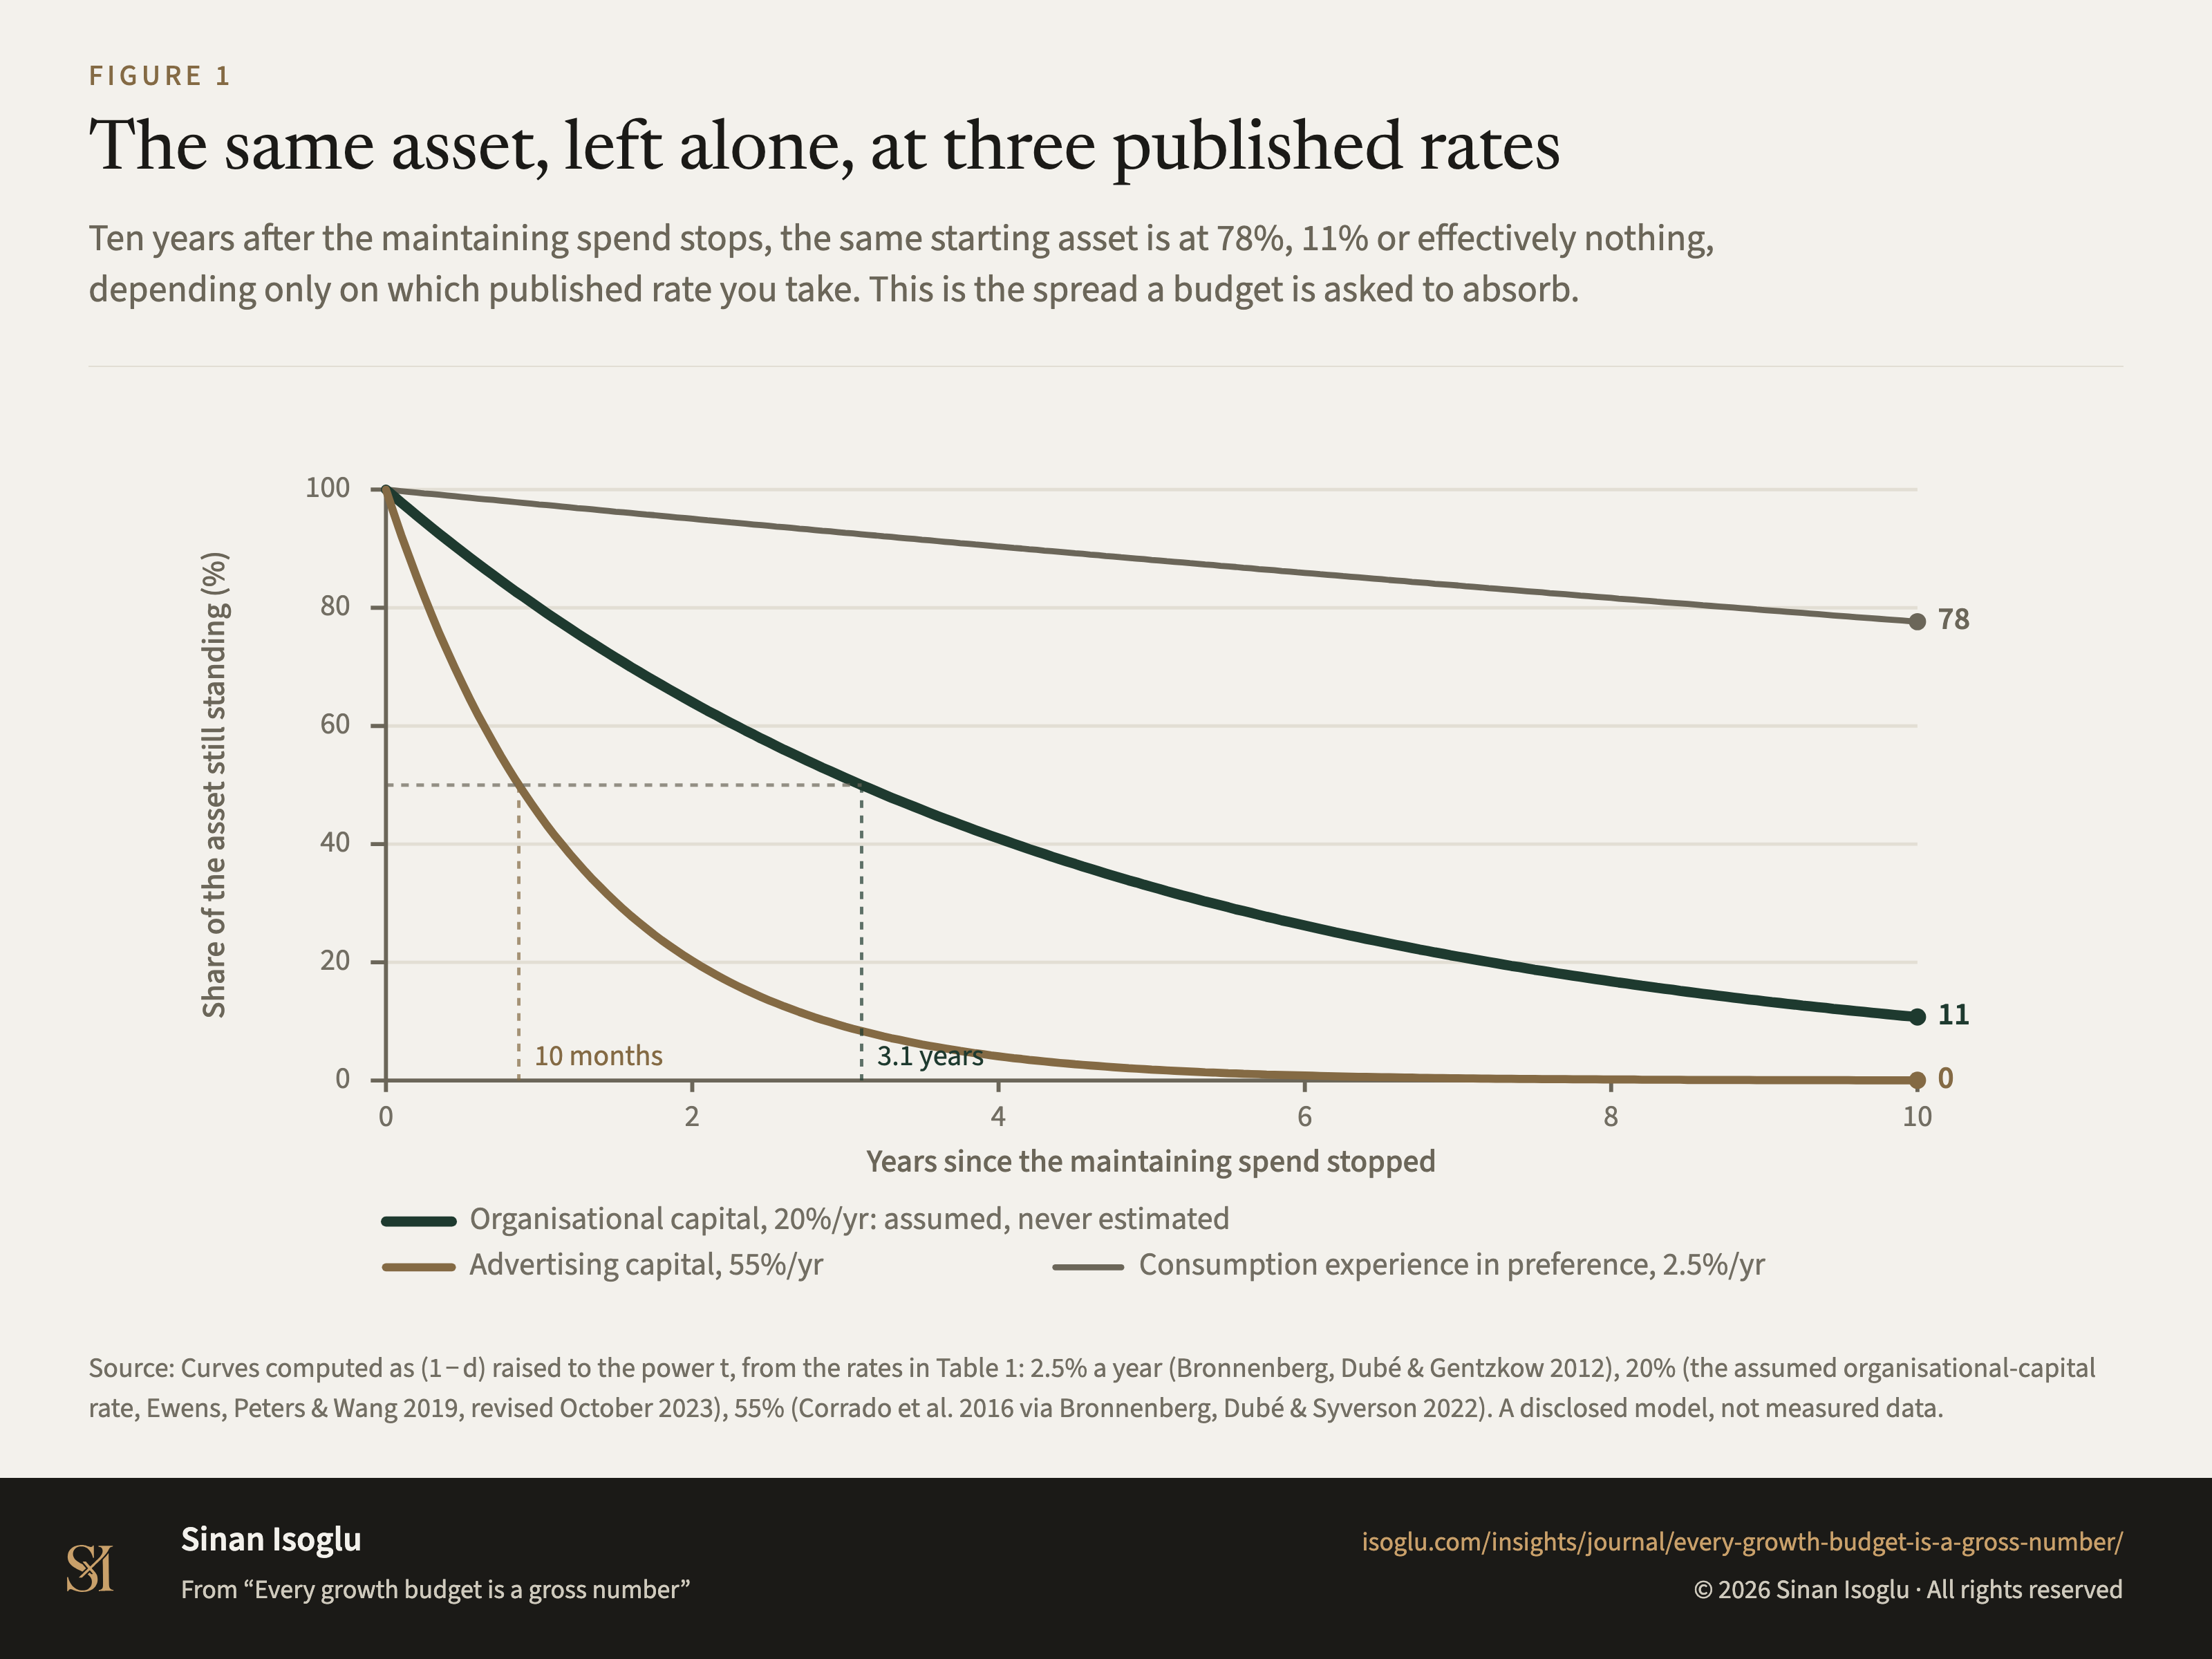
Figure 1Figure
The same asset, left alone, at three published rates
Every growth budget is a gross number
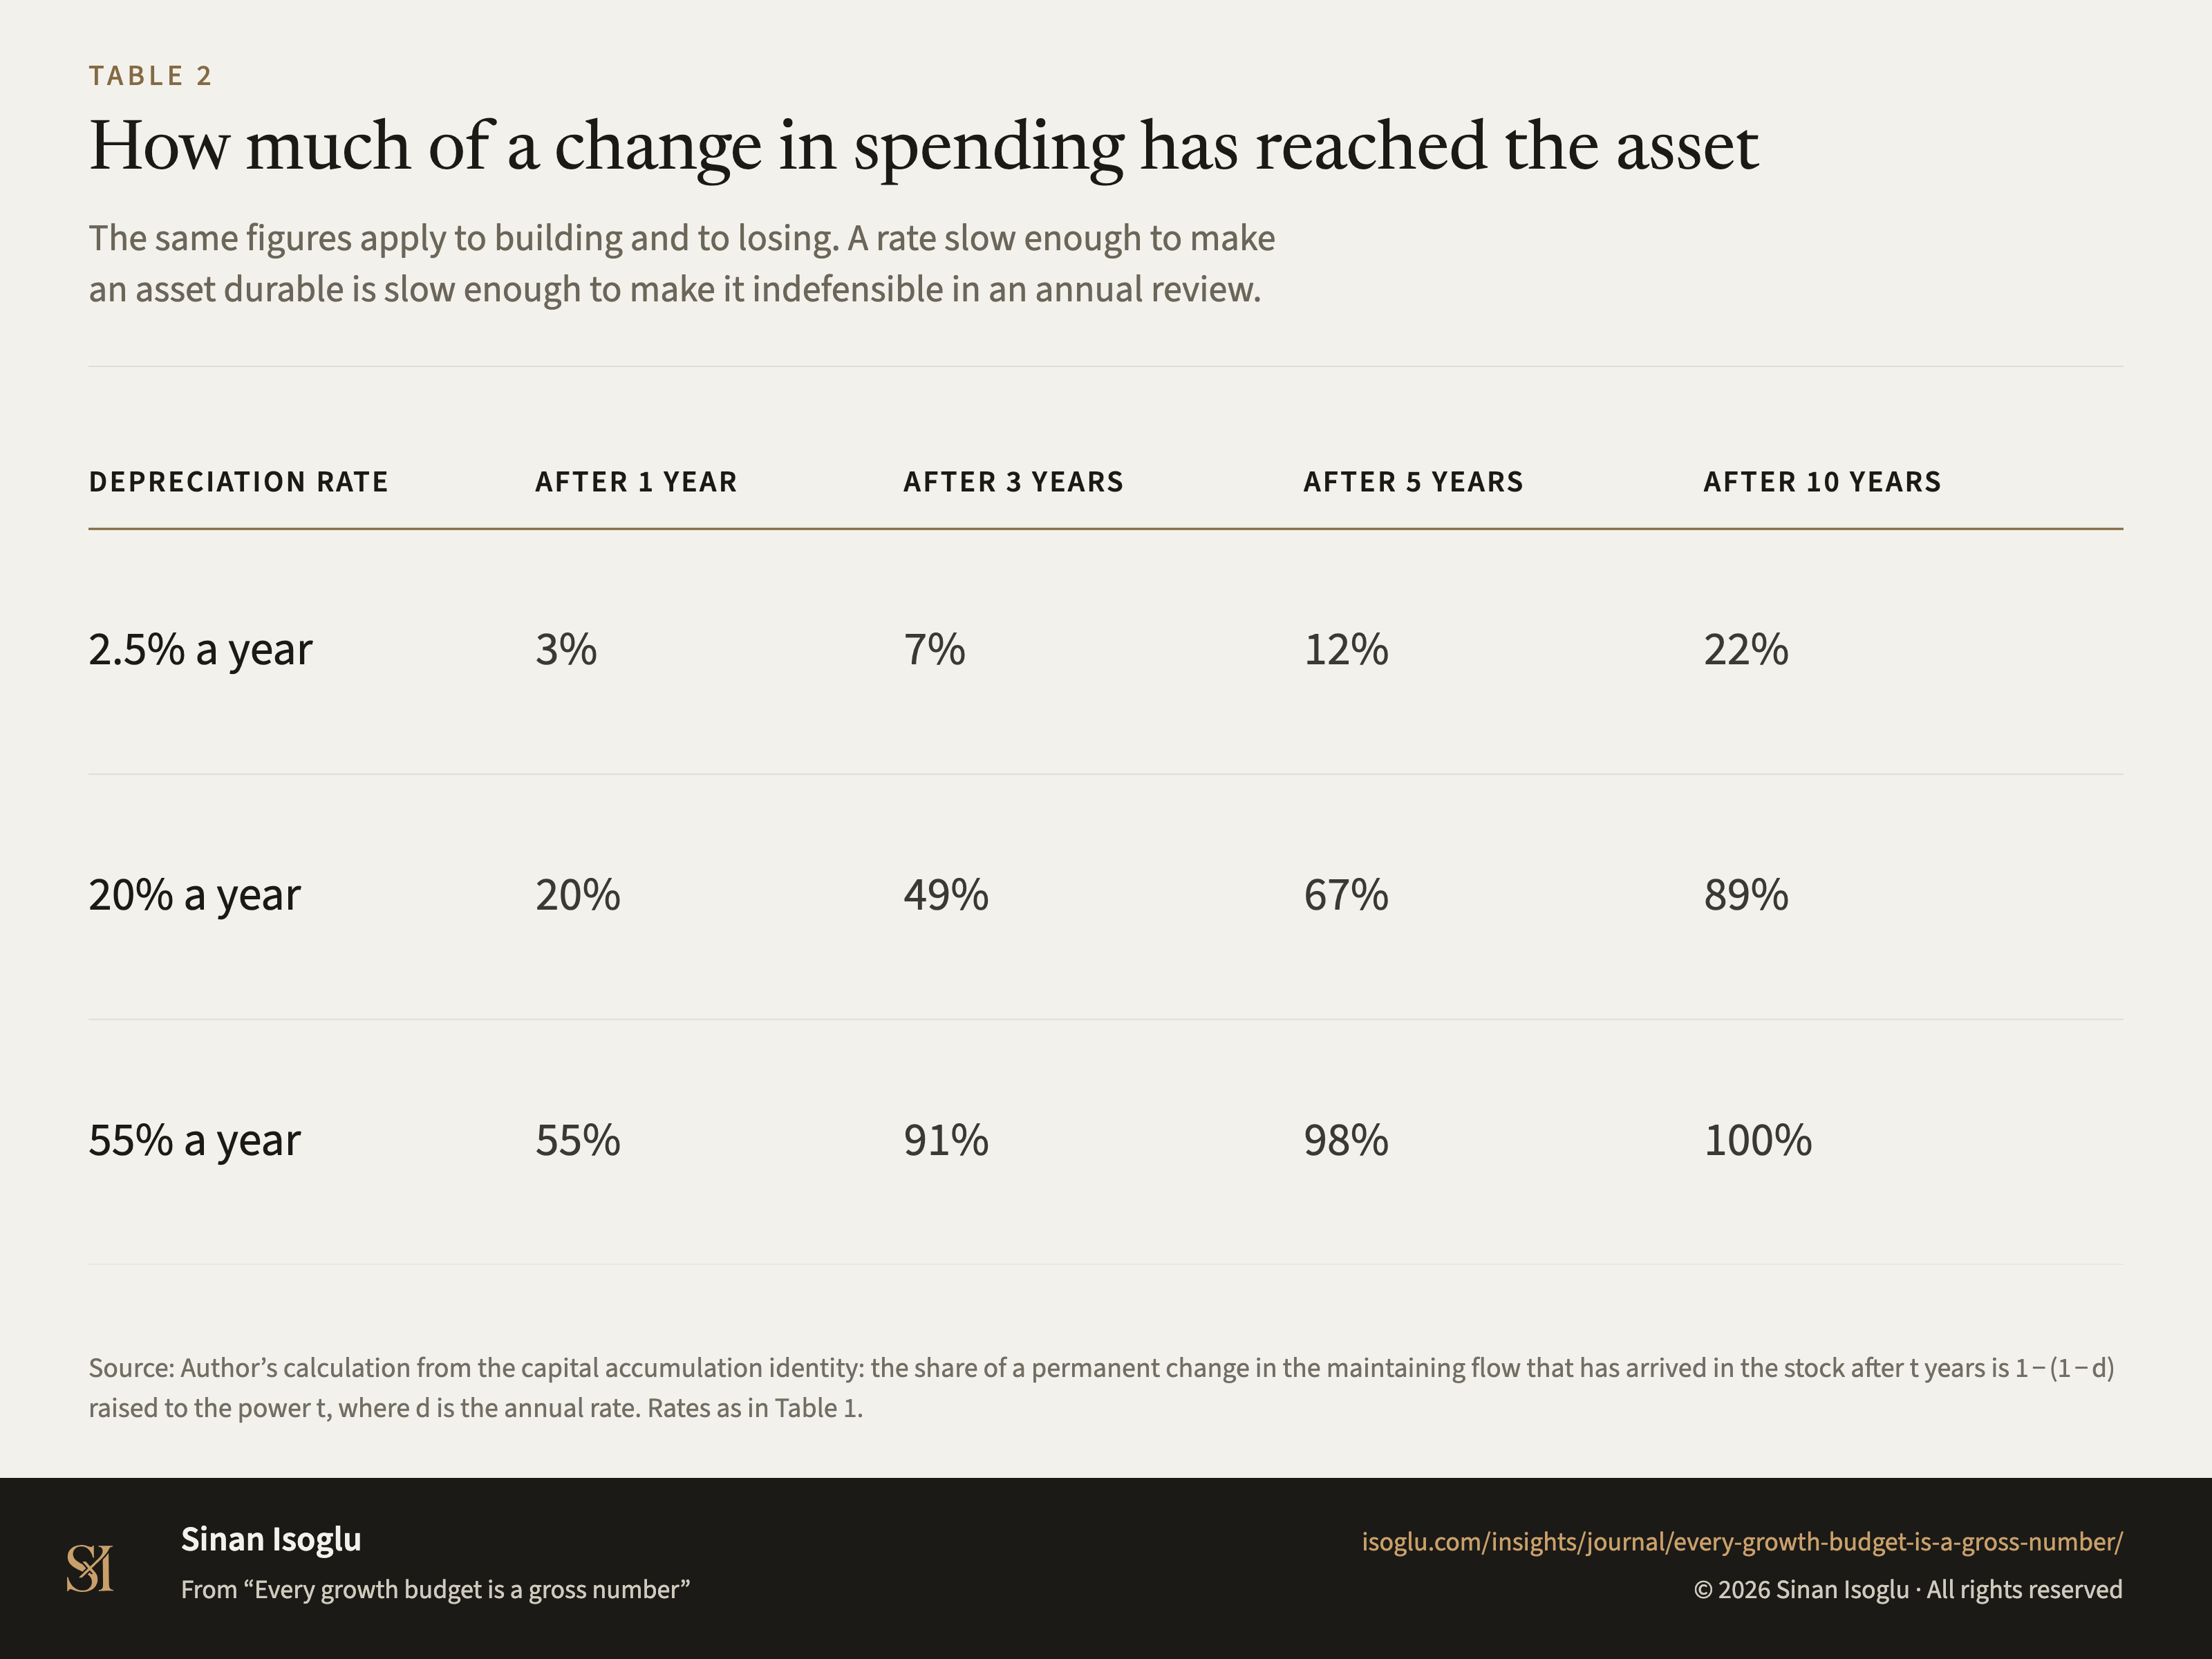
Table 2Table
How much of a change in spending has reached the asset
Every growth budget is a gross number
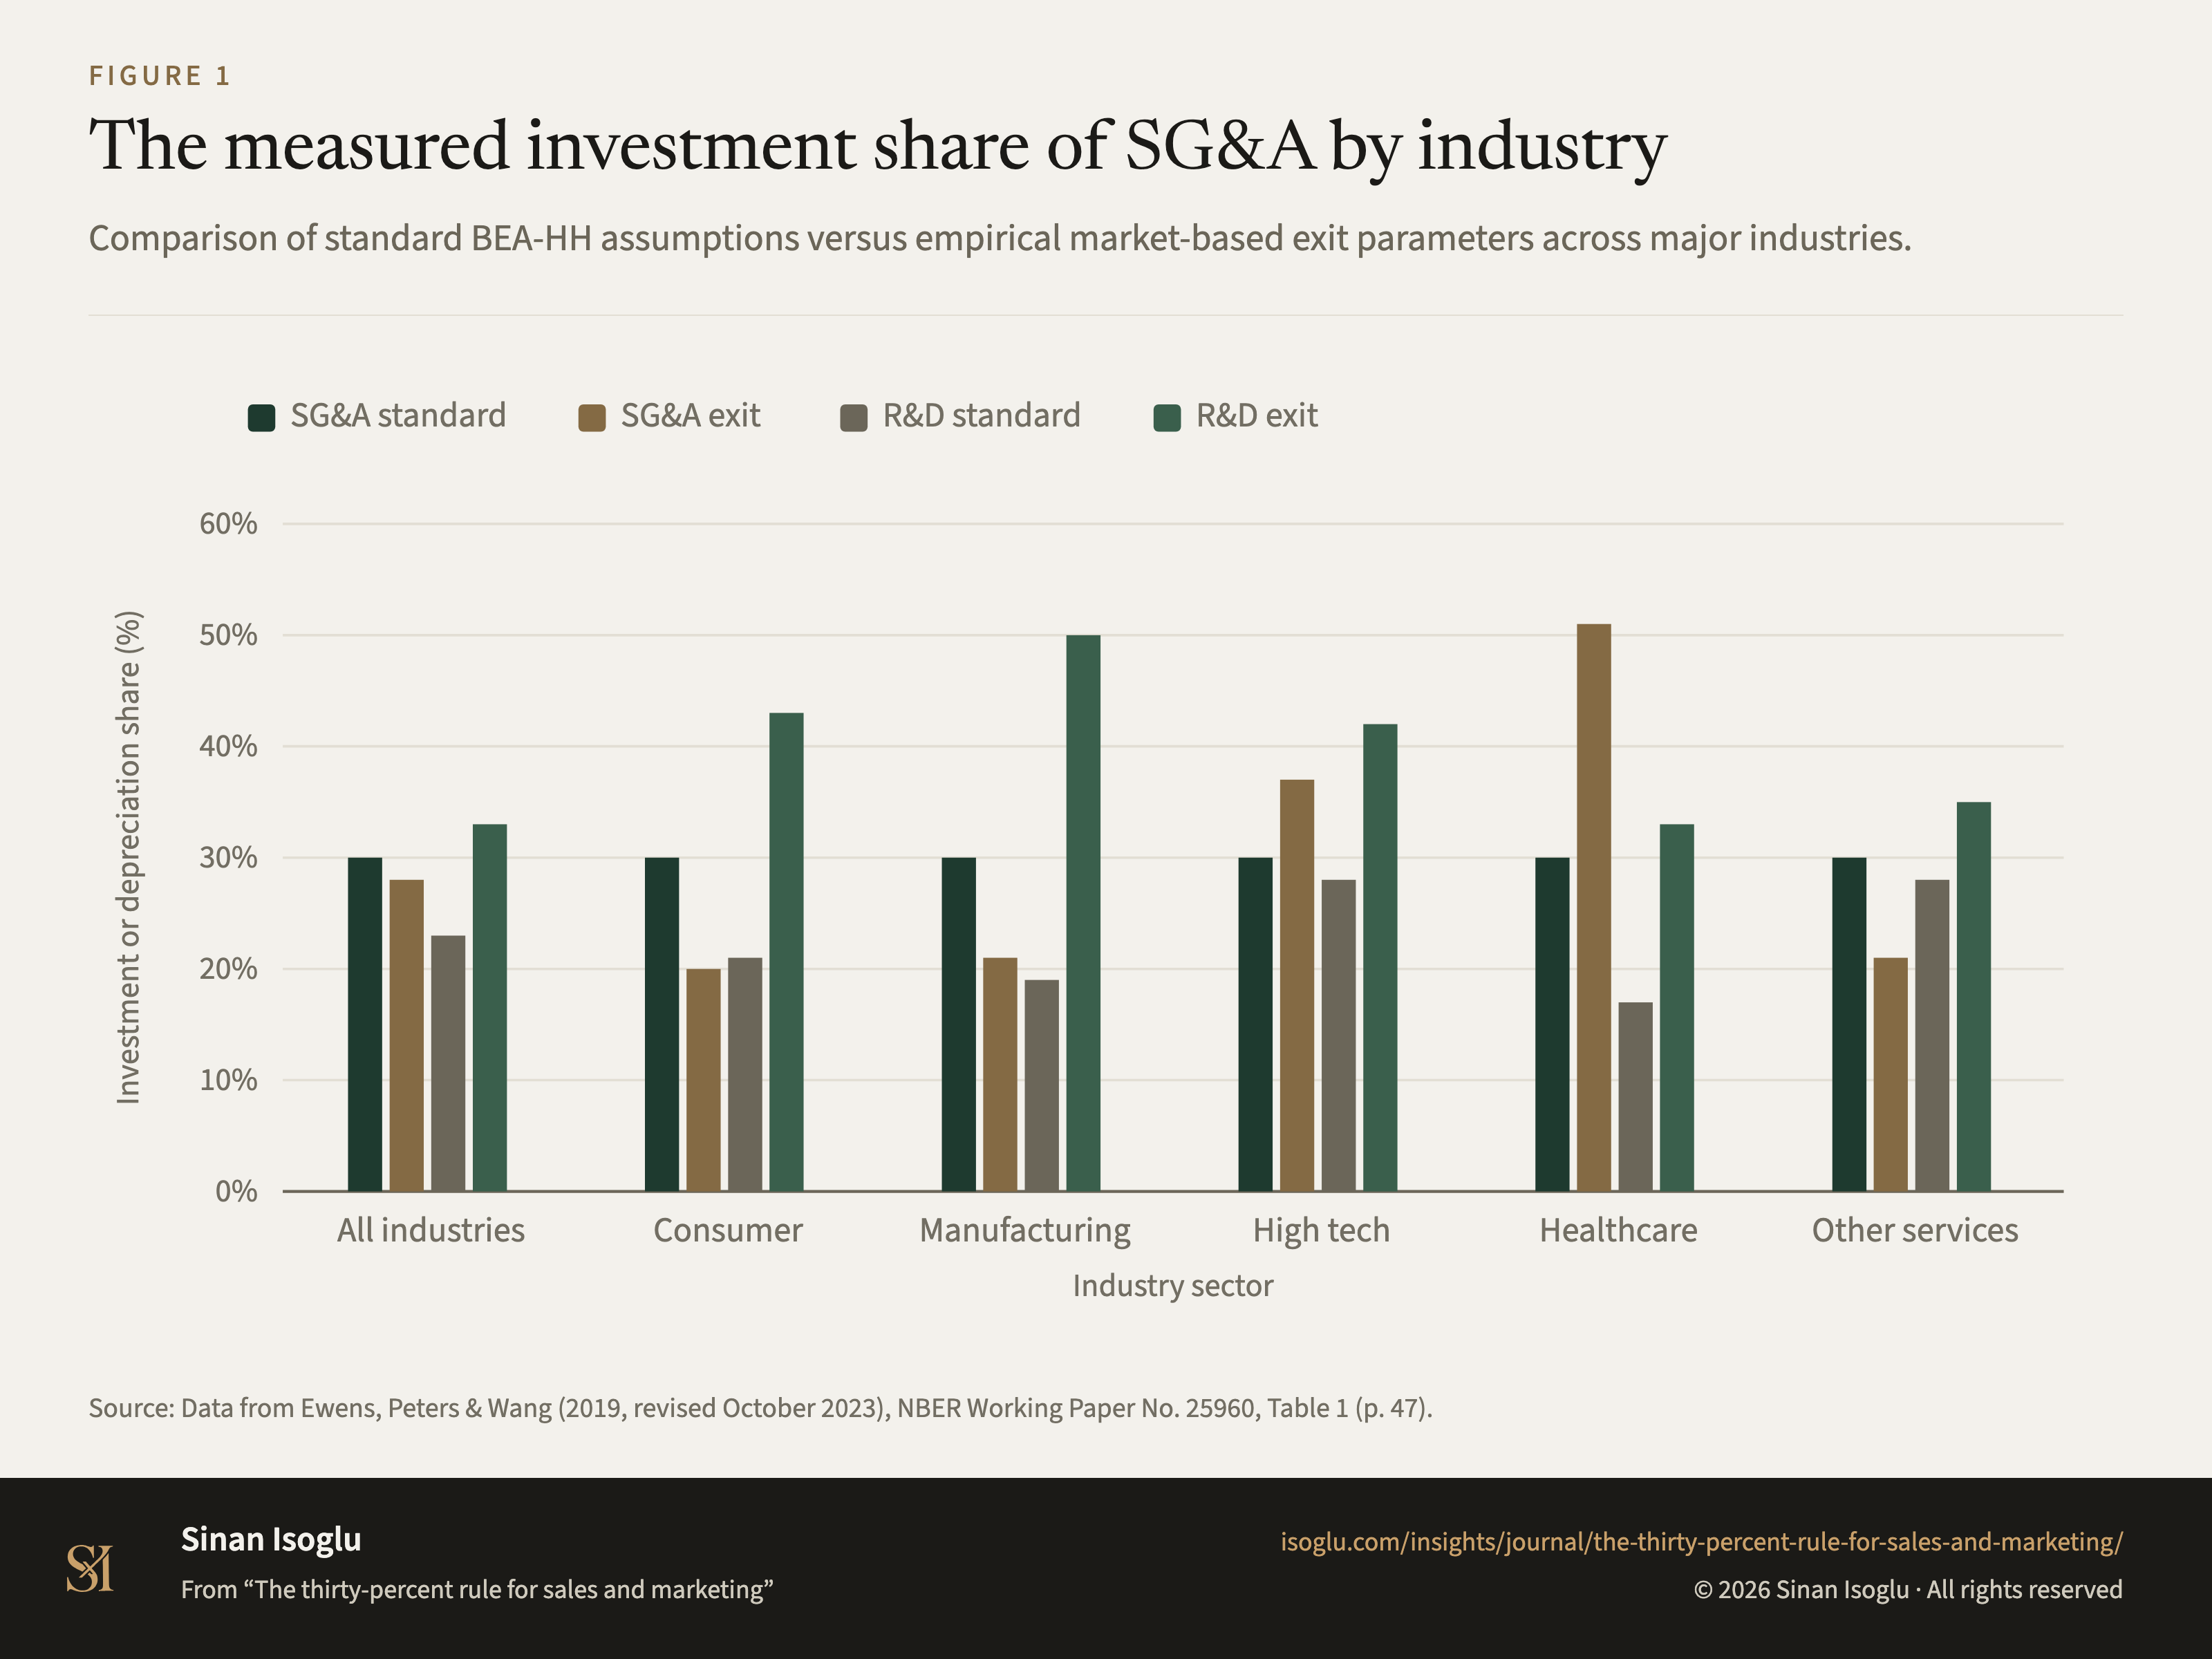
Figure 1Figure
The measured investment share of SG&A by industry
The thirty-percent rule for sales and marketing
Contact
Bring the question you're working on.
Research, a guest lecture, or a commercial question.