Figure 2From “A flat rate buys your customer’s worst month.”
Same average, different tail
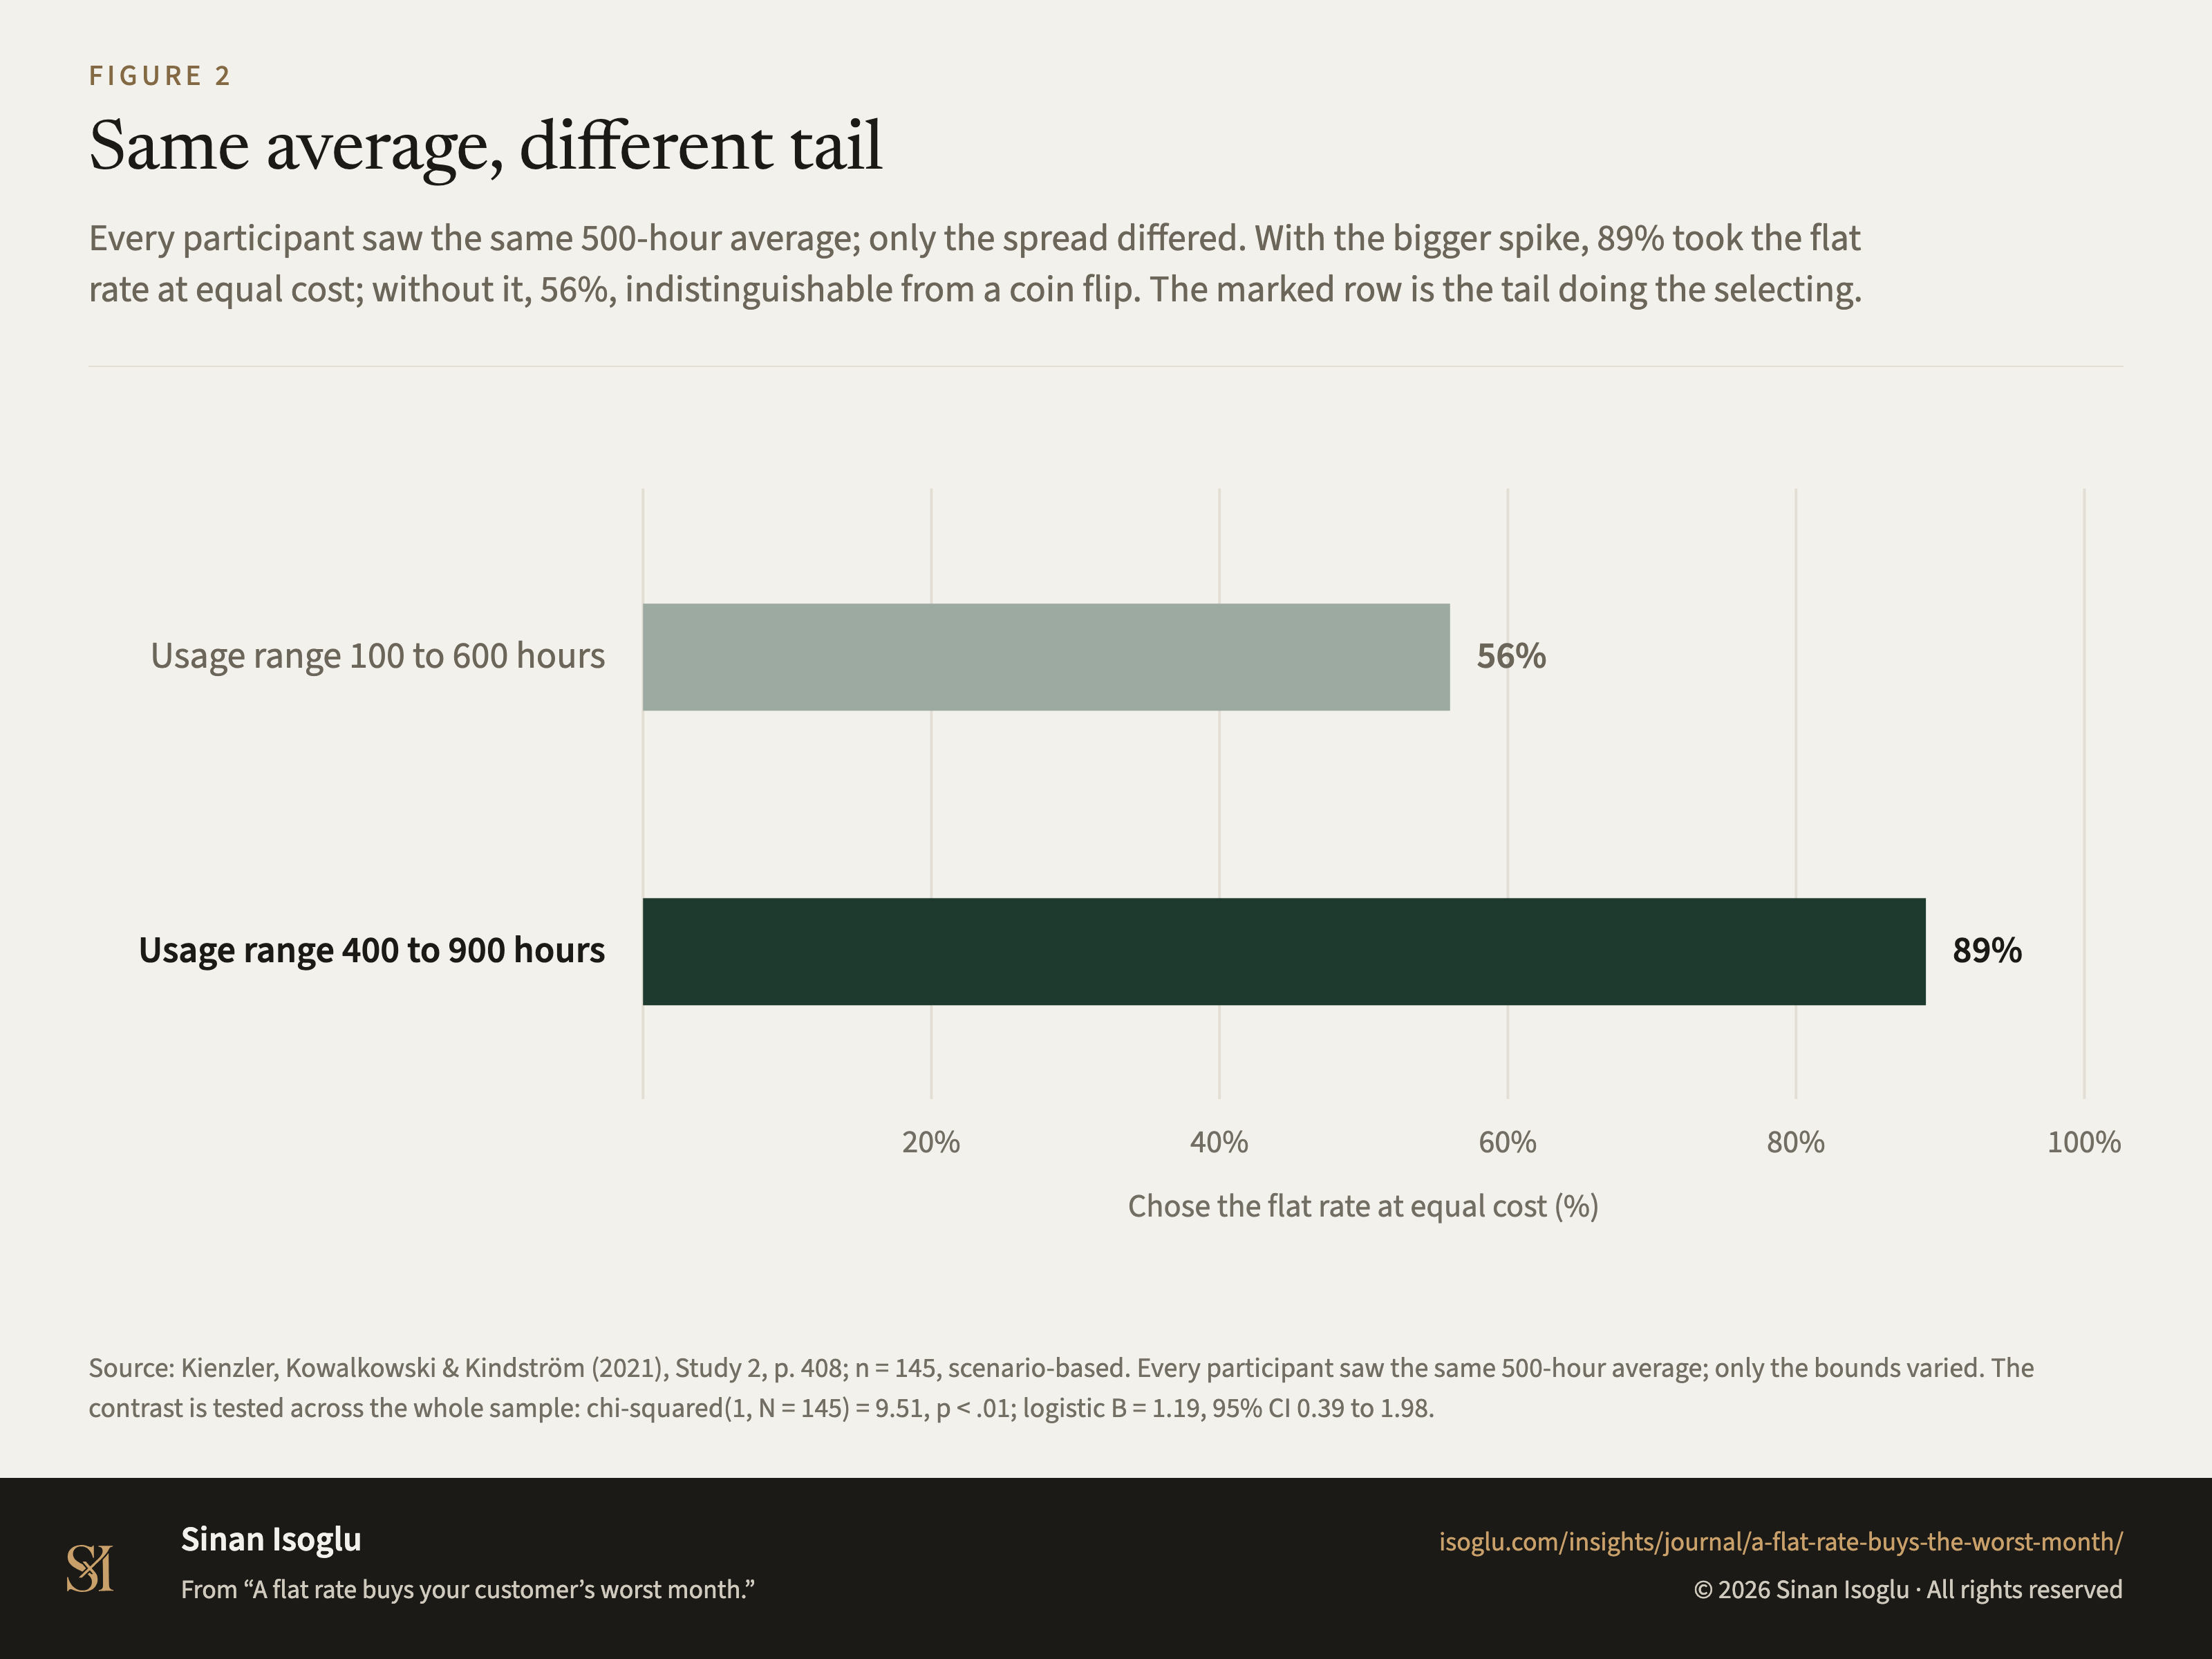
Every participant saw the same 500-hour average; only the spread differed. With the bigger spike, 89% took the flat rate at equal cost; without it, 56%, indistinguishable from a coin flip. The marked row is the tail doing the selecting.
Figure 2Same average, different tail
Source: Kienzler, Kowalkowski & Kindström (2021), Study 2, p. 408; n = 145, scenario-based. Every participant saw the same 500-hour average; only the bounds varied. The contrast is tested across the whole sample: chi-squared(1, N = 145) = 9.51, p < .01; logistic B = 1.19, 95% CI 0.39 to 1.98.
Source and evidence
Each line names a claim related to this exhibit, its source, and how it was checked.
- A KKK21-C3 Only the bounds varied: "All participants saw the same past average monthly usage (500 h), but the minimum and maximum usage values were varied to create two conditions (100 and 600 h versus 400 and 900 h, respectively)", and "Participants in the equal condition (89%) were significantly more likely than chance to choose the flat rate when past usage indicated upper bound extremes", while "However, this was not the case (56%) when past usage information indicated lower bound extremes"Kienzler, Kowalkowski & Kindström (2021), Journal of Business Research 132, 403–415 · VoR held
- A KKK21-C4 The spread contrast holds across the whole sample of 145: χ²(1, N = 145) = 9.51, p < .01; logistic B = 1.19, 95% CI [0.39, 1.98]. In the authors' own words, with a premium "the flat rate’s choice share decreased, but it increased with upper bound extremes", and the estimate comes from "A binary logistic regression with two dummy- coded independent variables"Kienzler, Kowalkowski & Kindström (2021), Journal of Business Research 132, 403–415 · VoR held
Grades: A, verified against the printed page of the primary source · B, primary source, text layer only · C, authoritative secondary · D, reported.
From the essay
Pricing & revenue architecture
A flat rate buys your customer’s worst month.
Flat pricing for software rested on two conditions, and inference cost broke one. The buyers who most want a flat rate are the ones with the biggest tail.
Read the essayThis exhibit belongs to an essay: the numbers live here, the argument lives there.
Cite or embed
Related exhibits
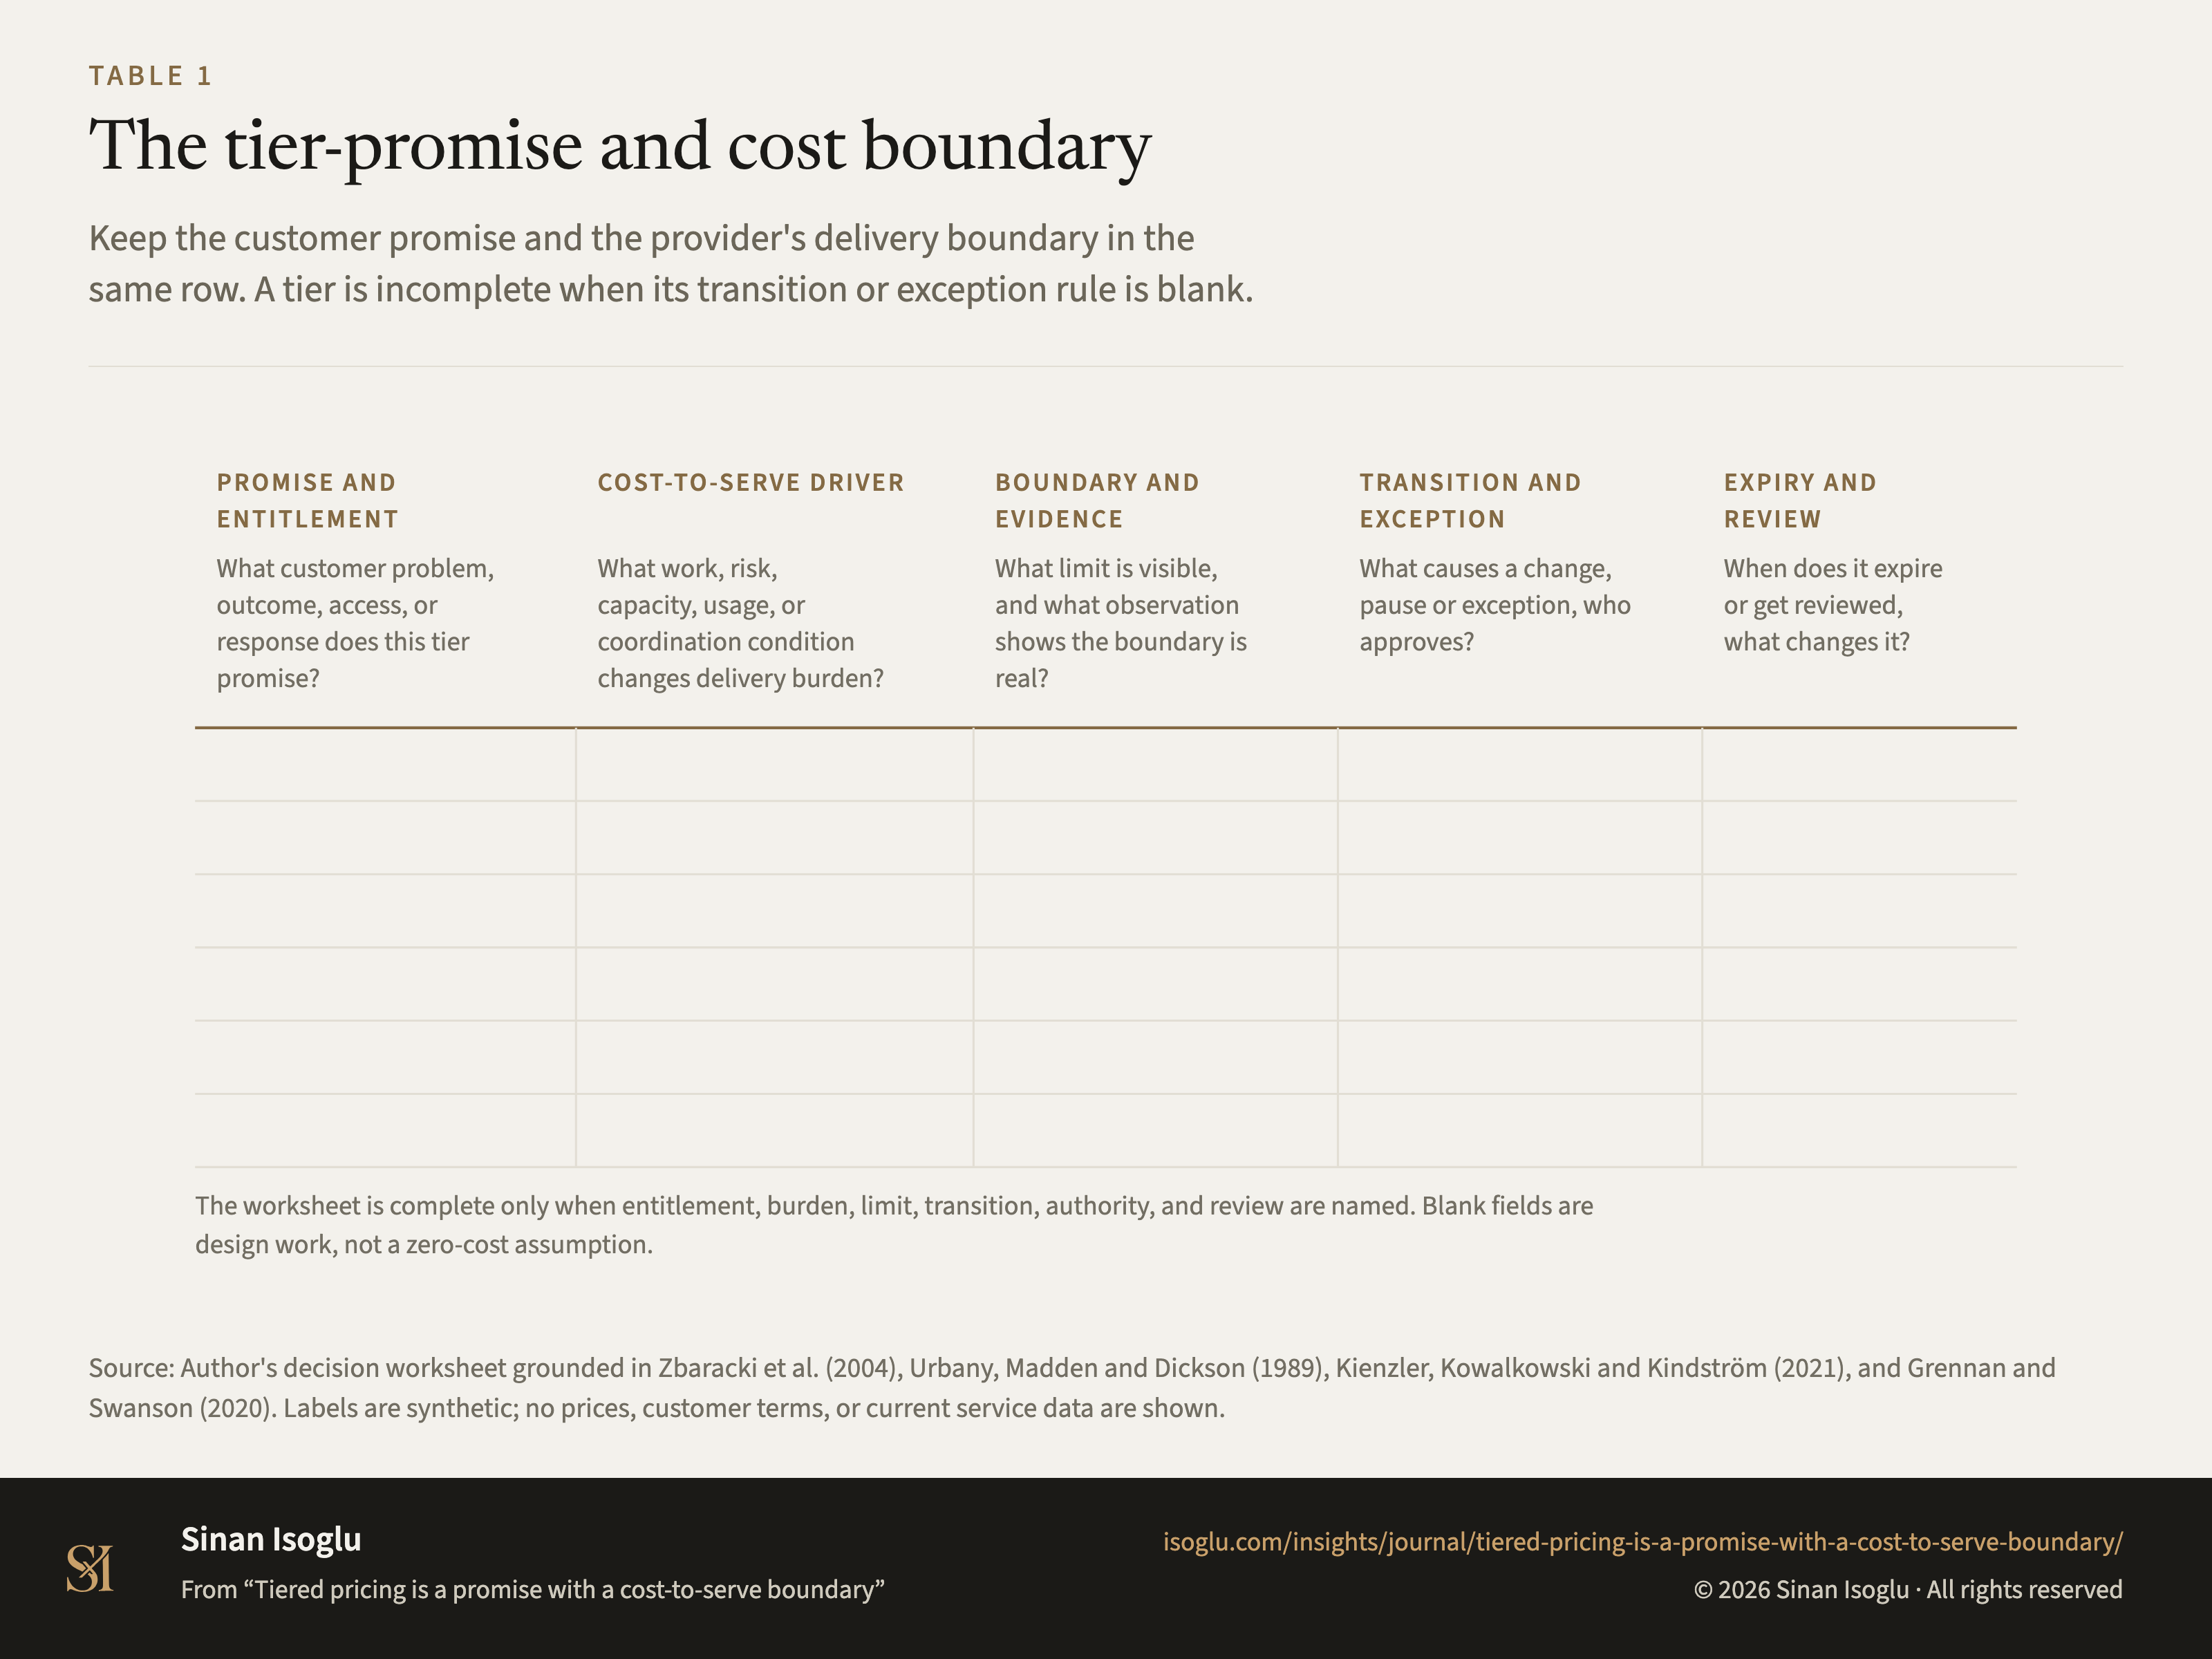
Table 1Table
The tier-promise and cost boundary
Tiered pricing is a promise with a cost-to-serve boundary
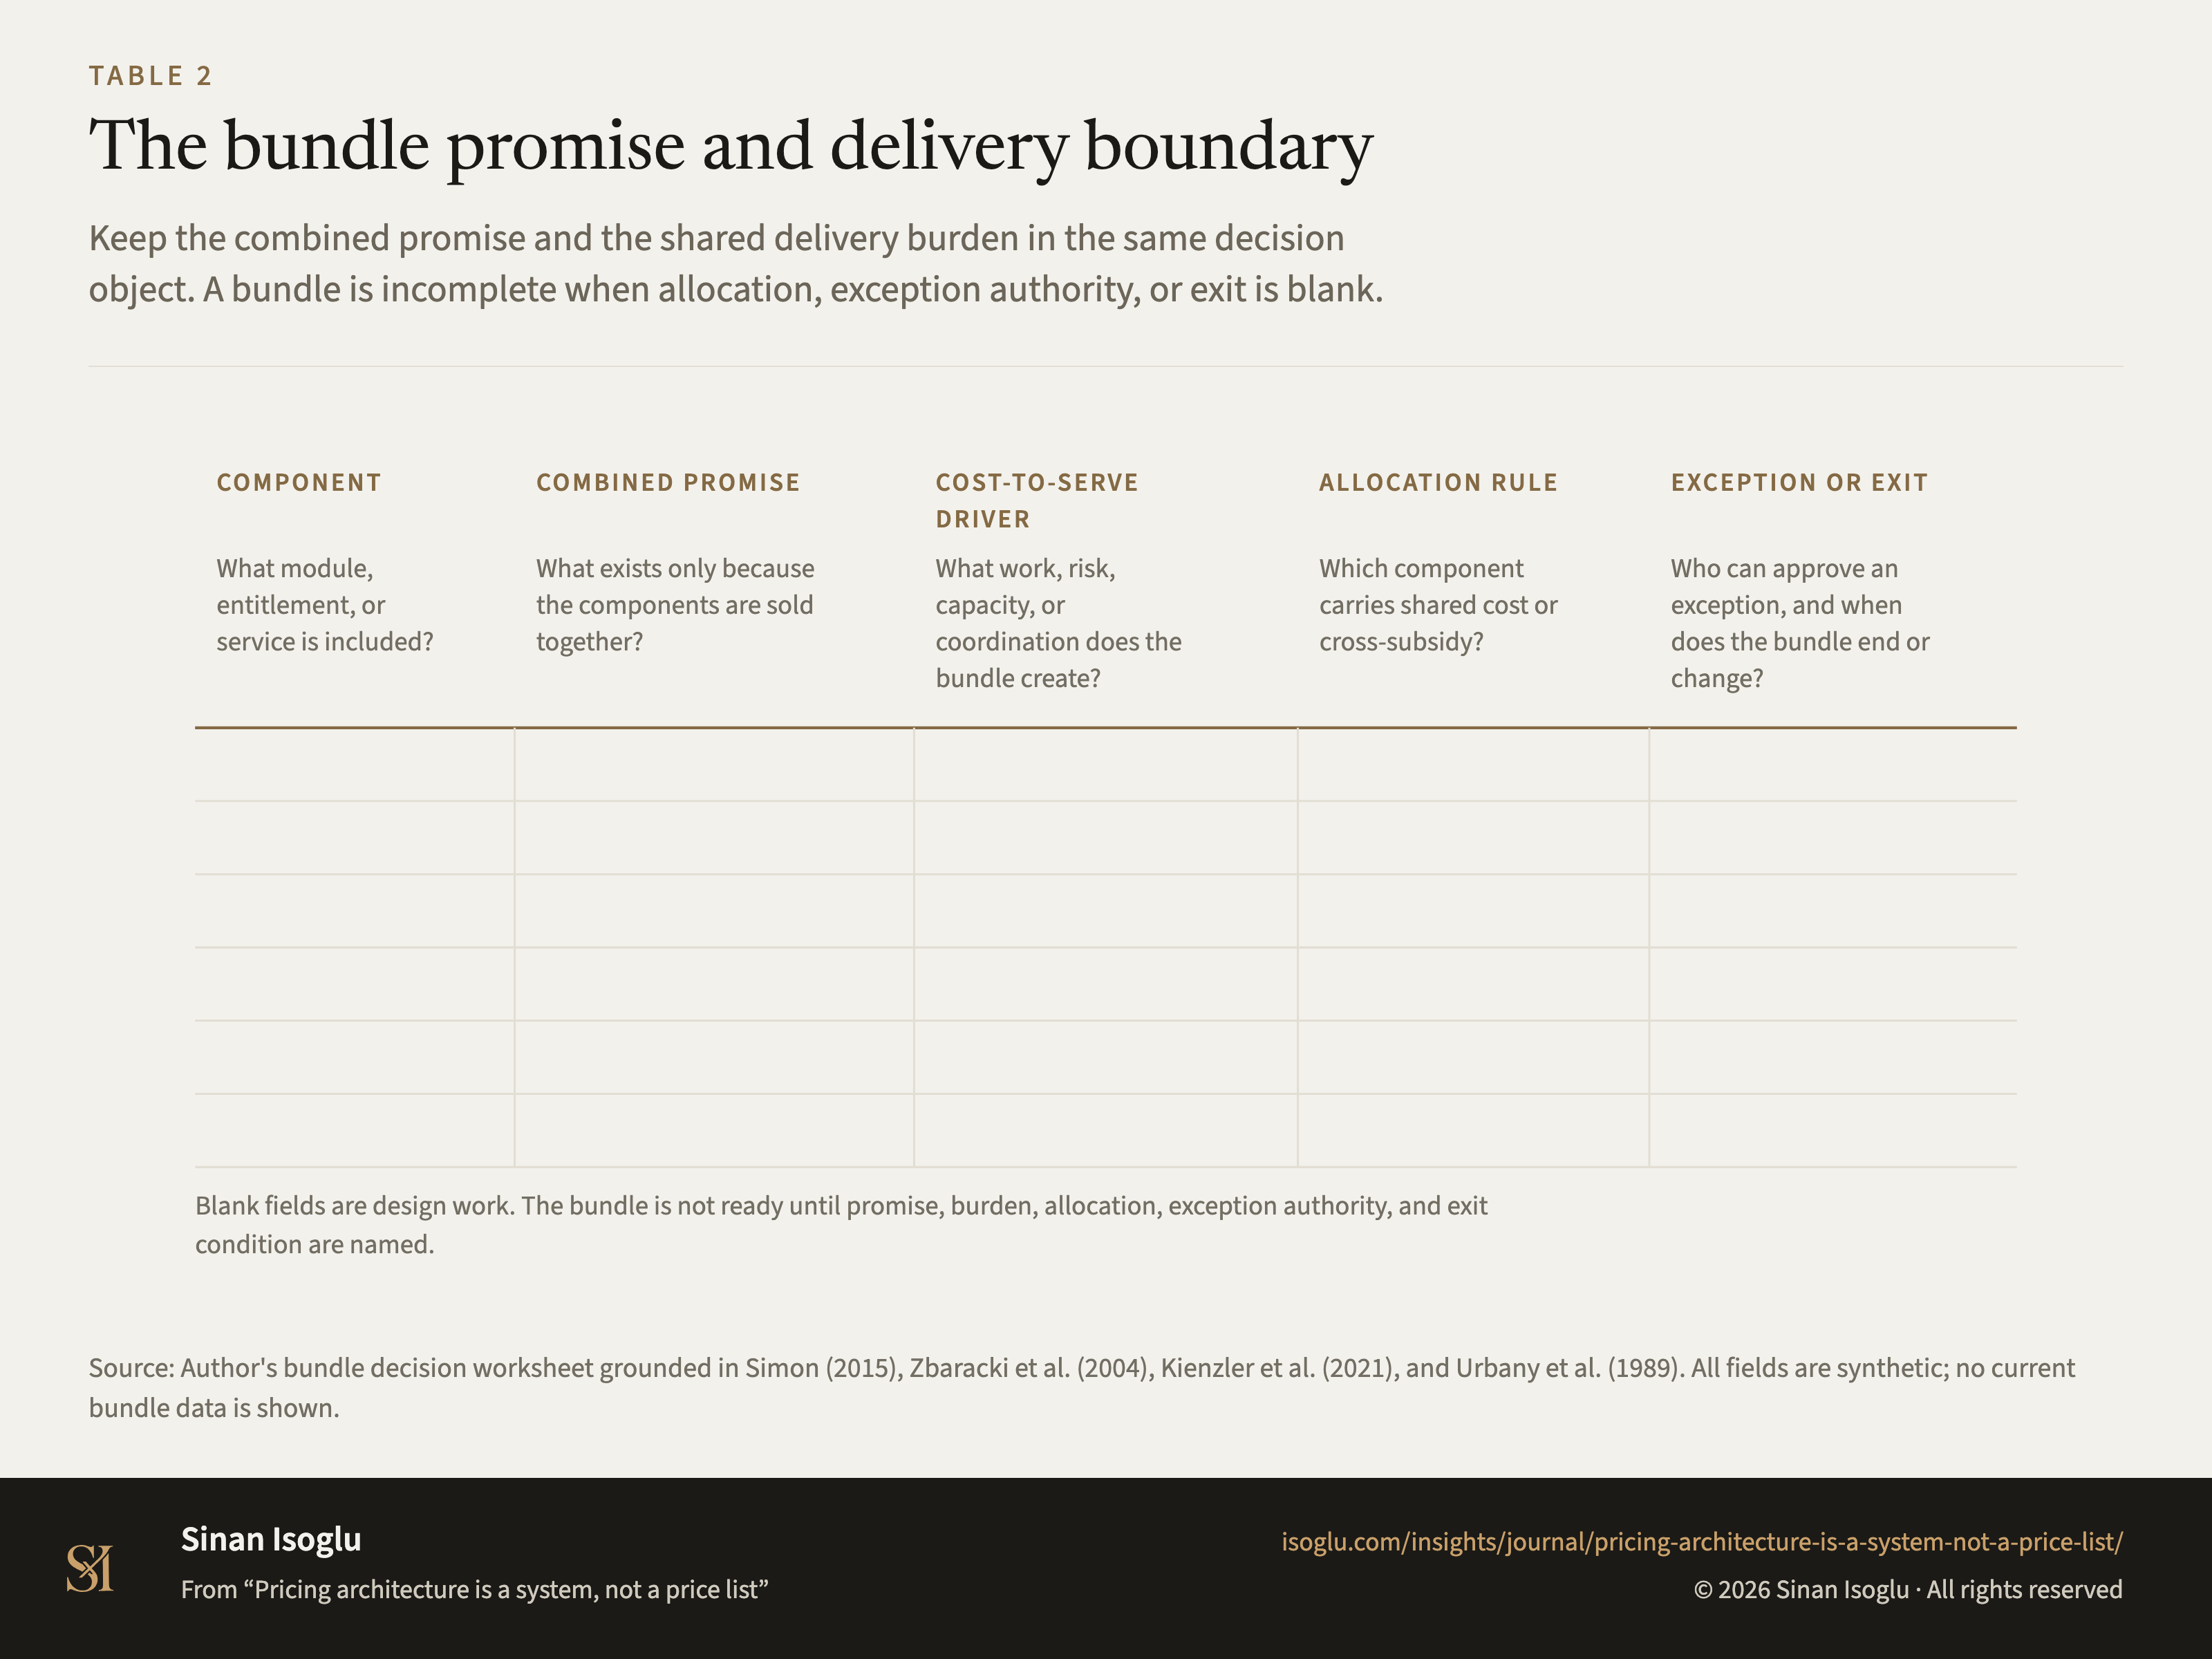
Table 2Table
The bundle promise and delivery boundary
Pricing architecture is a system, not a price list
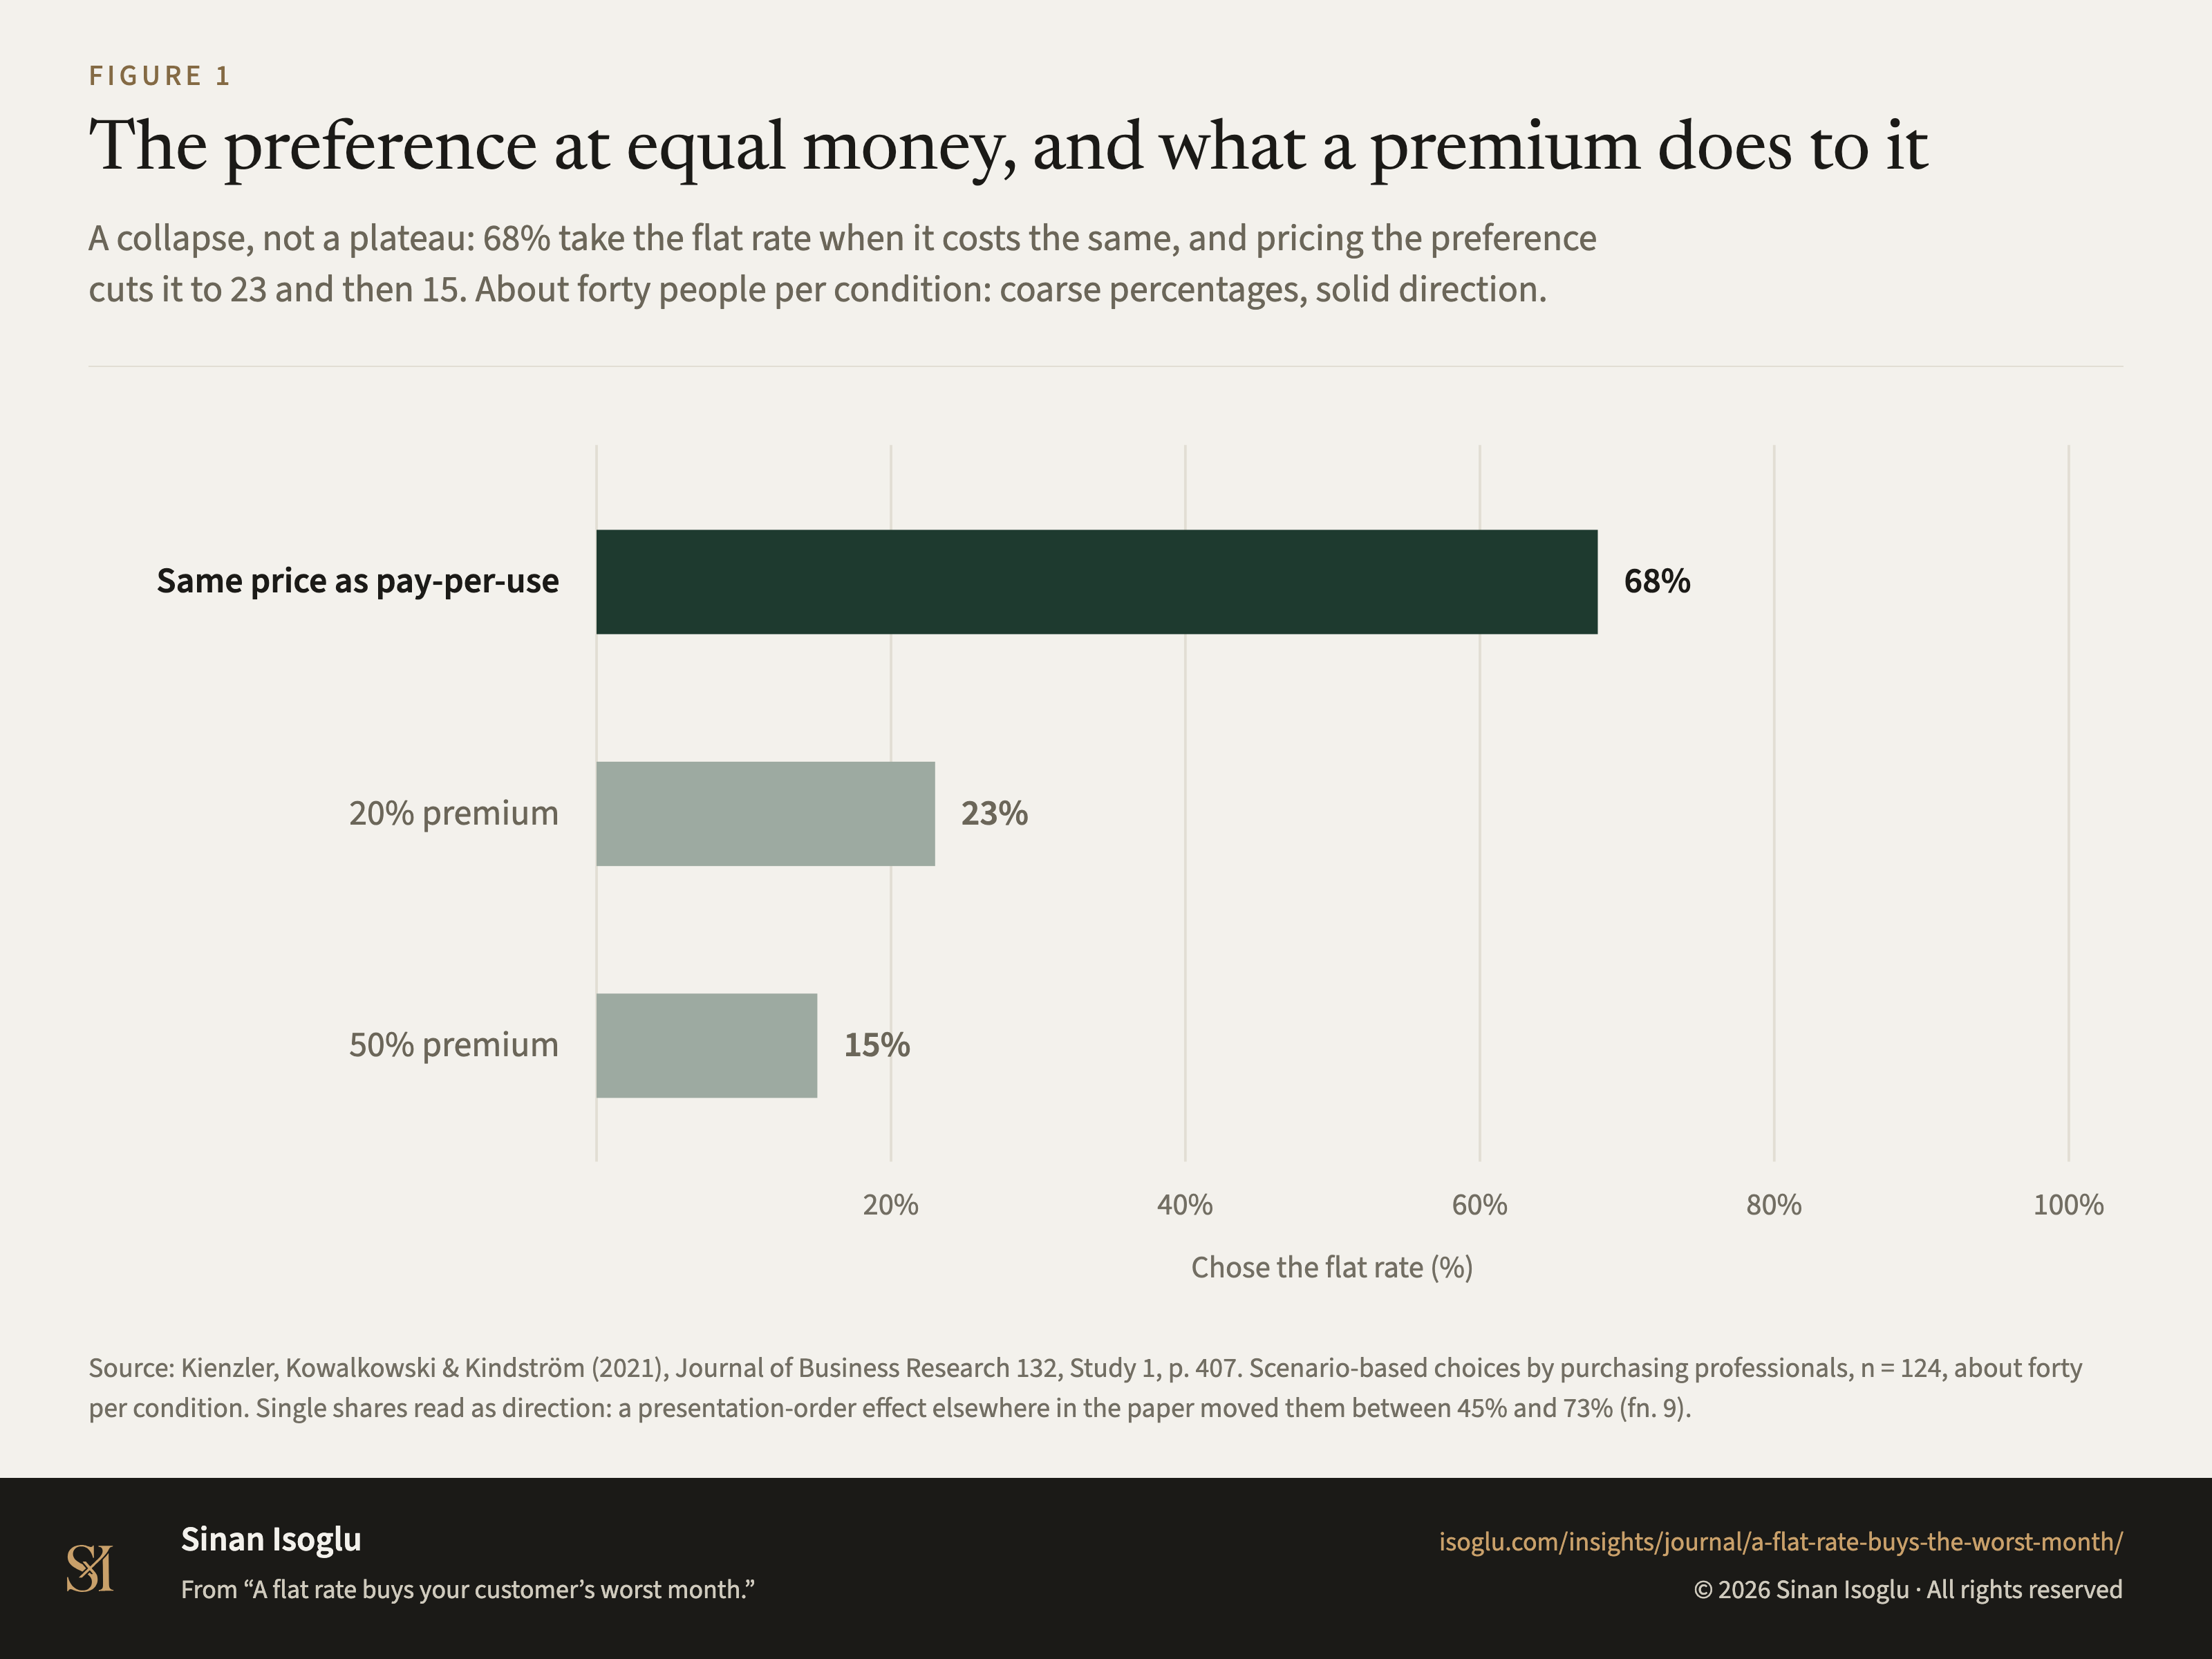
Figure 1Figure
The preference at equal money, and what a premium does to it
A flat rate buys your customer’s worst month.
Contact
Bring the question you're working on.
Research, a guest lecture, or a commercial question.