Figure 1From “What is sales capacity planning?”
The sales capacity planning architecture
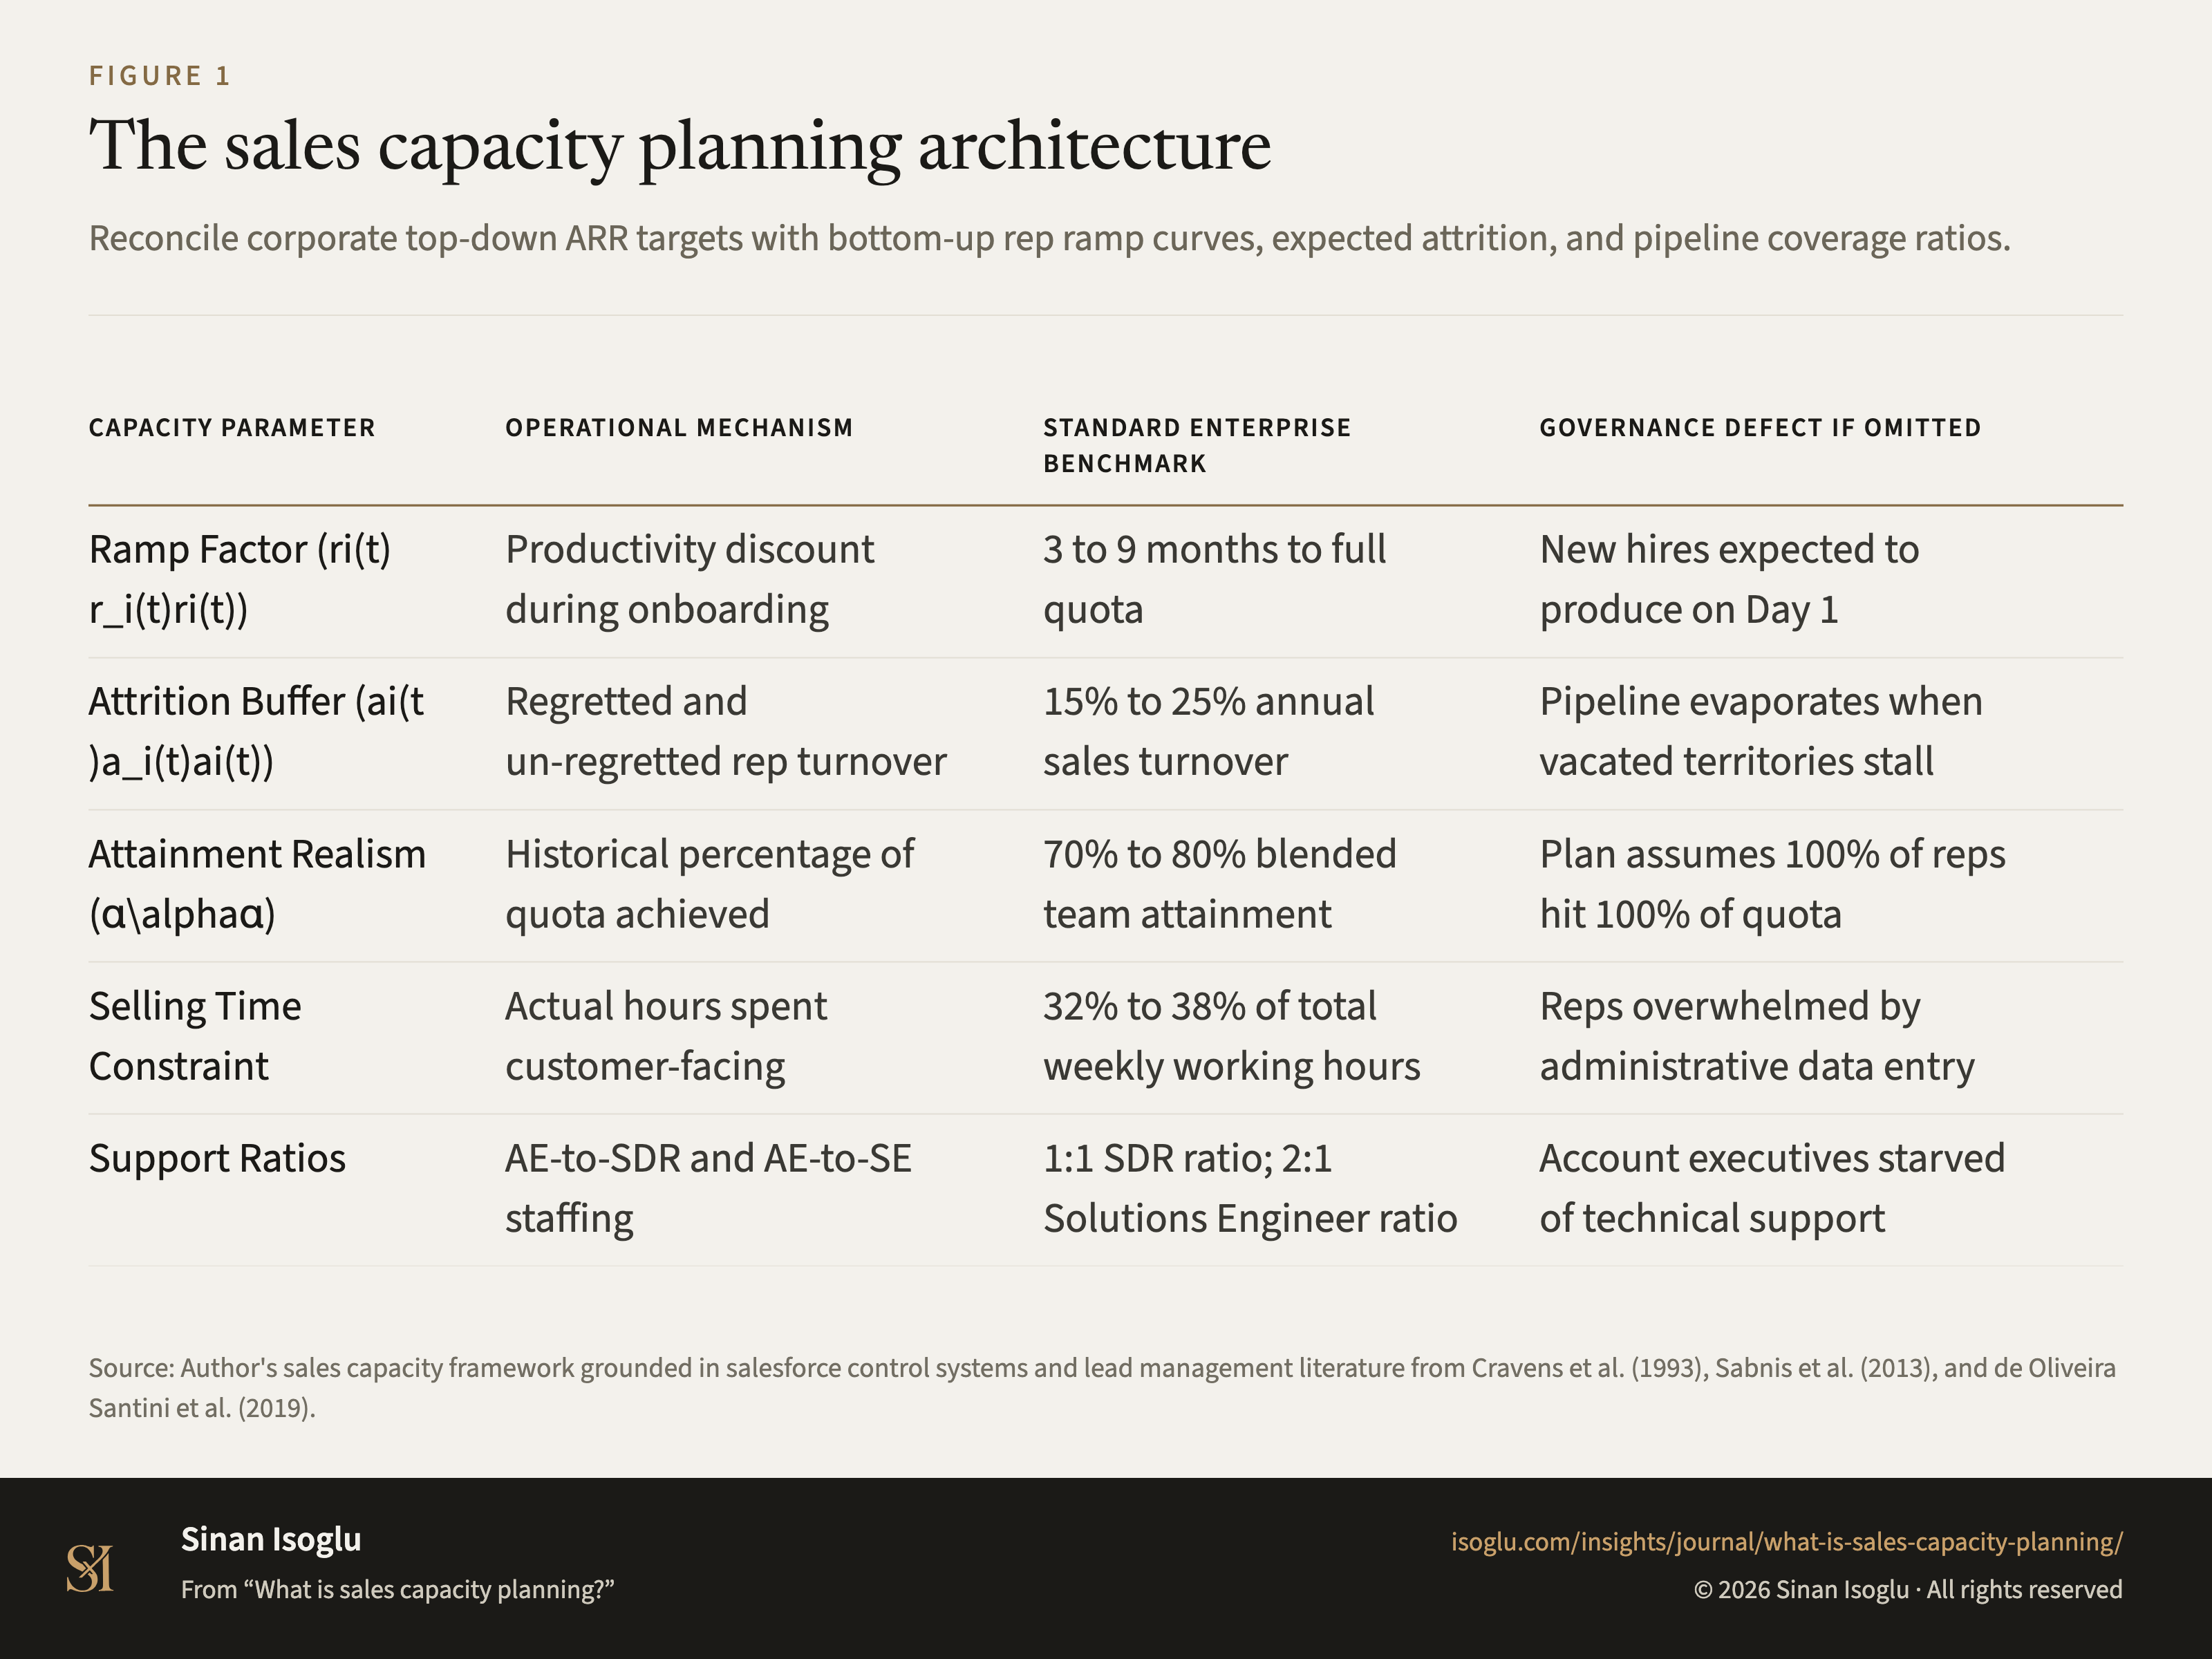
Reconcile corporate top-down ARR targets with bottom-up rep ramp curves, expected attrition, and pipeline coverage ratios.
Figure 1The sales capacity planning architecture
| Capacity Parameter | Operational Mechanism | Standard Enterprise Benchmark | Governance Defect if Omitted |
|---|---|---|---|
| Ramp Factor ($r_i(t)$) | Productivity discount during onboarding | 3 to 9 months to full quota | New hires expected to produce on Day 1 |
| Attrition Buffer ($a_i(t)$) | Regretted and un-regretted rep turnover | 15% to 25% annual sales turnover | Pipeline evaporates when vacated territories stall |
| Attainment Realism ($\alpha$) | Historical percentage of quota achieved | 70% to 80% blended team attainment | Plan assumes 100% of reps hit 100% of quota |
| Selling Time Constraint | Actual hours spent customer-facing | 32% to 38% of total weekly working hours | Reps overwhelmed by administrative data entry |
| Support Ratios | AE-to-SDR and AE-to-SE staffing | 1:1 SDR ratio; 2:1 Solutions Engineer ratio | Account executives starved of technical support |
Swipe or scroll horizontally if the table is wider than your screen.
Source: Author's sales capacity framework grounded in salesforce control systems and lead management literature from Cravens et al. (1993), Sabnis et al. (2013), and de Oliveira Santini et al. (2019).
From the essay
Revenue operations & AI
What is sales capacity planning?
Sales capacity planning models bottom-up commercial productivity. Align rep ramp time, attrition, selling hours, and quota capacity to realistic revenue.
Read the essayThis exhibit belongs to an essay: the numbers live here, the argument lives there.
Cite or embed
Related exhibits
Contact
Bring the question you're working on.
Research, a guest lecture, or a commercial question.