Figure 1From “What is RFM analysis?”
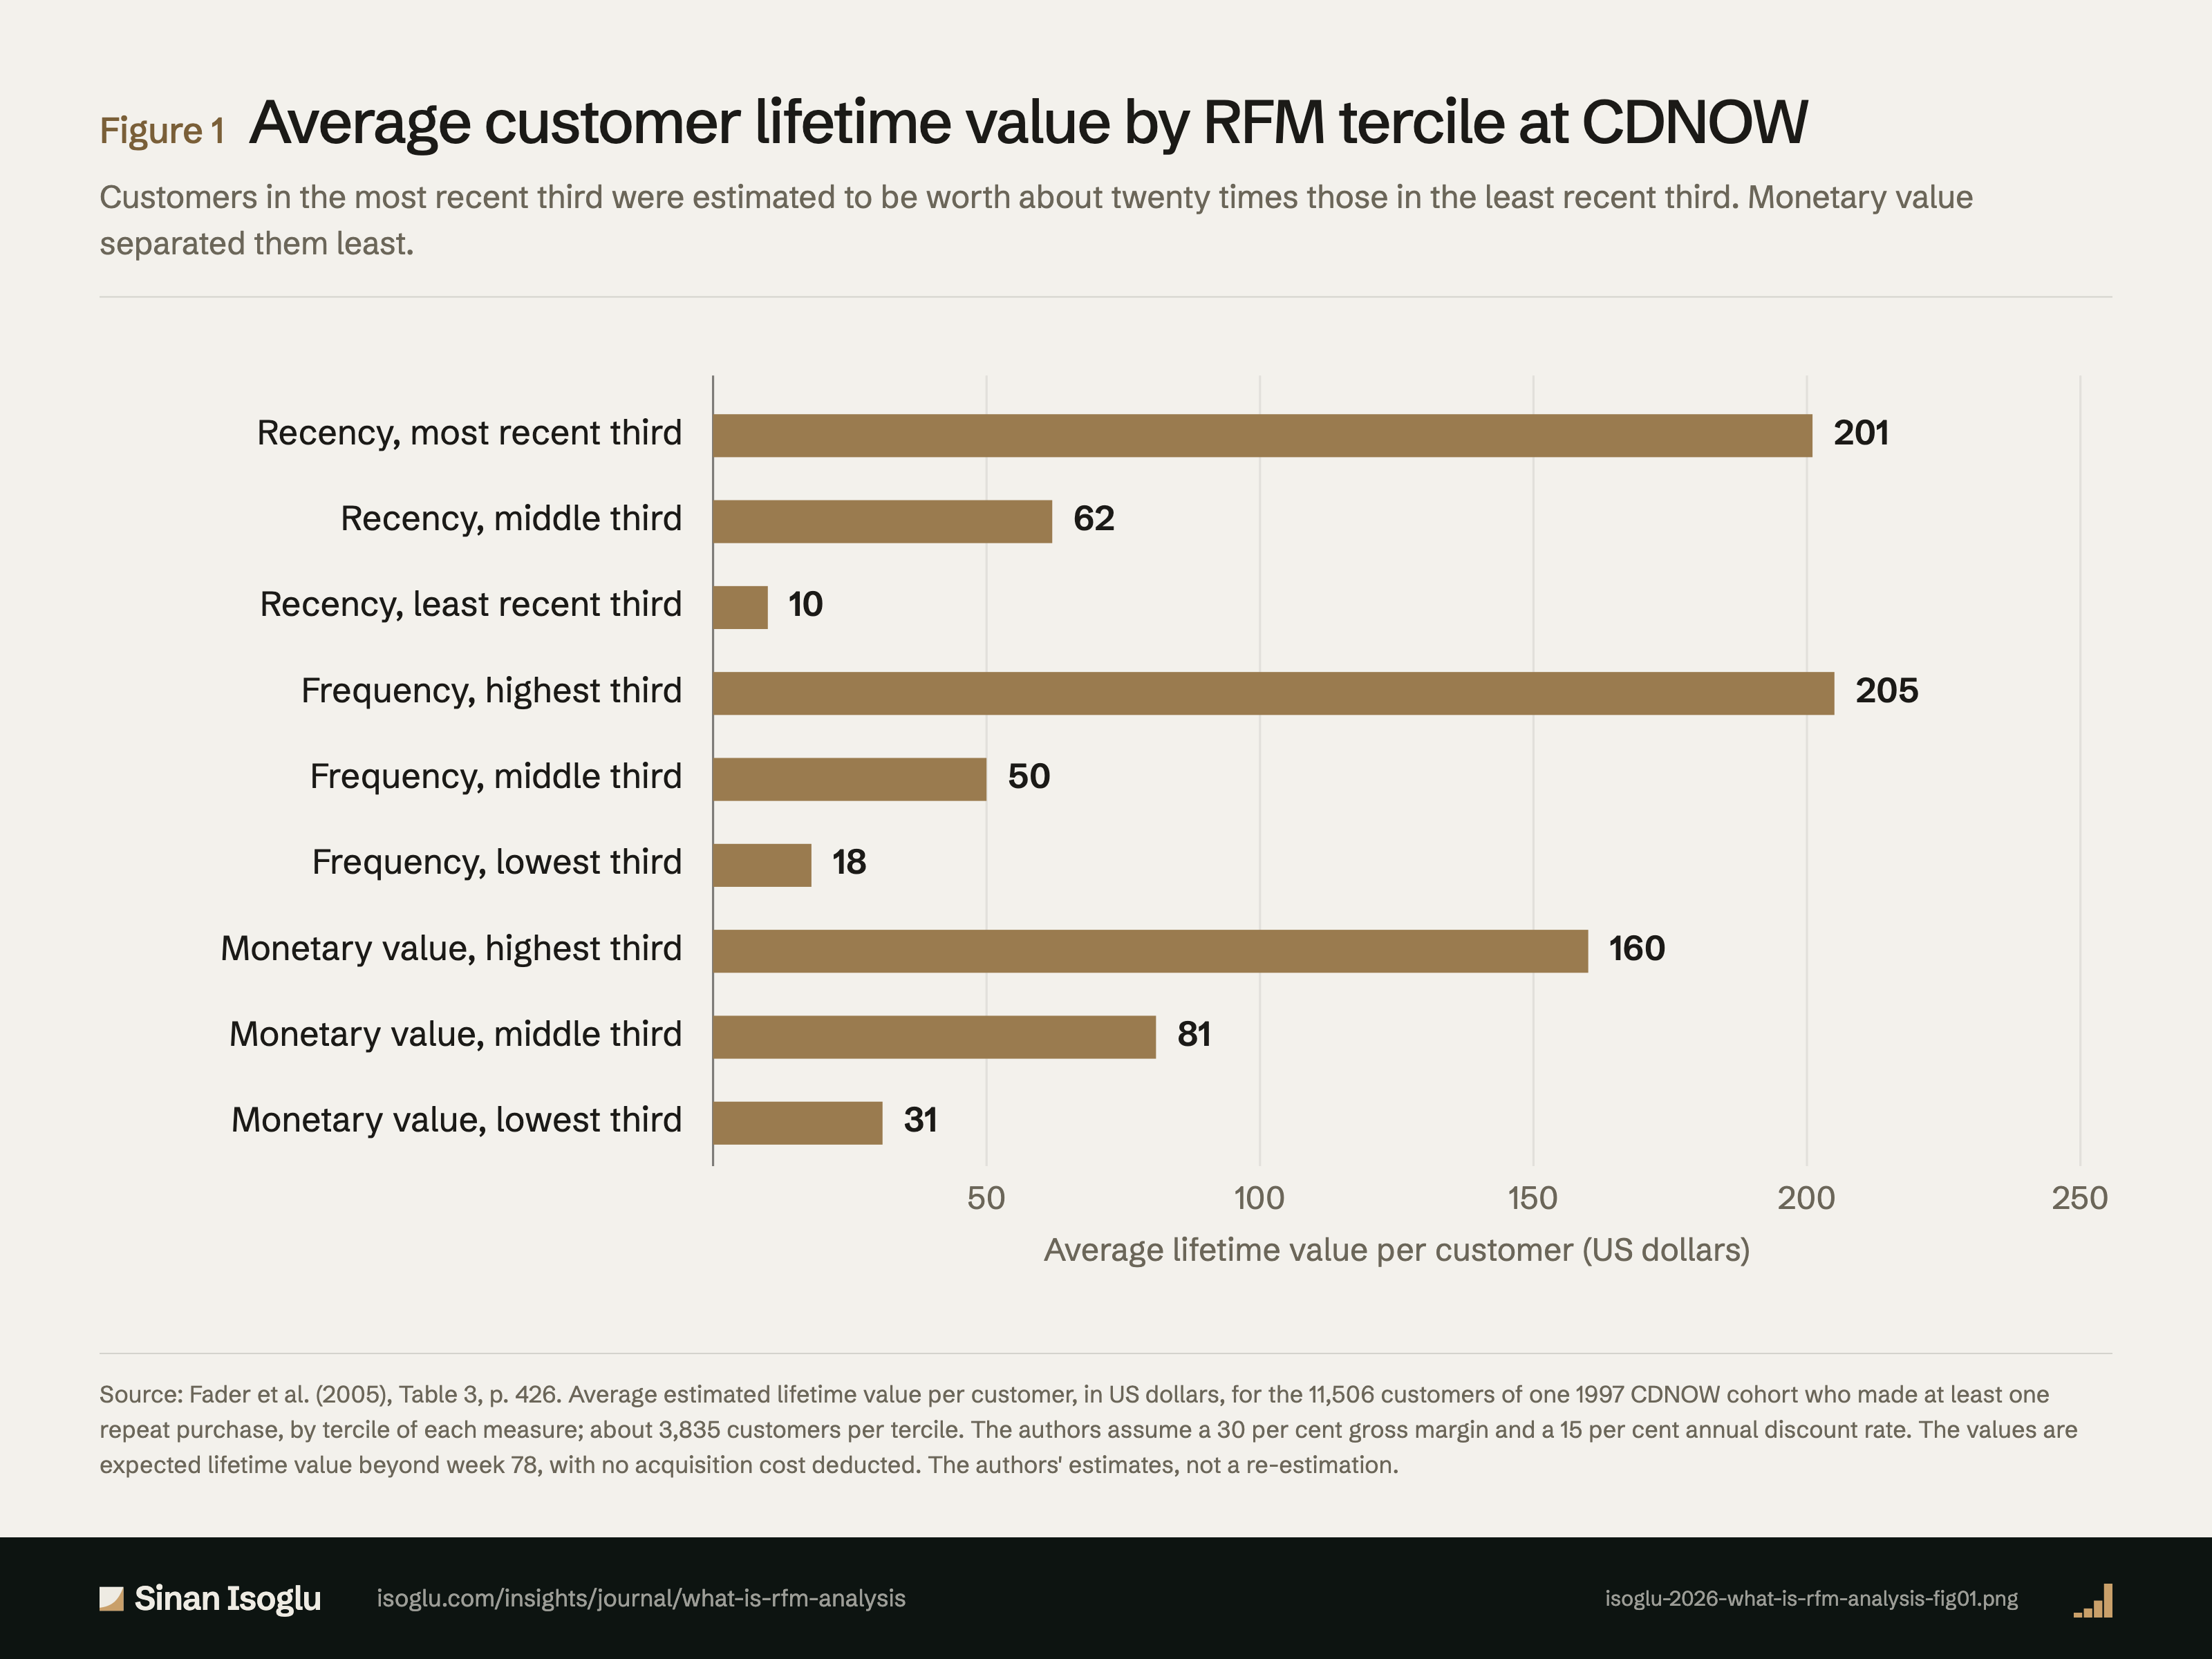
Average customer lifetime value by RFM tercile at CDNOW
Customers in the most recent third were estimated to be worth about twenty times those in the least recent third. Monetary value separated them least.
Figure 1Average customer lifetime value by RFM tercile at CDNOW
Source: Fader et al. (2005), Table 3, p. 426. Average estimated lifetime value per customer, in US dollars, for the 11,506 customers of one 1997 CDNOW cohort who made at least one repeat purchase, by tercile of each measure; about 3,835 customers per tercile. The authors assume a 30 per cent gross margin and a 15 per cent annual discount rate. The values are expected lifetime value beyond week 78, with no acquisition cost deducted. The authors' estimates, not a re-estimation.
Source and evidence
Each line names a claim related to this exhibit, its source, and how it was checked.
- A FHL05-C3 Table 3: average CLV by tercile is $10, $62, $201 for recency, $18, $50, $205 for frequency and $31, $81, $160 for monetary value (about 3,835 customers per tercile); CLV varies most by recency and least by monetary value, consistent with the view that recency discriminates best; values assume a 30% margin and a 15% discount rate (pp. 423, 426): "We note that the greatest variability in CLV is on the recency dimension, followed closely by the frequency dimension. The least variation is on the monetary value dimension."; "This is consistent with the widely held view that recency is usually a more powerful discriminator than frequency or monetary value"; "Given an assumed annual discount rate of 15%"; "gross contribution margin of 30%"Fader, Hardie & Lee. (2005)
- A FHL05-C4 The top cell averages $435 per customer, about 38% of the cohort's future value; average CLV is about $47; the zero cell, light buyers with no repeat purchase, holds about 5% of future value, more than most of the 27 other cells, so a thorough analysis must consider the zero class; the values are expected lifetime value beyond week 78 with no acquisition cost deducted (pp. 425, 426): "it shows an average net present value of $435 per customer"; "This represents approximately 38% of the future value of the entire cohort"; "the average CLV is approximately $47 per customer"; "Perhaps the most striking observation is the significant contribution of the"; "A thorough analysis of the customer base requires careful consideration of the zero class"; "an average expected lifetime value of $4.40 beyond Week 78"; "these very light buyers collectively constitute approximately 5% of the total future value of the entire cohort, which is greater than most of the 27 other RFM cells"Fader, Hardie & Lee. (2005)
Grades: A, verified against the printed page of the primary source · B, primary source, text layer only · C, authoritative secondary · D, reported.
From the essay
Growth that compounds
What is RFM analysis?
RFM analysis ranks customers by how recently and how often they bought and what they spent per purchase. It describes the past; forecasts need a model.
Read the essayThis exhibit belongs to an essay: the numbers live here, the argument lives there.
Cite or embed
Related exhibits
Contact
Bring the question you're working on.
Research, a guest lecture, or a commercial question.