Figure 1From “What is customer win-back?”
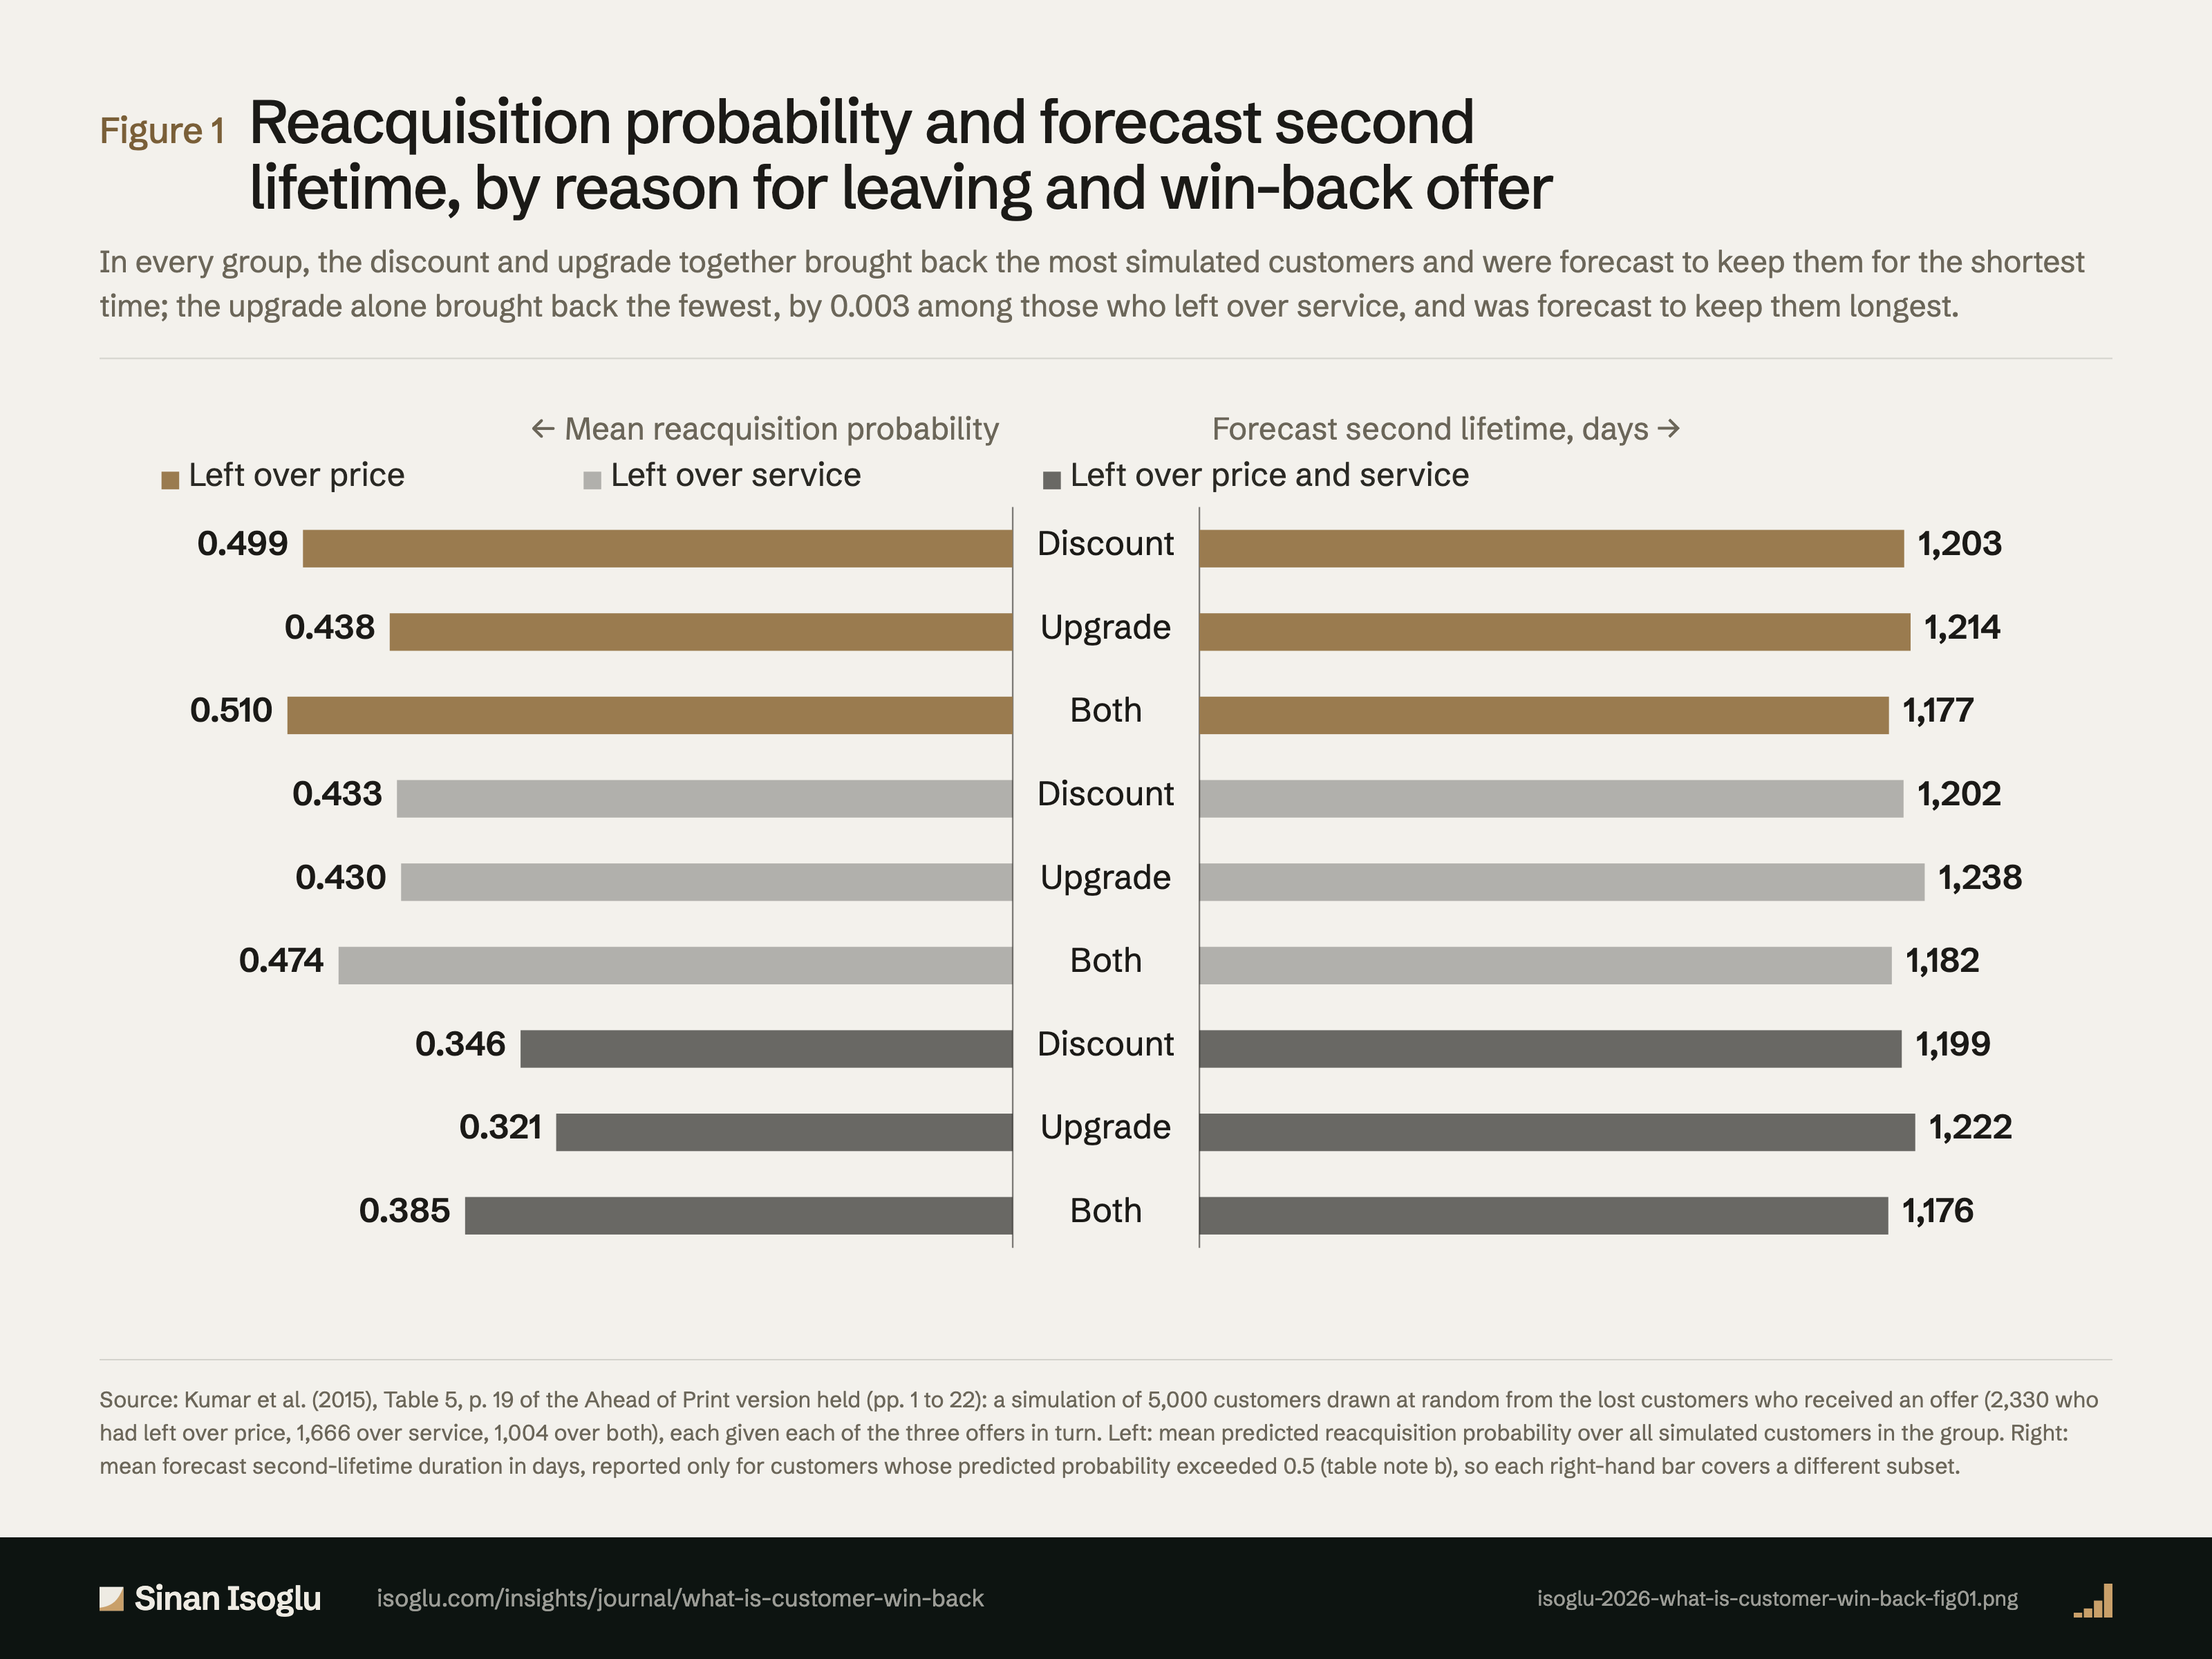
Reacquisition probability and forecast second lifetime, by reason for leaving and win-back offer
In every group, the discount and upgrade together brought back the most simulated customers and were forecast to keep them for the shortest time; the upgrade alone brought back the fewest, by 0.003 among those who left over service, and was forecast to keep them longest.
Figure 1Reacquisition probability and forecast second lifetime, by reason for leaving and win-back offer
Source: Kumar et al. (2015), Table 5, p. 19 of the Ahead of Print version held (pp. 1 to 22): a simulation of 5,000 customers drawn at random from the lost customers who received an offer (2,330 who had left over price, 1,666 over service, 1,004 over both), each given each of the three offers in turn. Left: mean predicted reacquisition probability over all simulated customers in the group. Right: mean forecast second-lifetime duration in days, reported only for customers whose predicted probability exceeded 0.5 (table note b), so each right-hand bar covers a different subset.
Source and evidence
Each line names a claim related to this exhibit, its source, and how it was checked.
- A KBZ15-C5 Simulation of 5,000 customers drawn from the pre-reacquisition sample (2,330 price, 1,666 service, 1,004 both), each under each of three offers (Table 5, p. 19): mean reacquisition probability for discount, upgrade, both: price leavers .499, .438, .510; service leavers .433, .430, .474; both-reason leavers .346, .321, .385; mean forecast second-lifetime duration in days, for customers with predicted probability above .5 only: 1,203, 1,214, 1,177; 1,202, 1,238, 1,182; 1,199, 1,222, 1,176; the bundle reacquires most regardless of reason; for the price group the bundle's shorter duration is tested (t-tests) and a similar conclusion drawn for the others; expected second-lifetime profitability, defined as the product of probability, duration in months and monthly profit, is highest under the price offer for price leavers and under the bundle for the other groups; caution because offer depth did not vary (Ahead of Print version, pp. 18 to 20): "drawing 5,000 customers from the pre-reacquisition"; "Simulation Results"; "The mean forecast of second-lifetime duration and profitability/month is reported only for those whose predicted reacquisition probability is"; "offer is the most successful, regardless of the reason for"; "are reacquired with a price offer (M = 1,203"; "We draw a similar conclusion for other"; "price-related reasons, a price win-back offer yields the"; "highest expected second-lifetime profitability compared"; "the expected second-lifetime profitability as a product of reacquisition probability, second-lifetime duration (in months)"; "In addition, one should be cautious interpreting the"; "without varying the depth of the"Kumar, Bhagwat & Zhang (2015) · Kumar, Bhagwat & Zhang. (2015)
- B WINB-OWN-C5 Kumar et al.'s own descriptive shares imply raw return rates by offer type that order the offers differently from their model: return rate = share among the 14,384 reacquired × 14,384 ÷ (share among the 53,729 targeted × 53,729), so discount .42 × 14,384 ÷ (.37 × 53,729) = 30.4% (29.6 to 31.2 within the rounding of the printed shares), upgrade .36 × 14,384 ÷ (.38 × 53,729) = 25.4% (24.7 to 26.1), both .22 × 14,384 ÷ (.25 × 53,729) = 23.6% (22.6 to 24.6), overall 26.8%, the article's 27%; the combined offer's bounds lie below the other two, while the jointly estimated model puts it first and the upgrade last (Table 3, p. 13, and Table 4, p. 16, both read from page images; p. 17); with the type of offer randomly assigned and stated to be unrelated to the reason for leaving, the raw shares are themselves a fair comparison; the article does not reconcile the two, so the page reports the ranking as the authors' estimate and does not say which is right (a table error, a different estimation sample or an assignment less balanced than described would each explain it). Added after G5 F1.Author check of KBZ15-C2 and KBZ15-C3
Grades: A, verified against the printed page of the primary source · B, primary source, text layer only · C, authoritative secondary · D, reported.
From the essay
Growth that compounds
What is customer win-back?
Customer win-back means reacquiring customers who have left. Its worth lies in the second lifetime: who comes back, on which offer, and for how long.
Read the essayThis exhibit belongs to an essay: the numbers live here, the argument lives there.
Cite or embed
Contact
Bring the question you're working on.
Research, a guest lecture, or a commercial question.