Abbildung 1Aus „Was ist eine RFM-Analyse?“
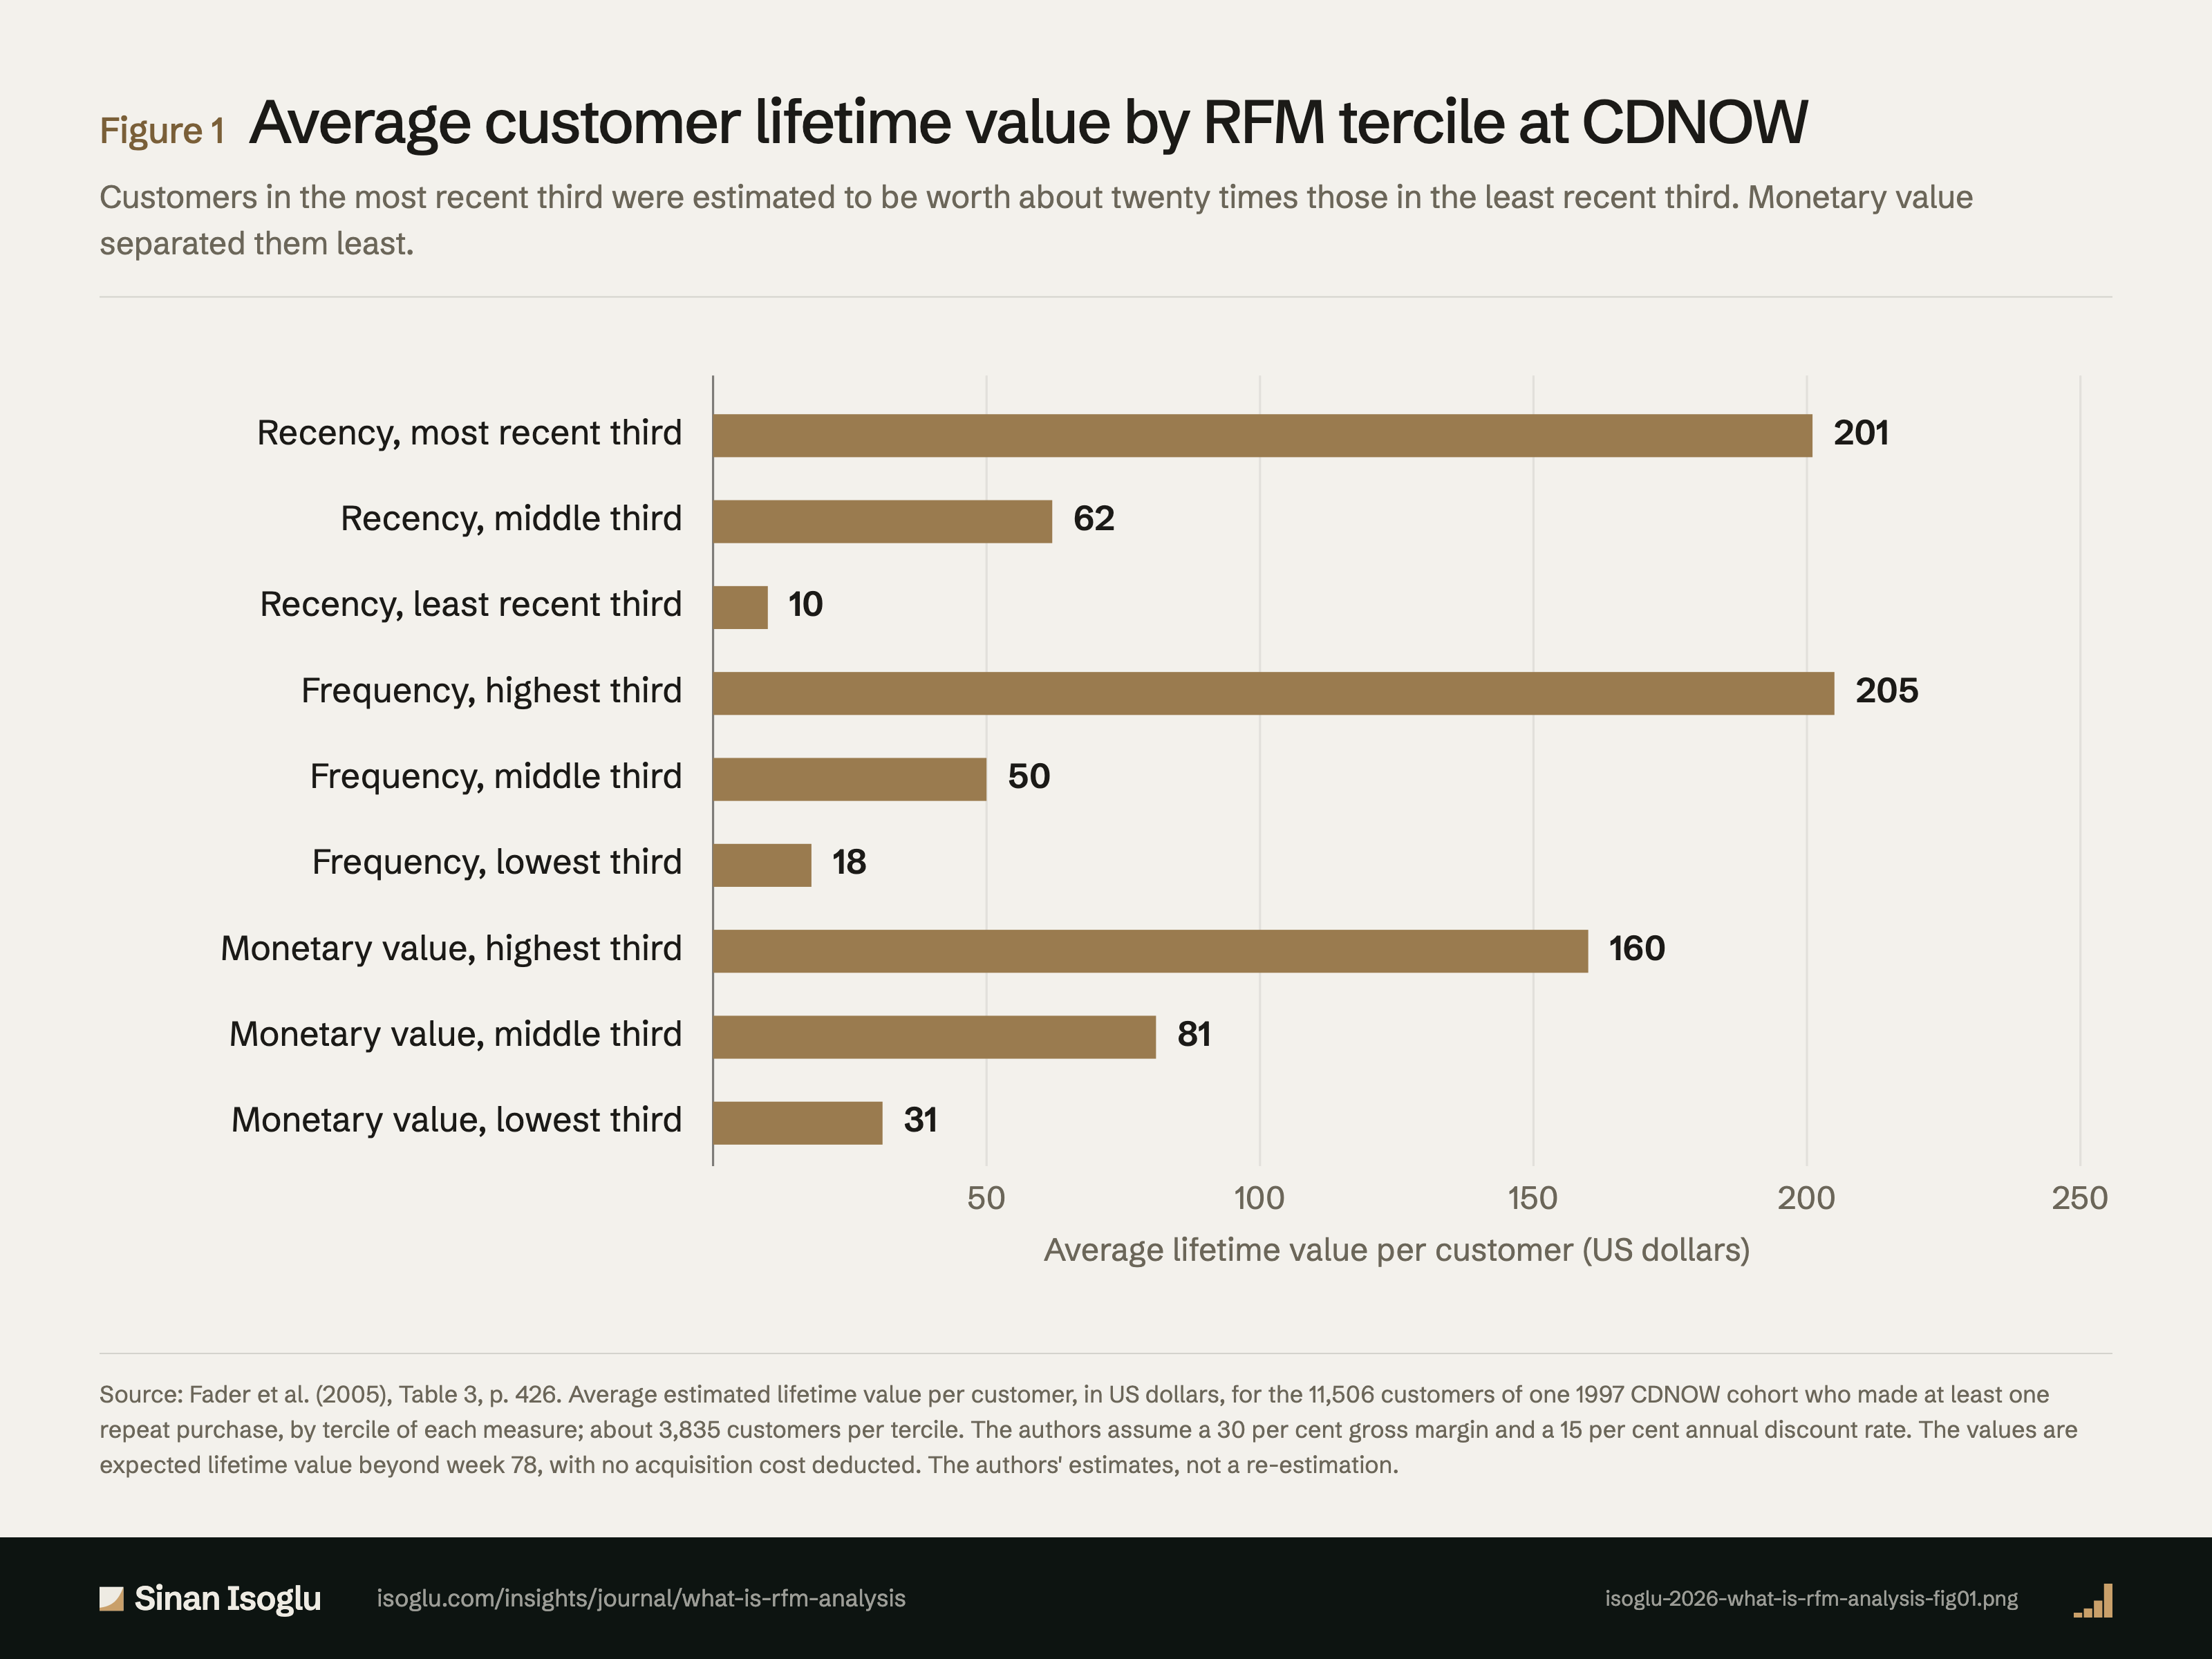
Durchschnittlicher Customer Lifetime Value je RFM-Drittel bei CDNOW
Kunden im aktuellsten Drittel waren nach der Schätzung rund zwanzigmal so viel wert wie die im am längsten zurückliegenden. Der Monetary Value trennte sie am wenigsten.
Abbildung 1Durchschnittlicher Customer Lifetime Value je RFM-Drittel bei CDNOW
Quelle: Fader et al. (2005), Tabelle 3, S. 426. Durchschnittlicher geschätzter Lifetime Value je Kunde in US-Dollar für die 11.506 Kunden einer CDNOW-Kohorte von 1997 mit mindestens einem Wiederholungskauf, je Drittel jeder Größe; rund 3.835 Kunden je Drittel. Die Autoren unterstellen eine Bruttomarge von 30 Prozent und einen Jahresdiskontsatz von 15 Prozent. Die Werte sind der erwartete Lifetime Value nach Woche 78, ohne Abzug von Akquisitionskosten. Schätzungen der Autoren, keine Neuberechnung.
Quelle und Evidenz
Jede Zeile nennt eine Aussage zu dieser Abbildung, ihre Quelle und die Art ihrer Prüfung.
- A FHL05-C3 Table 3: average CLV by tercile is $10, $62, $201 for recency, $18, $50, $205 for frequency and $31, $81, $160 for monetary value (about 3,835 customers per tercile); CLV varies most by recency and least by monetary value, consistent with the view that recency discriminates best; values assume a 30% margin and a 15% discount rate (pp. 423, 426): "We note that the greatest variability in CLV is on the recency dimension, followed closely by the frequency dimension. The least variation is on the monetary value dimension."; "This is consistent with the widely held view that recency is usually a more powerful discriminator than frequency or monetary value"; "Given an assumed annual discount rate of 15%"; "gross contribution margin of 30%"Fader, Hardie & Lee. (2005)
- A FHL05-C4 The top cell averages $435 per customer, about 38% of the cohort's future value; average CLV is about $47; the zero cell, light buyers with no repeat purchase, holds about 5% of future value, more than most of the 27 other cells, so a thorough analysis must consider the zero class; the values are expected lifetime value beyond week 78 with no acquisition cost deducted (pp. 425, 426): "it shows an average net present value of $435 per customer"; "This represents approximately 38% of the future value of the entire cohort"; "the average CLV is approximately $47 per customer"; "Perhaps the most striking observation is the significant contribution of the"; "A thorough analysis of the customer base requires careful consideration of the zero class"; "an average expected lifetime value of $4.40 beyond Week 78"; "these very light buyers collectively constitute approximately 5% of the total future value of the entire cohort, which is greater than most of the 27 other RFM cells"Fader, Hardie & Lee. (2005)
Prüfgrade: A, gegen die gedruckte Seite der Primärquelle geprüft · B, Primärquelle, nur Textebene · C, belastbare Sekundärquelle · D, berichtet.
Aus dem Beitrag
Wachstum, das sich potenziert
Was ist eine RFM-Analyse?
Eine RFM-Analyse ordnet Kunden nach letztem Kauf, Kaufhäufigkeit und Betrag je Kauf. Sie beschreibt die Vergangenheit; Prognosen brauchen ein Modell.
Den Beitrag lesenDiese Abbildung gehört zu einem Essay: Die Zahlen stehen hier, das Argument dort.
Zitieren oder einbetten
Verwandte Abbildungen
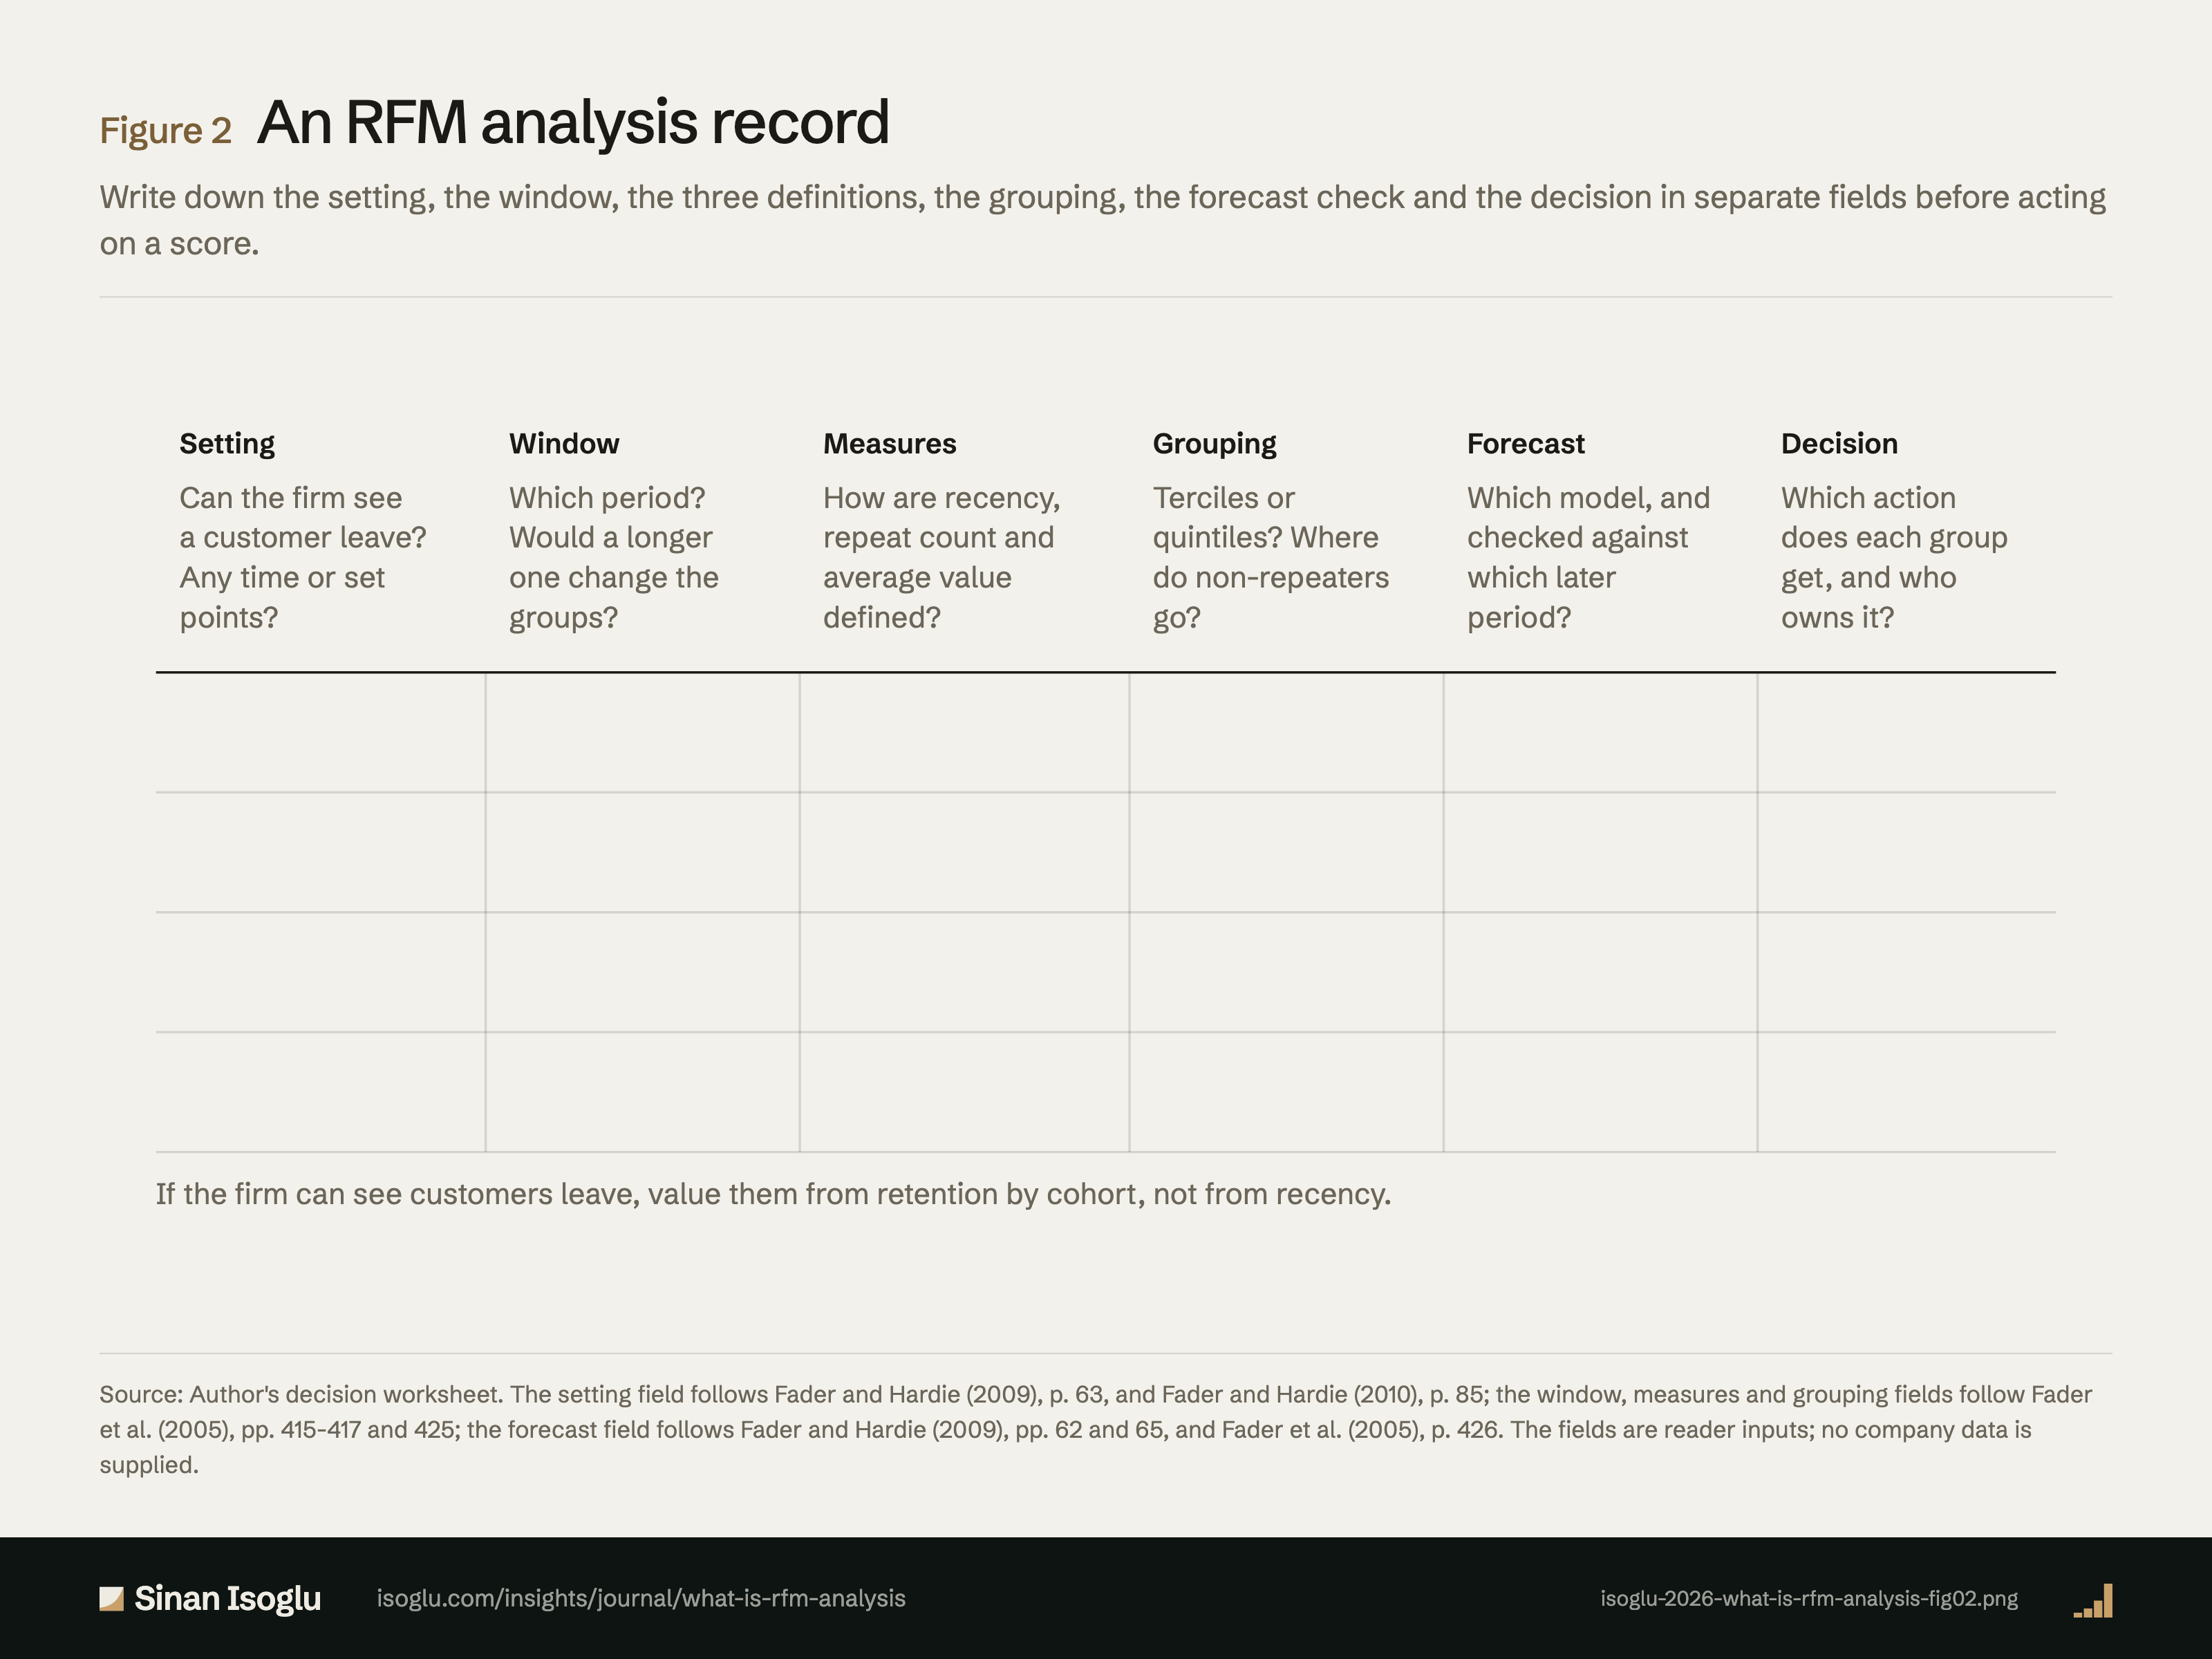
Abbildung 2Grafik
Ein Blatt für eine RFM-Analyse
Was ist eine RFM-Analyse?
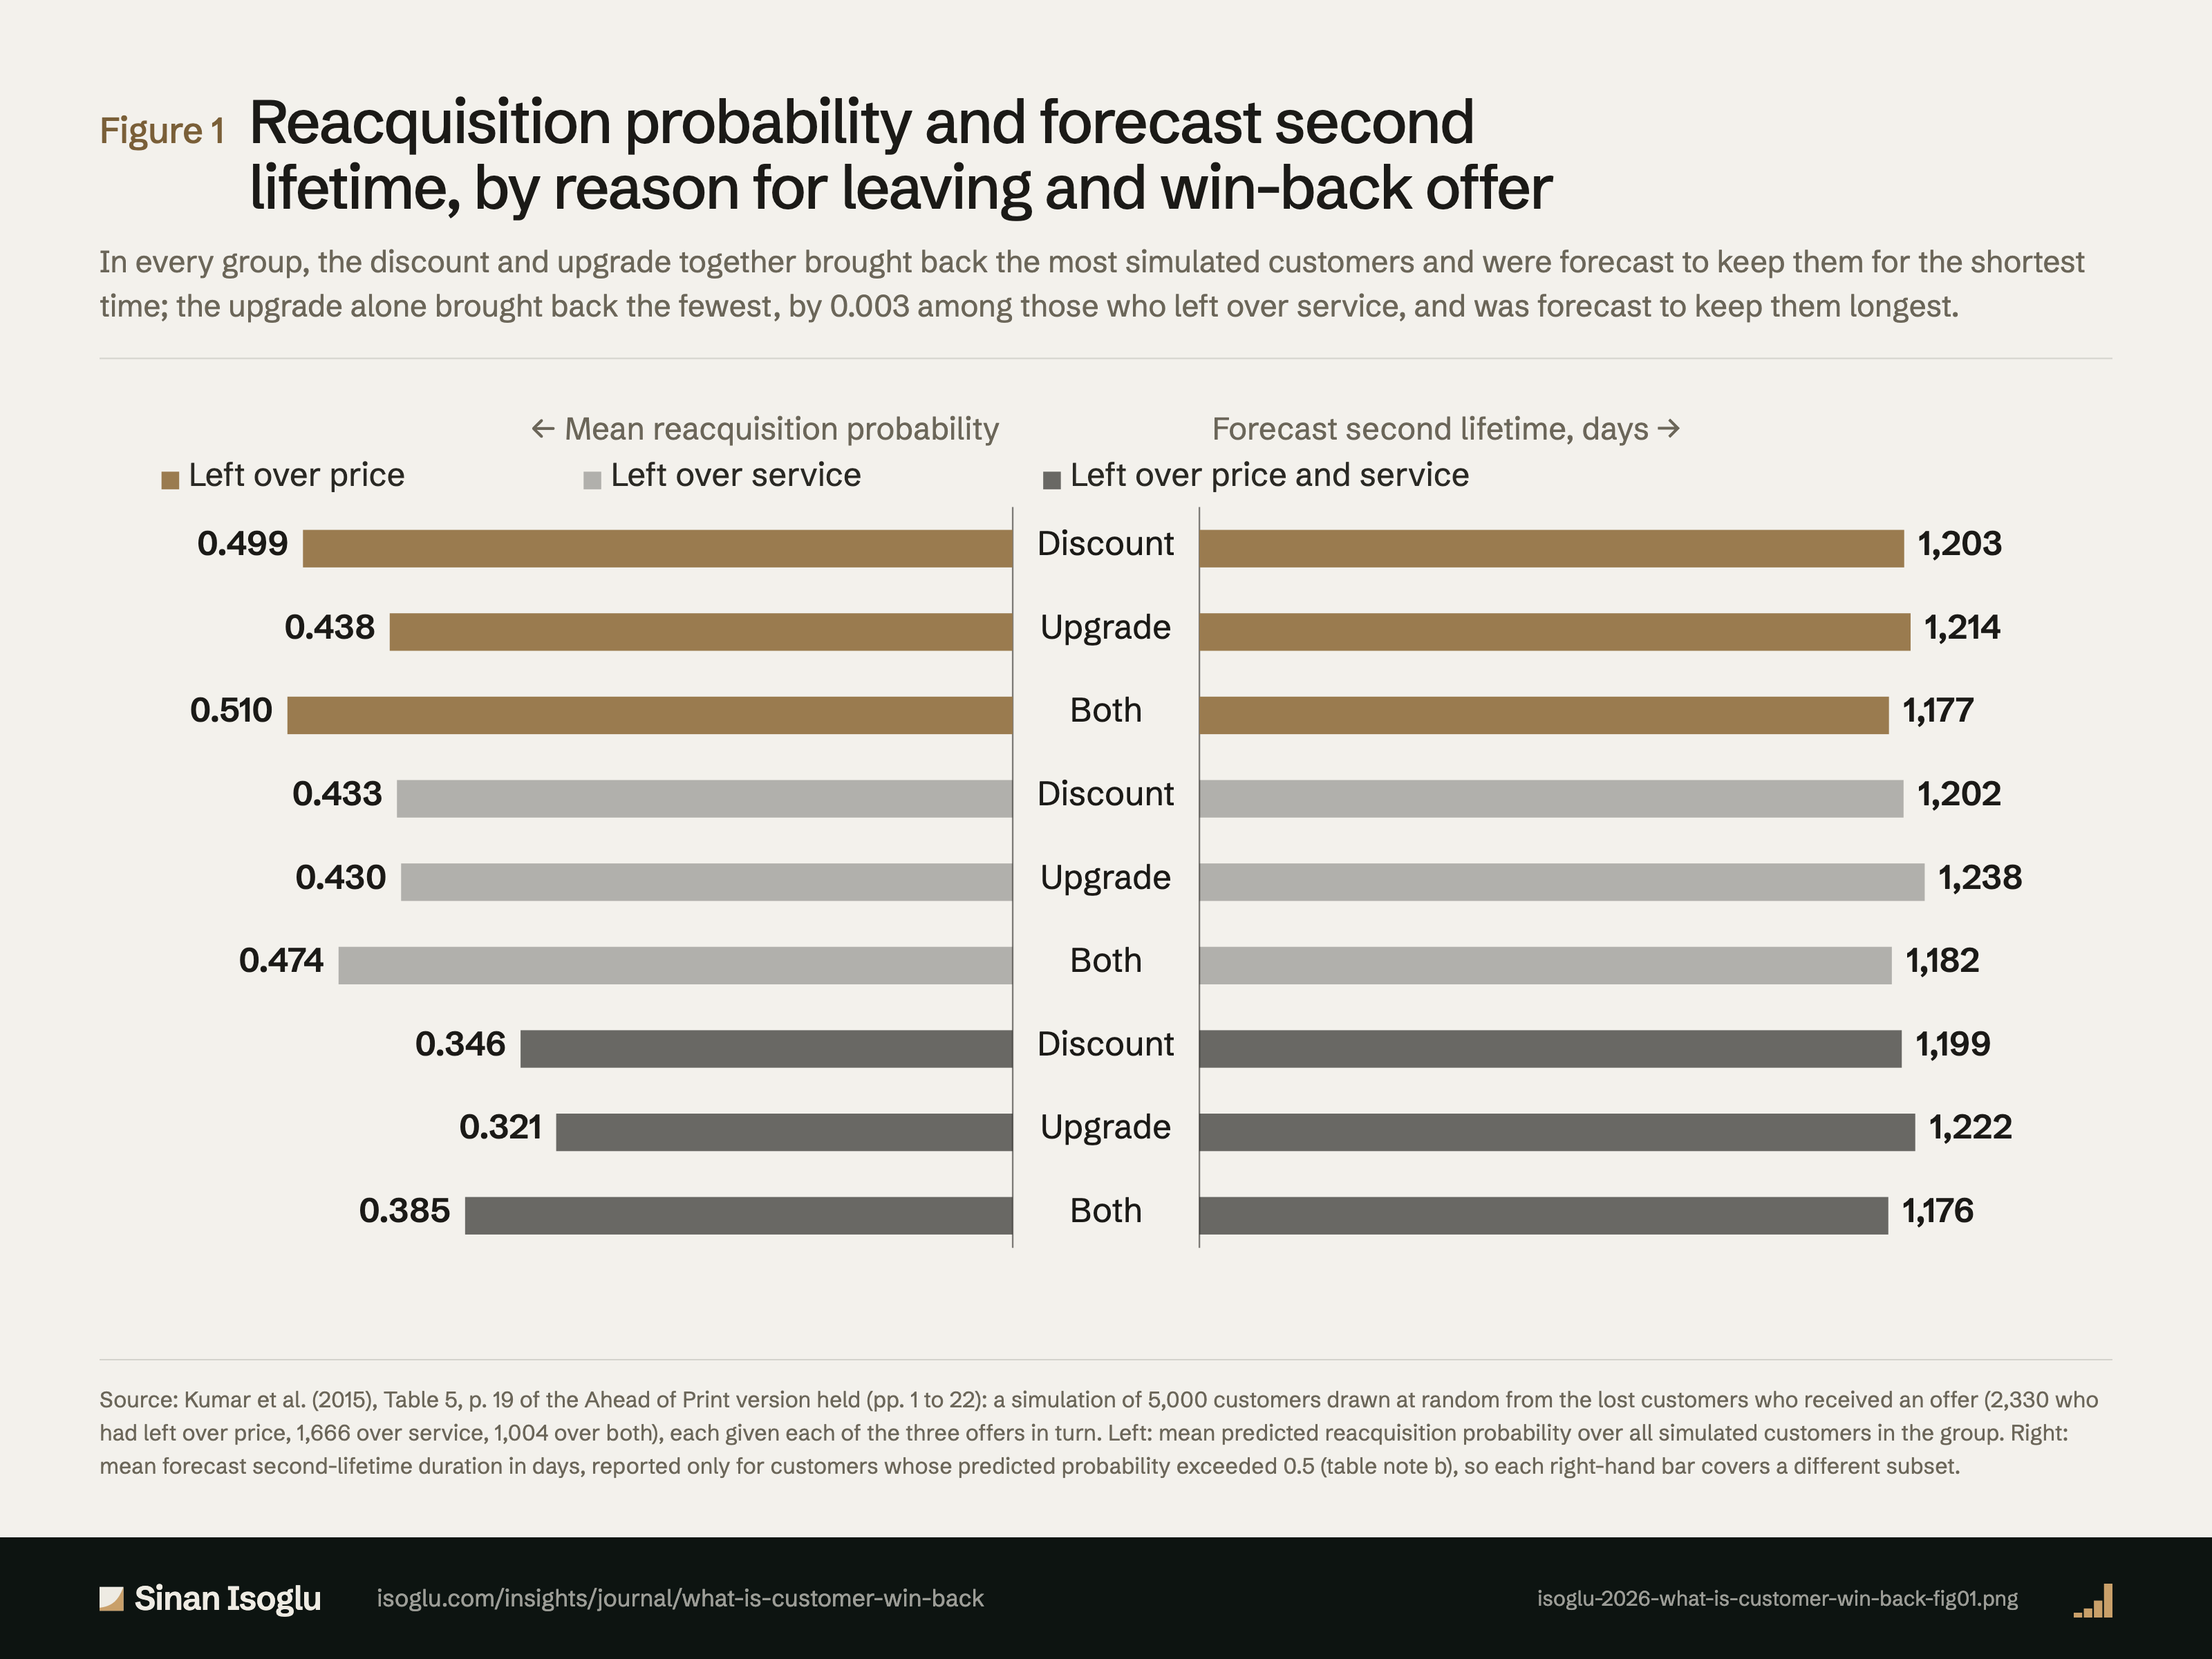
Abbildung 1Grafik
Rückgewinnungswahrscheinlichkeit und prognostizierte zweite Kundenbeziehung, nach Abwanderungsgrund und Angebot
Was ist Kundenrückgewinnung?
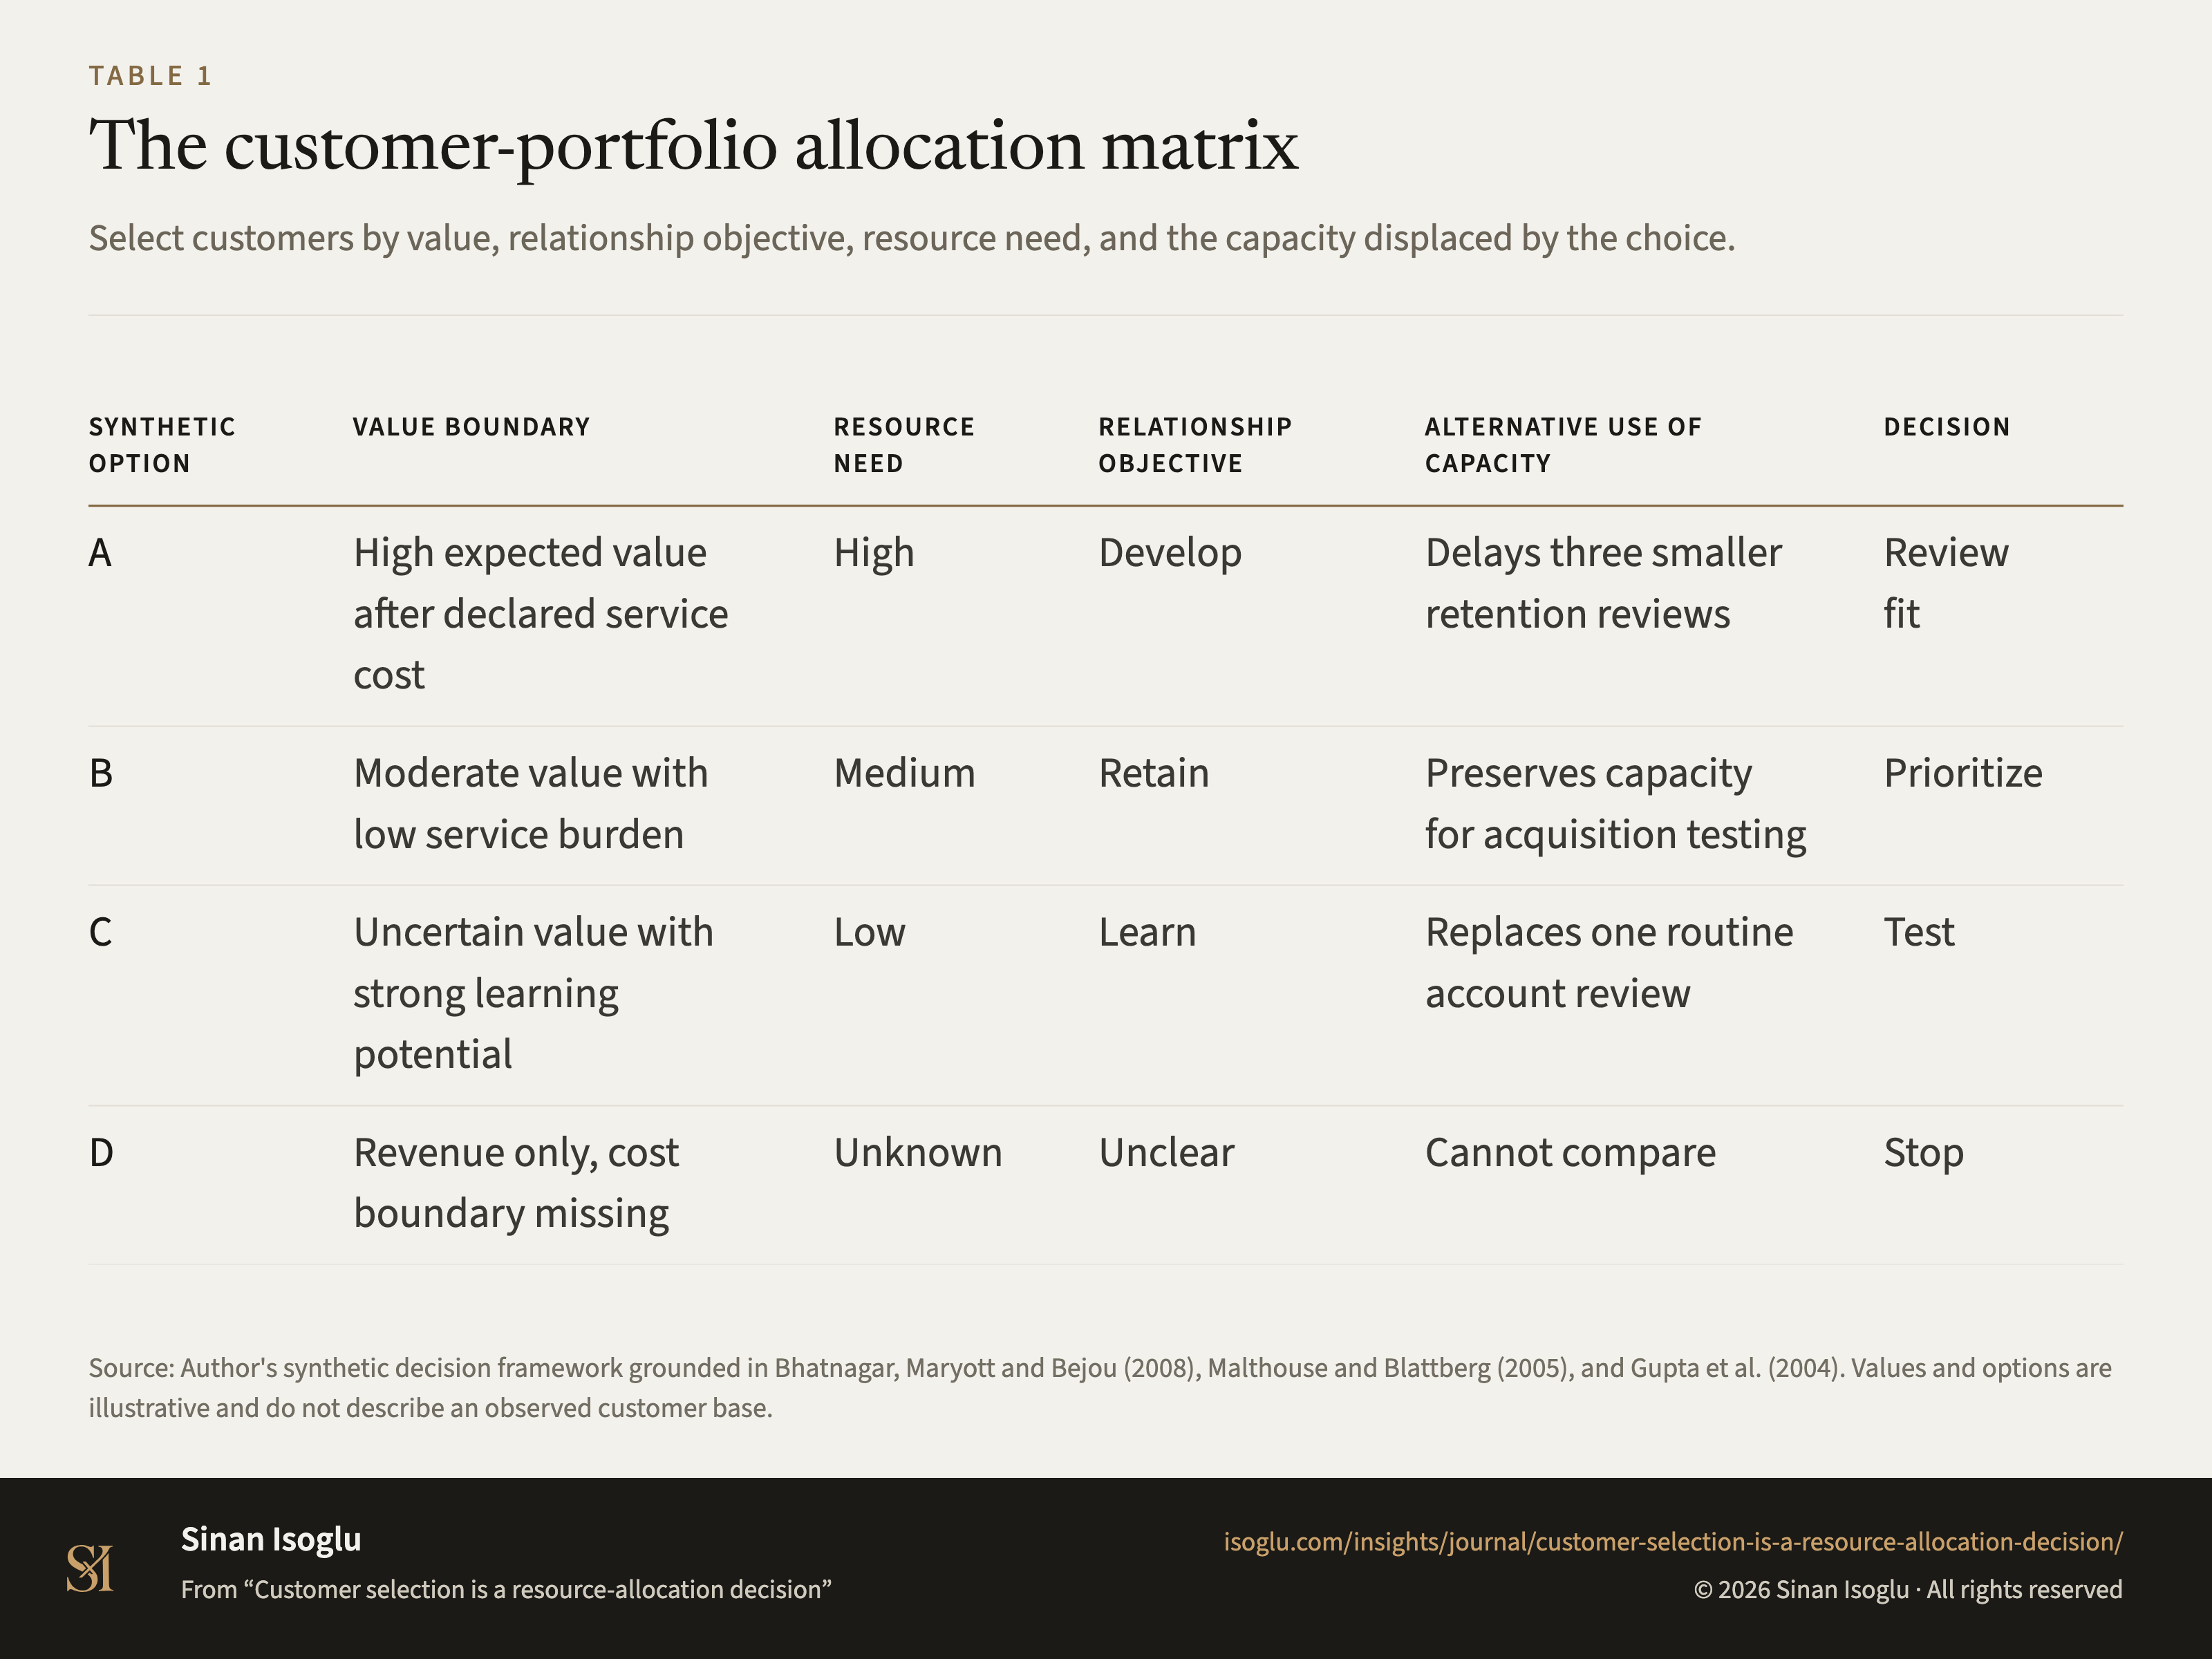
Tabelle 1Tabelle
Die Portfoliomatrix für Kundenallokation
Kundenauswahl ist eine Ressourcenallokationsentscheidung
Kontakt
Schicken Sie die Frage, an der Sie arbeiten.
Forschung, ein Gastvortrag oder eine Frage aus der Praxis.