Figure 1From “What is reference class forecasting?”
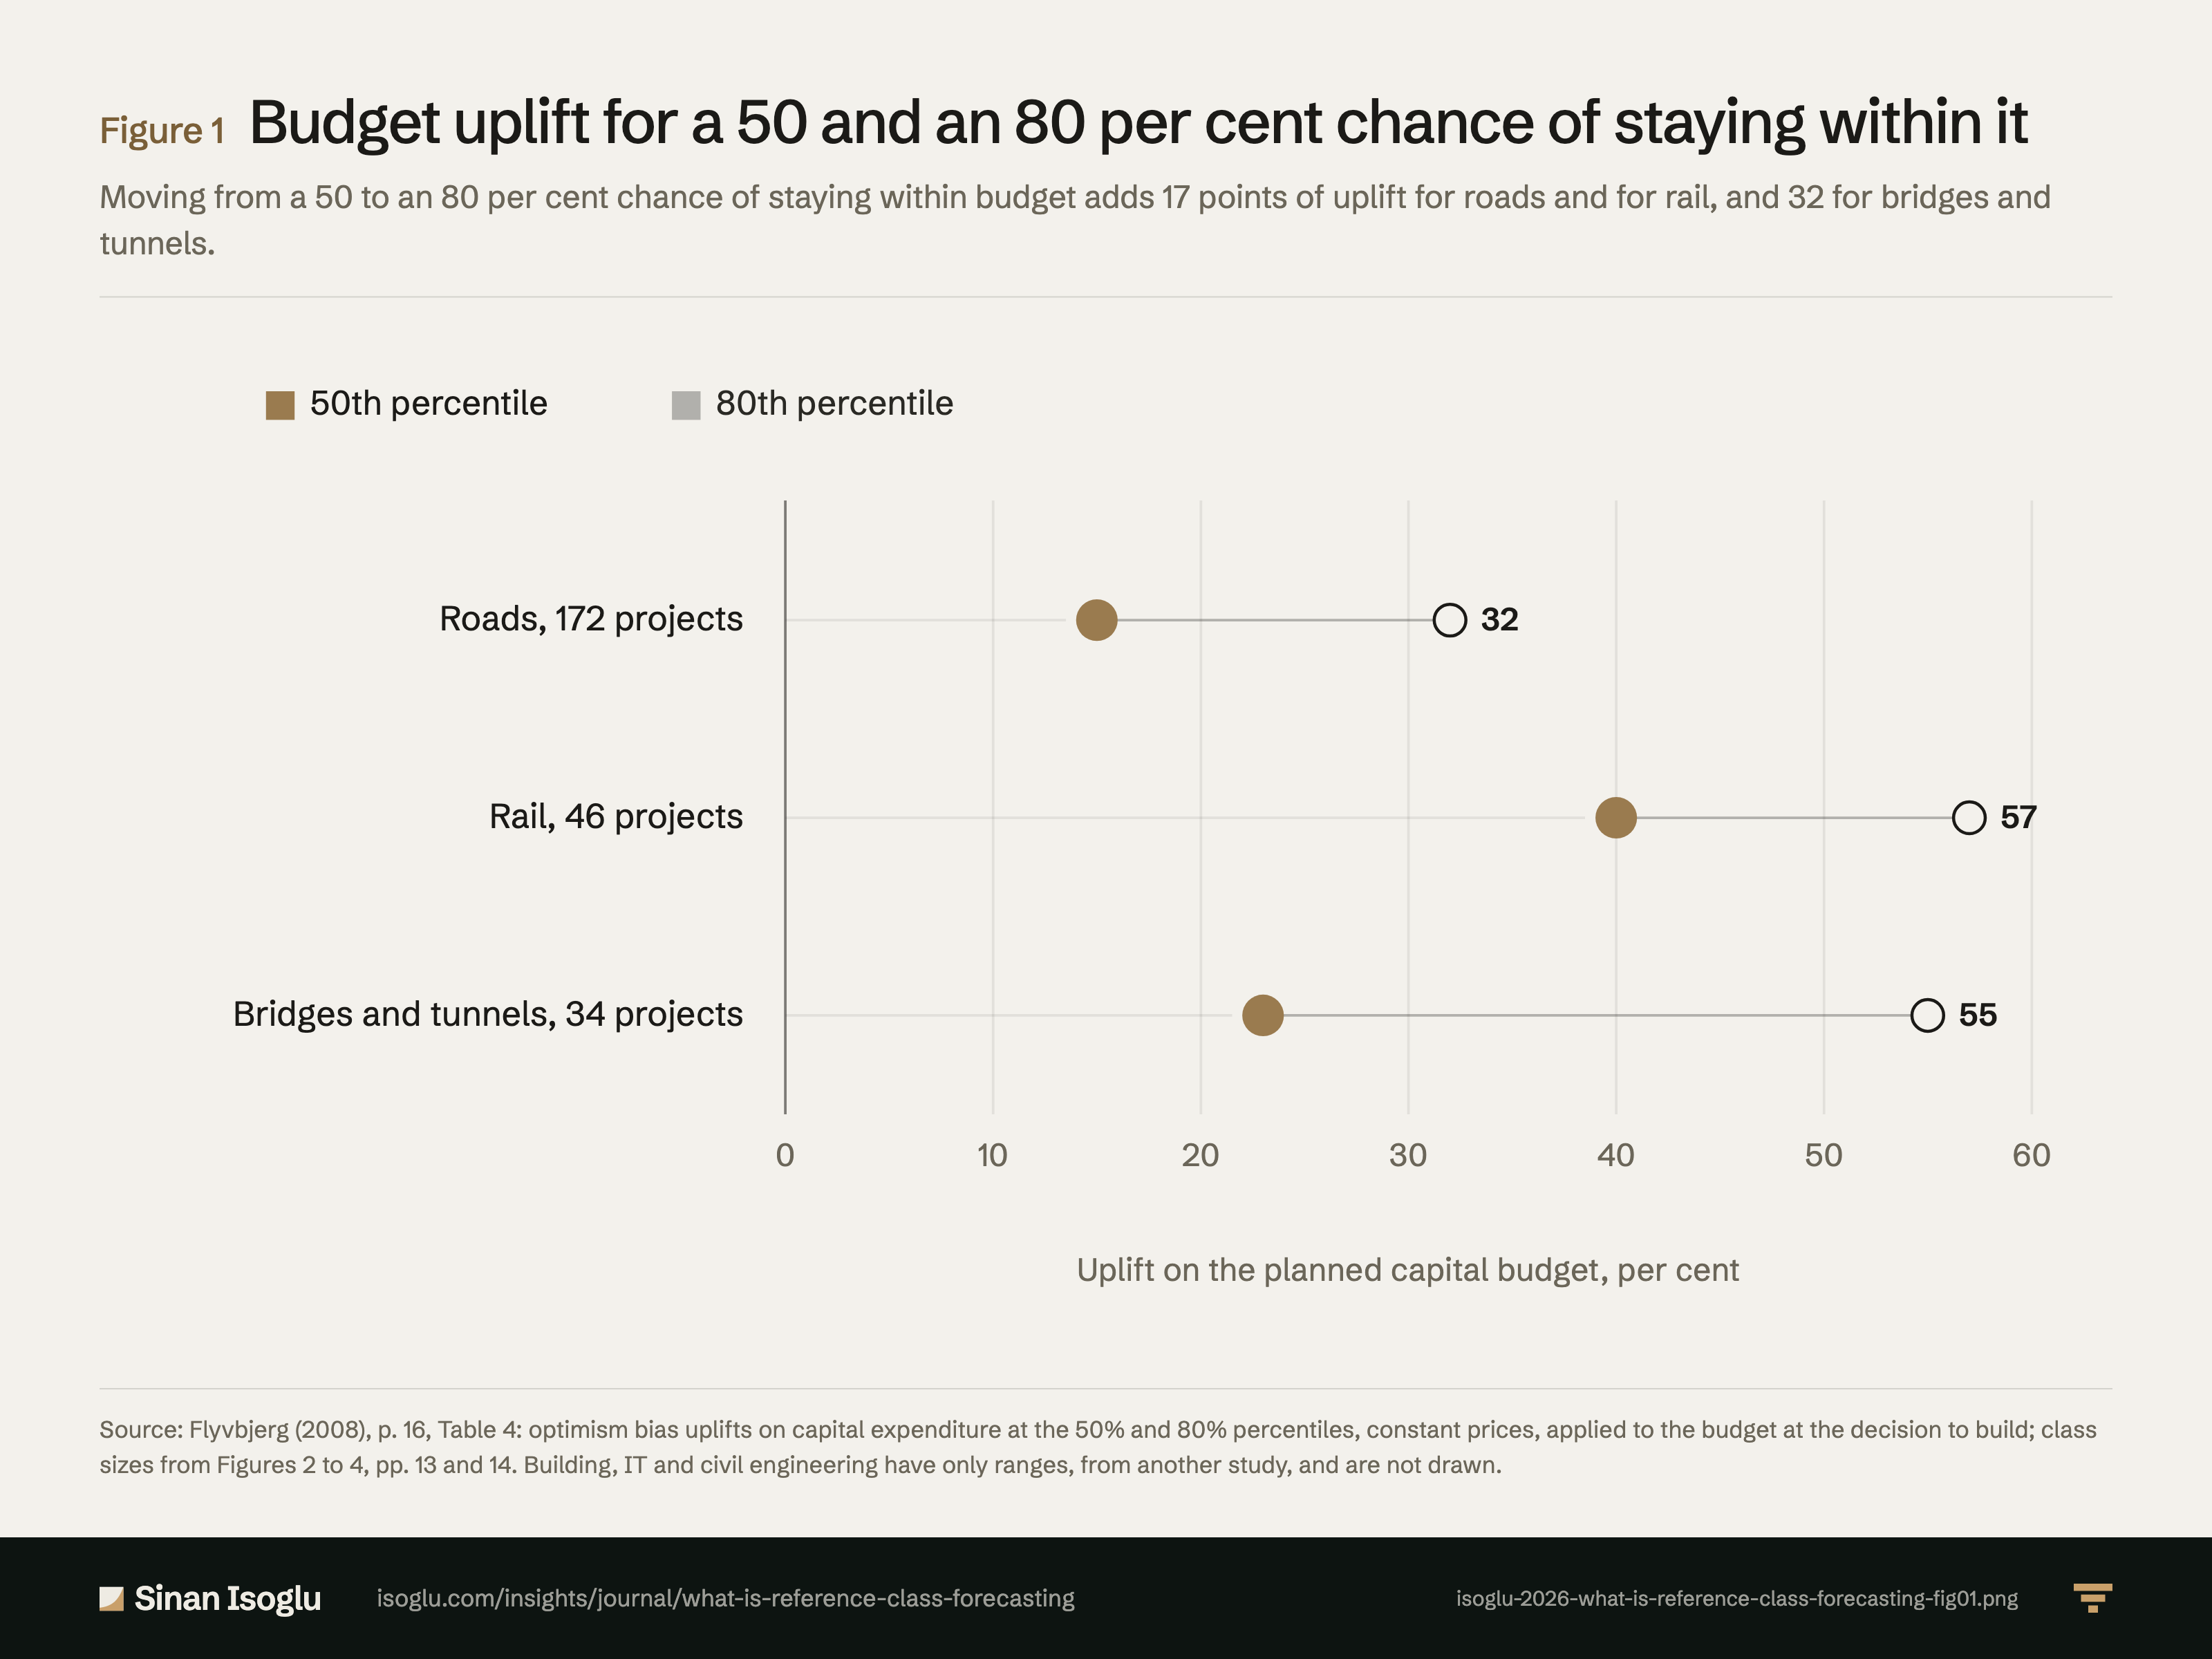
Budget uplift for a 50 and an 80 per cent chance of staying within it
Moving from a 50 to an 80 per cent chance of staying within budget adds 17 points of uplift for roads and for rail, and 32 for bridges and tunnels.
Figure 1Budget uplift for a 50 and an 80 per cent chance of staying within it
Source: Flyvbjerg (2008), p. 16, Table 4: optimism bias uplifts on capital expenditure at the 50% and 80% percentiles, constant prices, applied to the budget at the decision to build; class sizes from Figures 2 to 4, pp. 13 and 14. Building, IT and civil engineering have only ranges, from another study, and are not drawn.
Source and evidence
Each line names a claim related to this exhibit, its source, and how it was checked.
- A FLY08-C4 UK practice from a study by Flyvbjerg and Cowi: categories of transport schemes with statistically similar overrun risk; a road class of 172 projects (rail 46, fixed links 34, from the captions of Figures 2 to 4, pp. 13 and 14); uplifts rise as acceptable risk falls; Table 4 uplifts at the 50th and 80th percentiles, constant prices: roads 15% and 32%, rail 40% and 57%, fixed links 23% and 55% (building, IT and civil engineering ranges from Mott MacDonald without a distribution); the 80th percentile is the Department for Transport's usual accepted risk; the motorway example (£100 million becomes £132 million at 80%, £115 million at 50%); the median suits a large portfolio; lower uplifts only with historical evidence of better estimating and, conversely, higher uplifts where there is evidence of worse estimating (added after G5 F1); the upper percentiles for investors who want a high degree of certainty, for instance in stand-alone projects; uplifts applied to estimated budgets at the time of decision to build (G5 N7); required for funding applications from August 2004 (pp. 10 to 16): "Based on a study by Flyvbjerg and Cowi (2004), the Treasury and the Department for Transport decided to systematically employ reference class forecasting as part of project appraisal for large transportation projects in the UK."; "statistical tests, benchmarkings, and other analyses showed that the risk of cost overruns within each category could be treated as statistically similar"; "For roads, for example, a class of 172 completed and comparable projects was used"; "The lower the acceptable risk for cost overrun, the higher the uplift."; "Applicable capital expenditure optimism bias uplifts for 50% and 80% percentiles, constant prices"; "Based on Mott MacDonald (2002, p. 32); no probability distribution available."; "is the level of risk that the UK Department for Transport is typically willing to accept for large investments in local transportation infrastructure"; "then they would use an uplift of 32% on their estimated capital expenditure budget"; "would be £132 million"; "then the uplift would be 15% and the final budget £115 million"; "The median or average uplift would be pertinent to the investor with a large project portfolio, where cost overruns on one project may be offset by cost savings on another."; "Only if planners have historical evidence to demonstrate that they would be significantly better at estimating costs for the project at hand than their colleagues were for the projects in the reference class would the planners be justified in using lower uplifts"; "Conversely, if there is evidence that the planners are worse at estimating costs than their colleagues, then higher uplifts should be used."; "should be used when investors want a high degree of certainty that cost overrun will not occur, for instance in stand-alone projects"; "The established uplifts for optimism bias should be applied to estimated budgets at the time of decision to build a project."; "From this date local authorities applying for funding for transportation projects with the Department for Transport or with HM Treasury were required to take into account optimism bias by using uplifts"Flyvbjerg (2008) · Flyvbjerg. (2008)
Grades: A, verified against the printed page of the primary source · B, primary source, text layer only · C, authoritative secondary · D, reported.
From the essay
Revenue operations & AI
What is reference class forecasting?
Reference class forecasting predicts a plan's outcome from how comparable past cases turned out, and corrects the plan's own estimate toward that record.
Read the essayThis exhibit belongs to an essay: the numbers live here, the argument lives there.
Cite or embed
Related exhibits
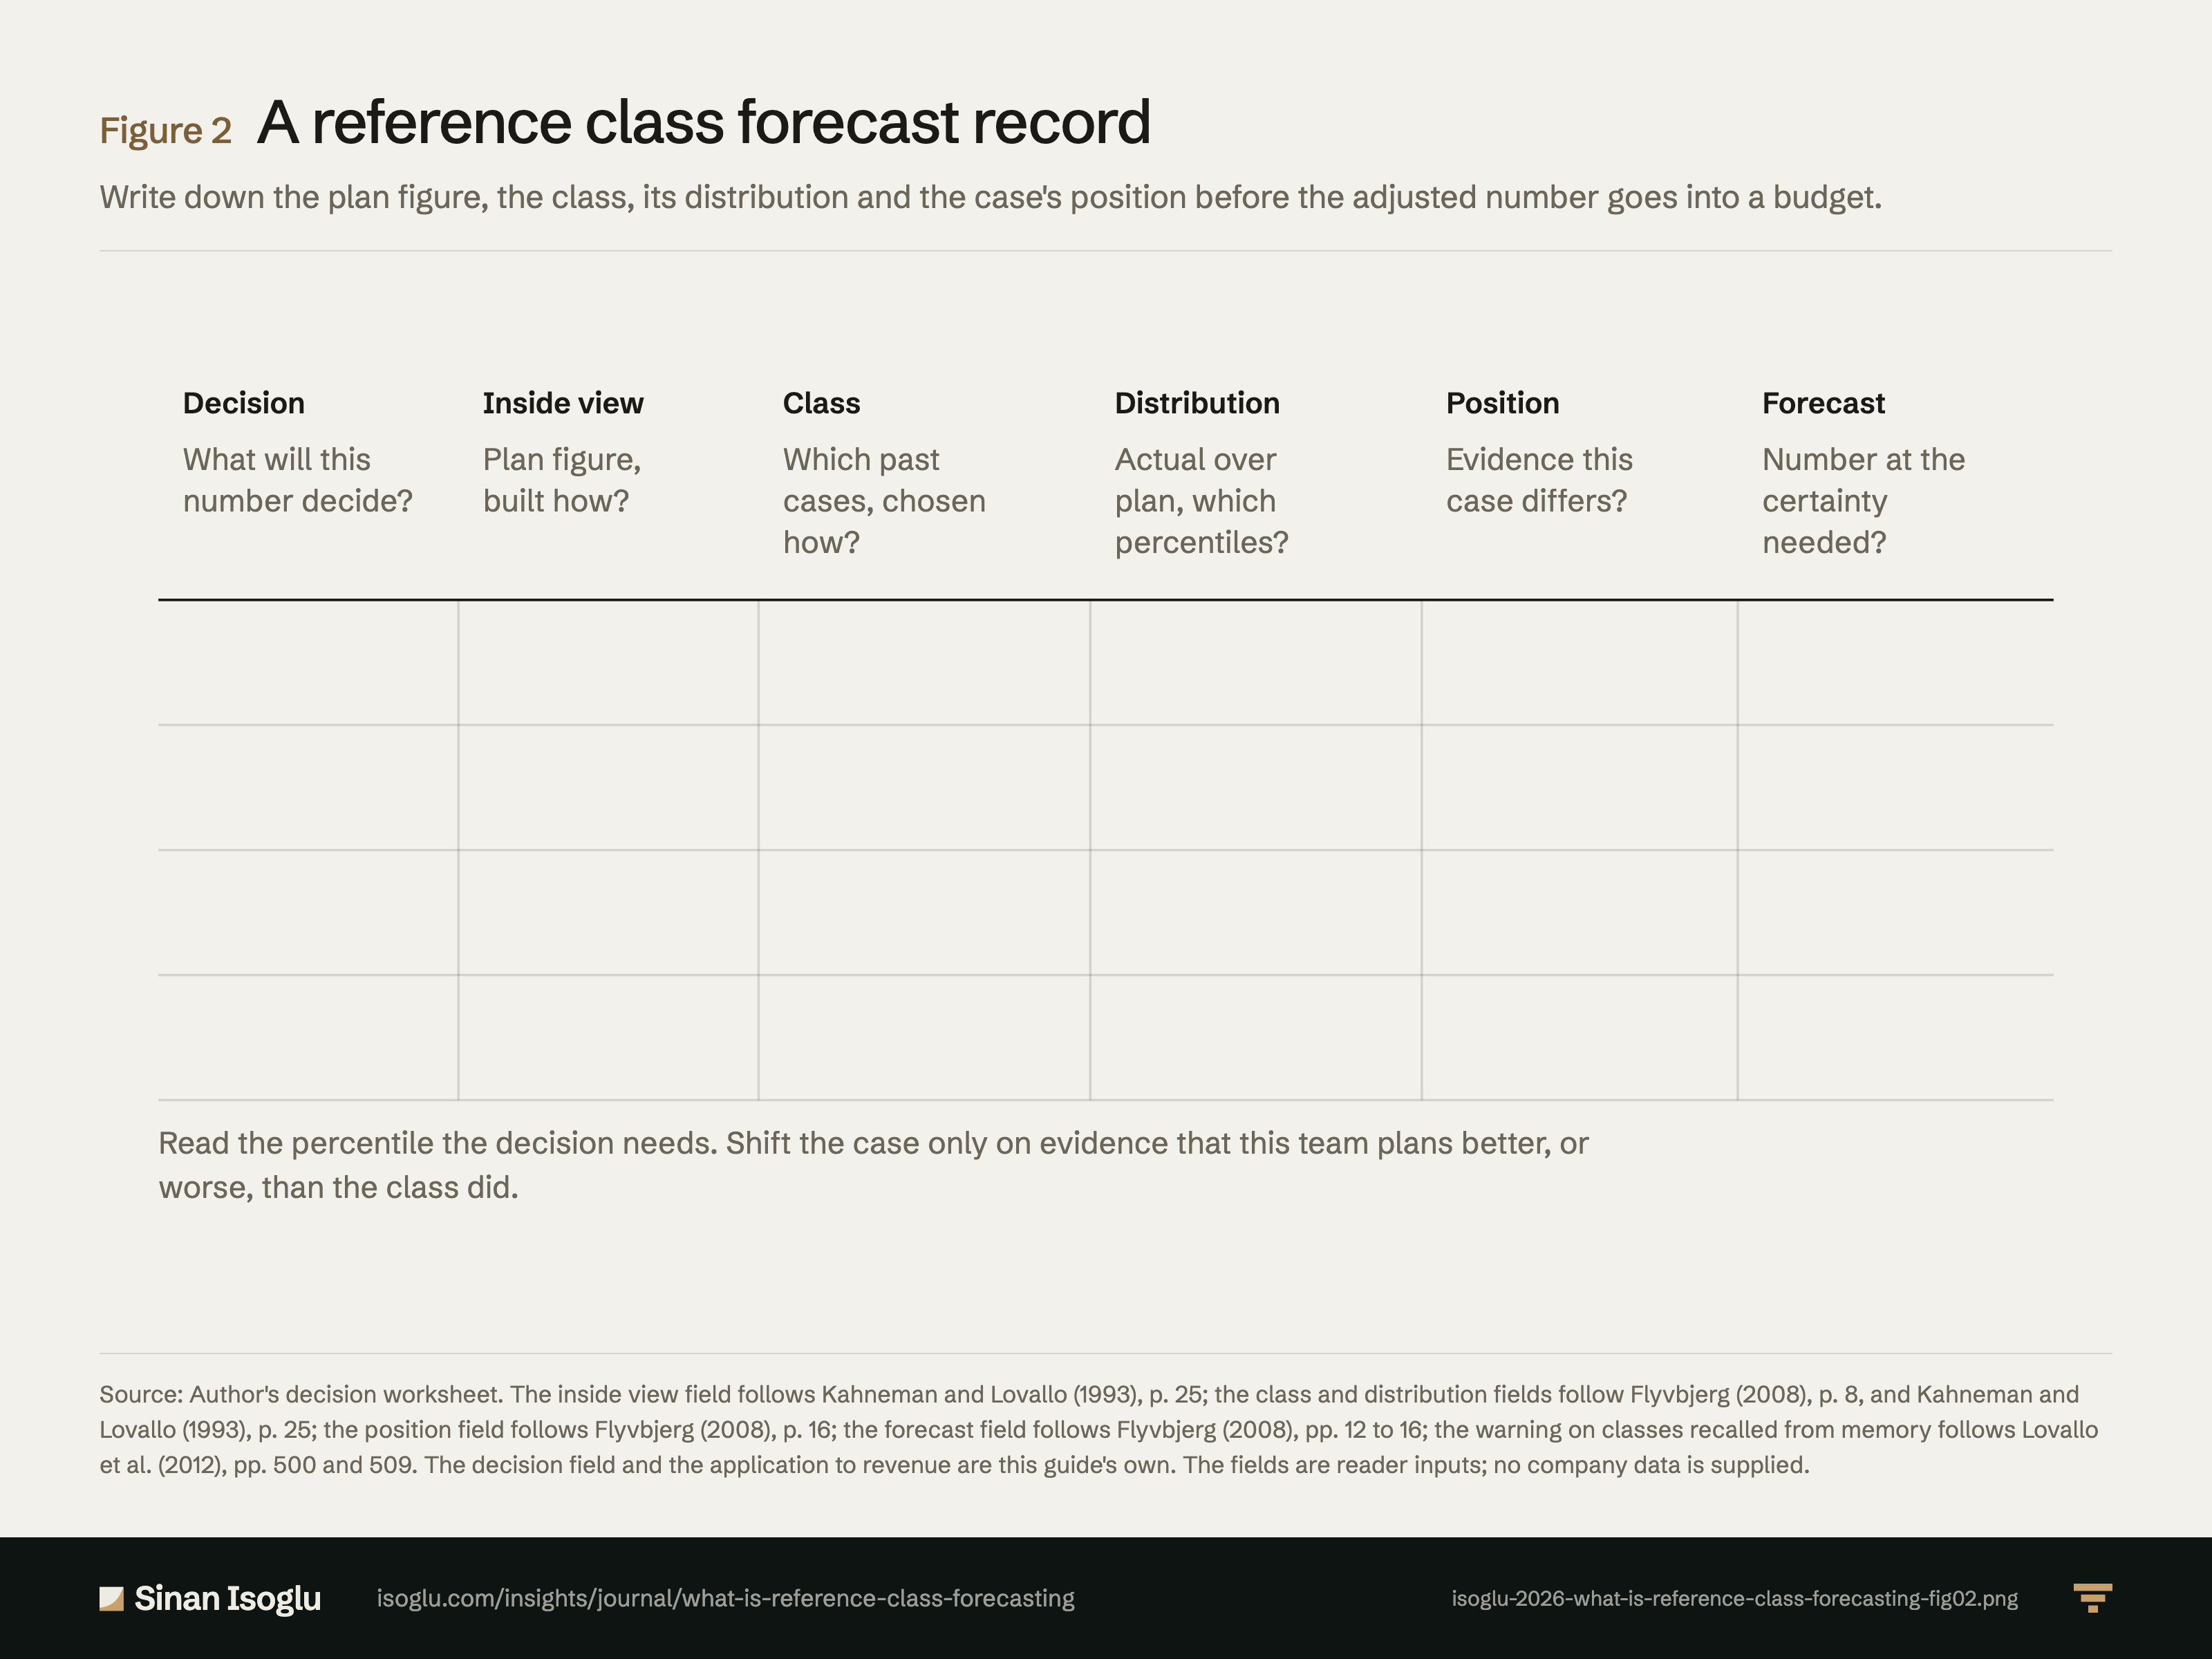
Figure 2Figure
A reference class forecast record
What is reference class forecasting?
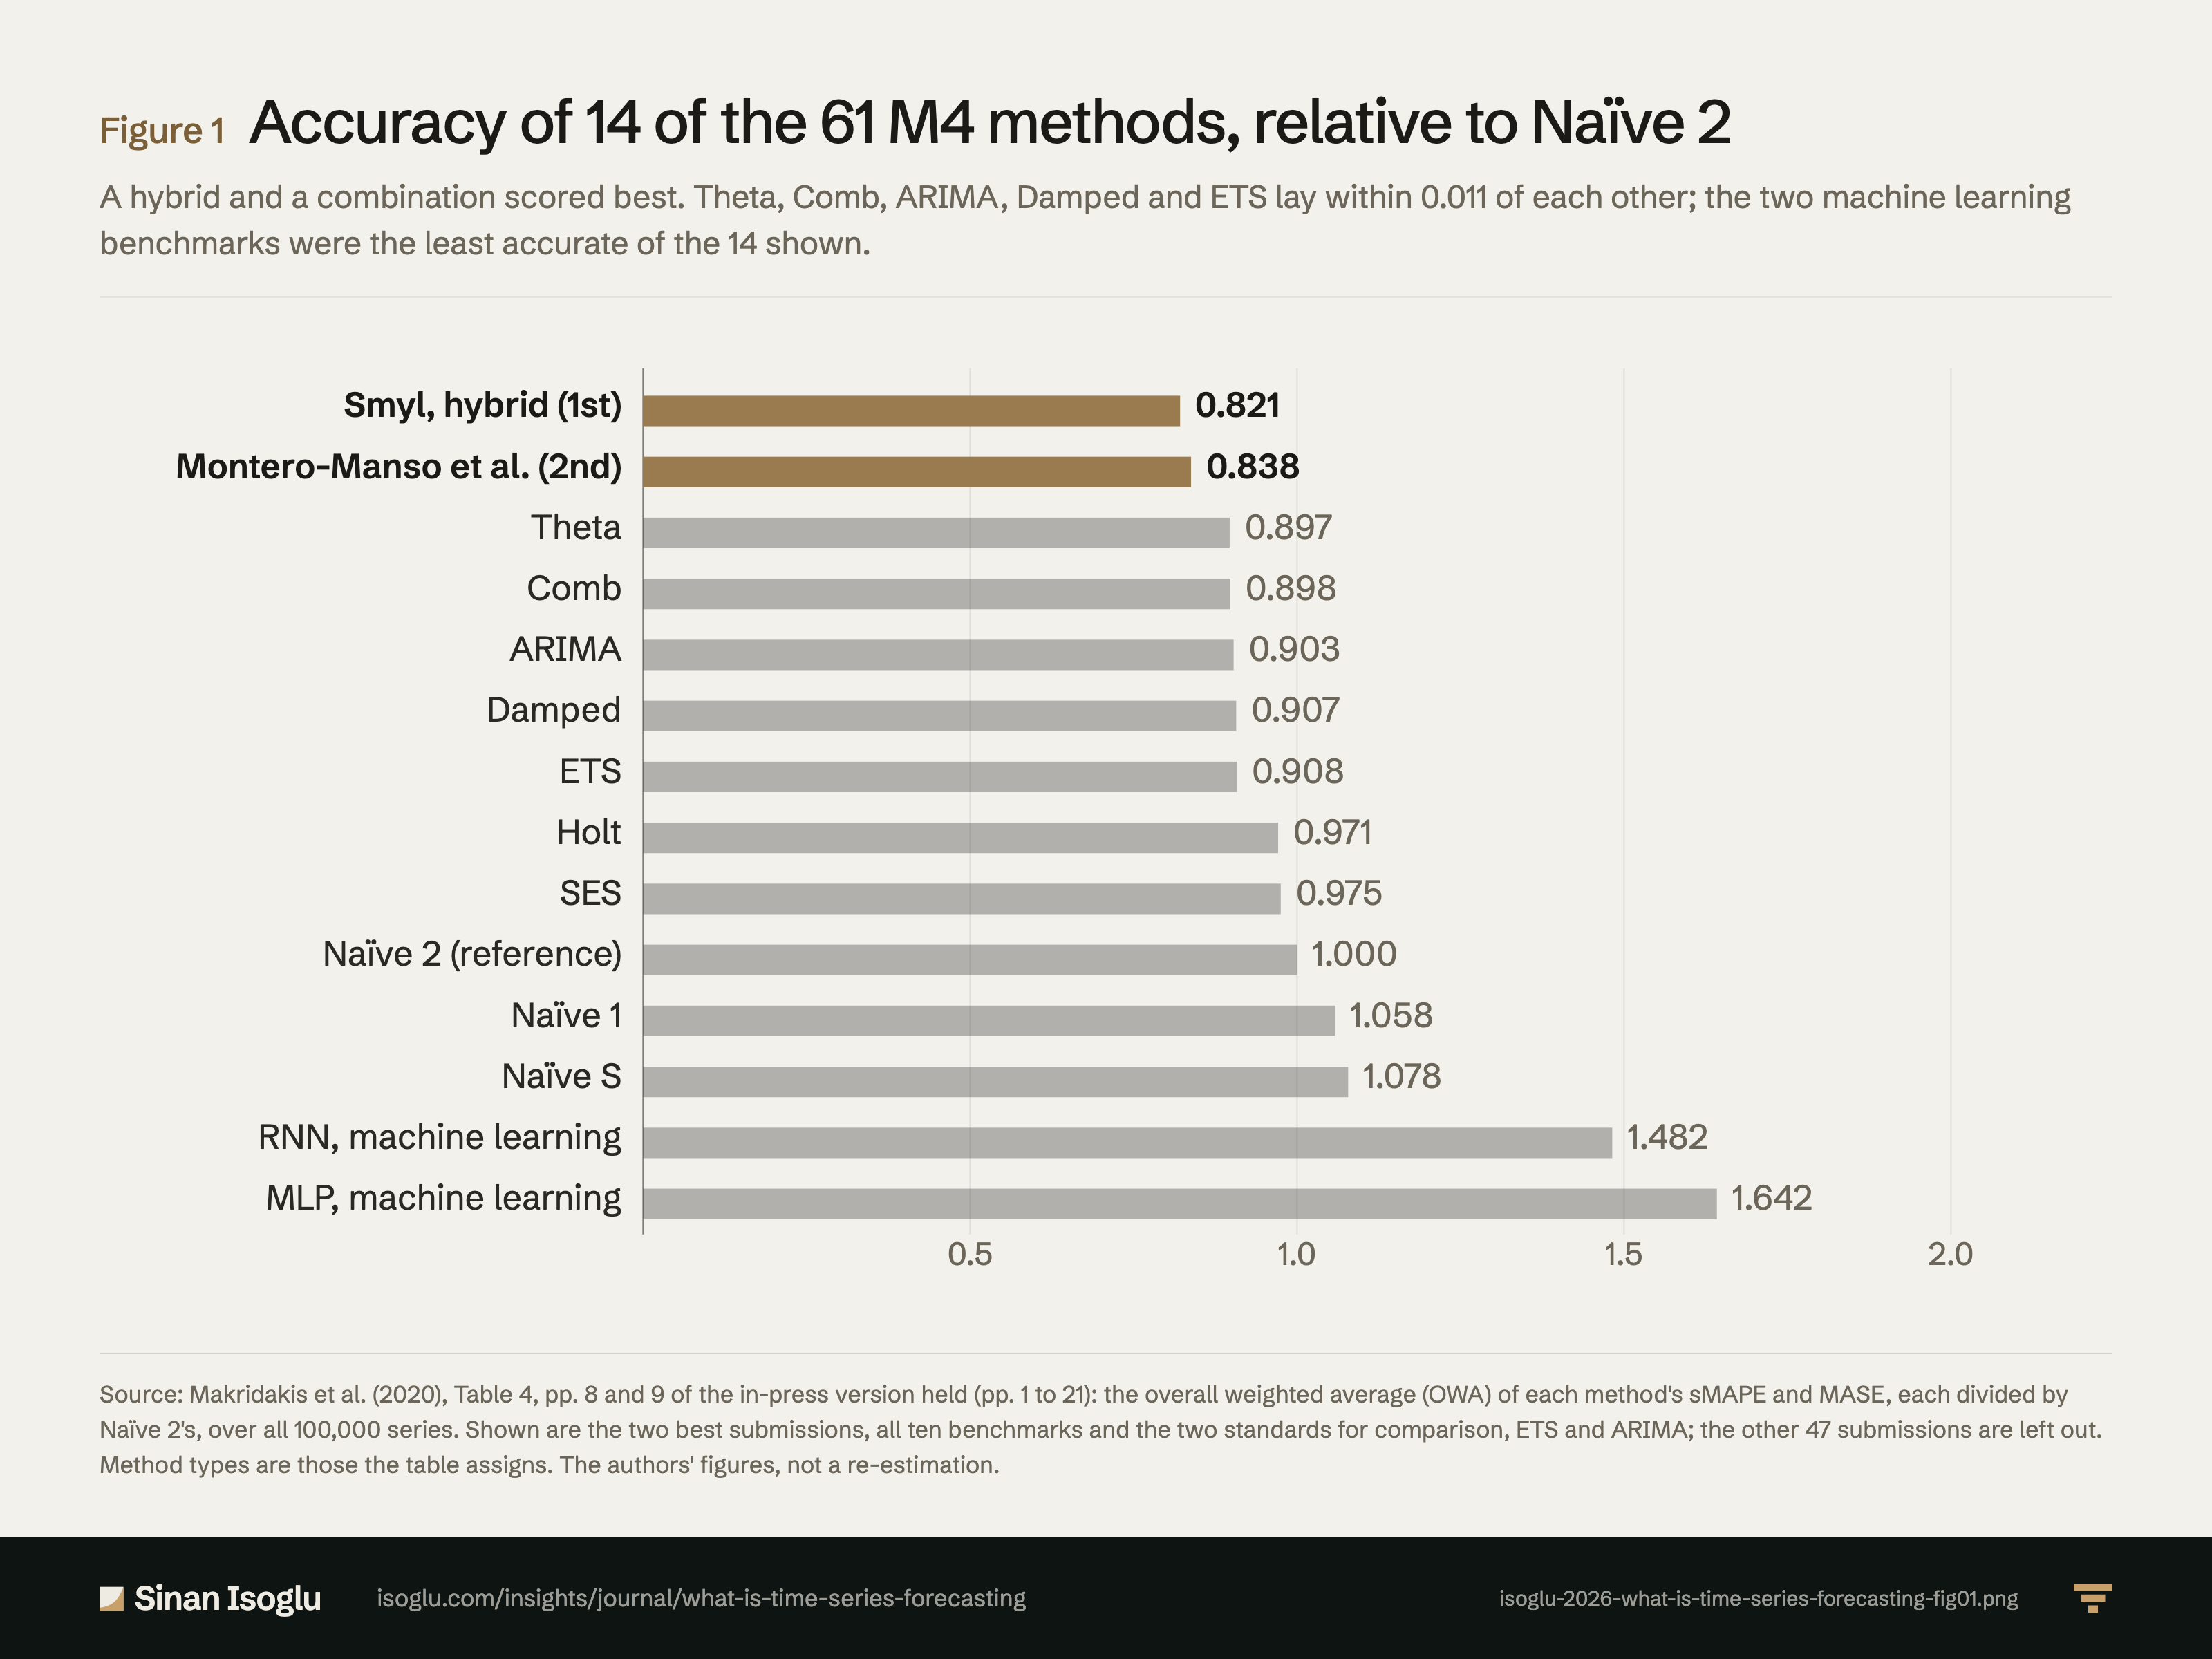
Figure 1Figure
Accuracy of 14 of the 61 M4 methods, relative to Naïve 2
What is time series forecasting?
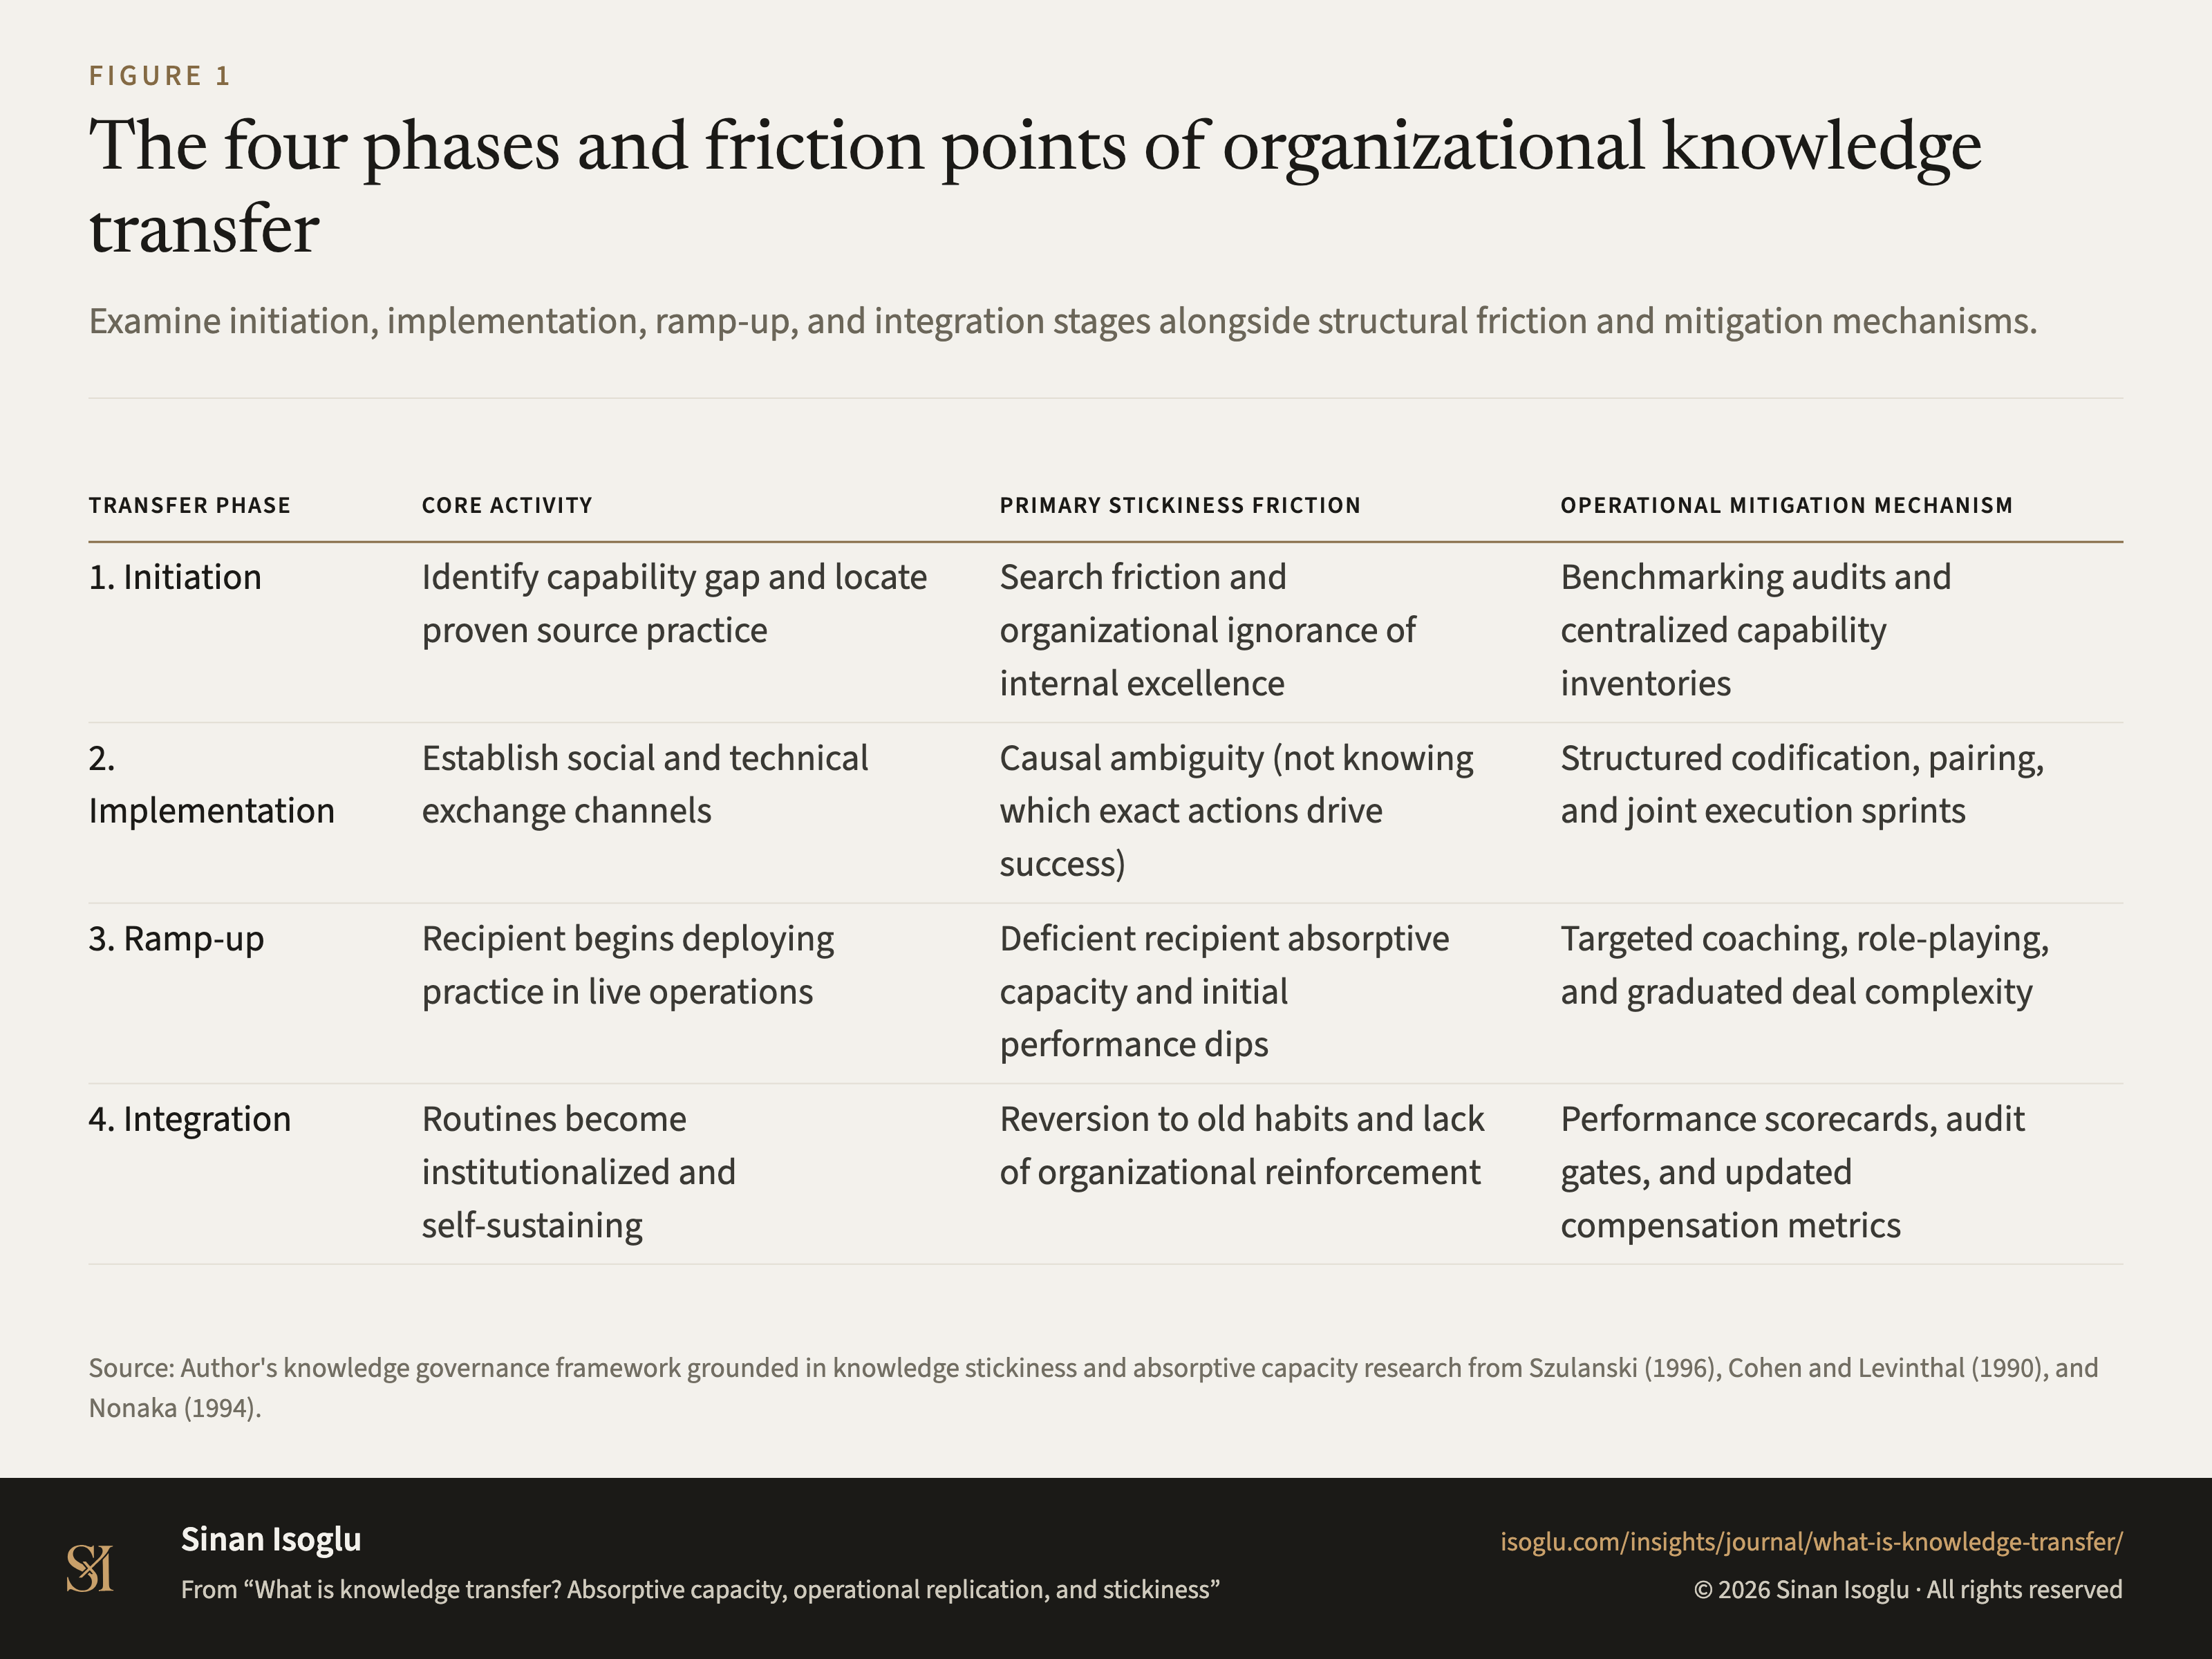
Figure 1Figure
The four phases and friction points of organizational knowledge transfer
What is knowledge transfer? Absorptive capacity, operational replication, and stickiness
Contact
Bring the question you're working on.
Research, a guest lecture, or a commercial question.