Abbildung 1Aus „Was ist eine Referenzklassenprognose?“
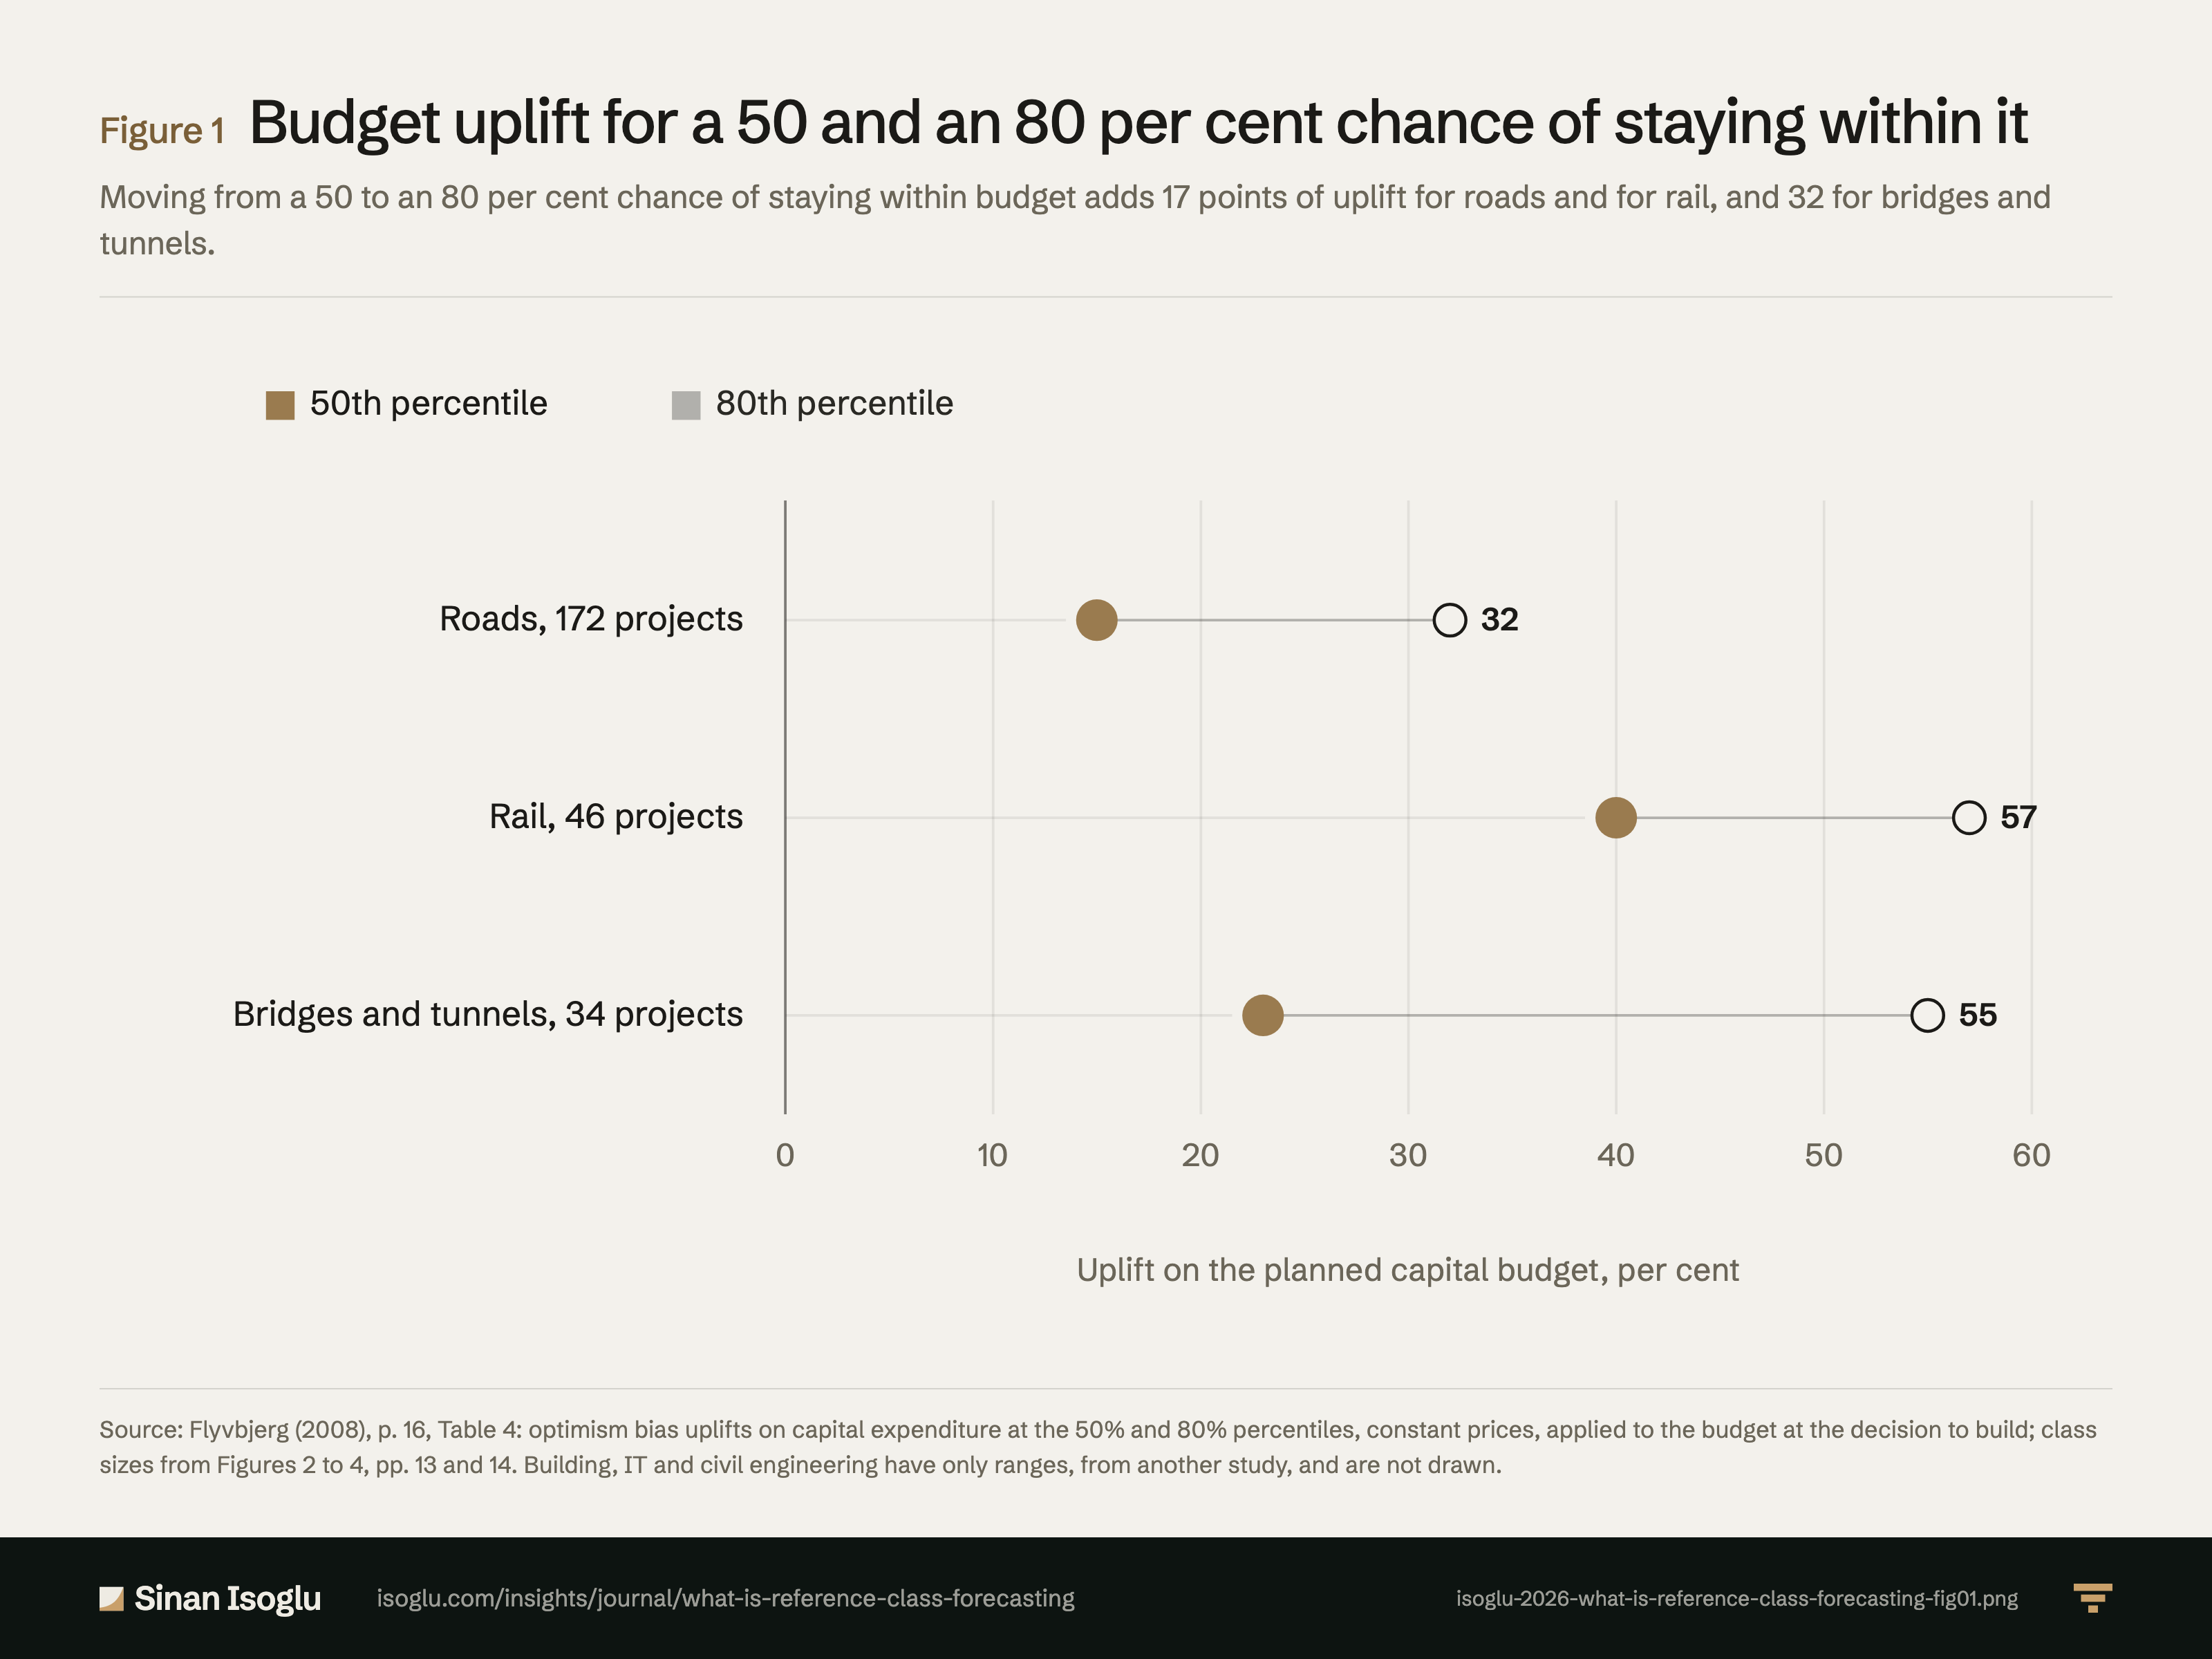
Zuschläge auf das Investitionsbudget bei 50 und bei 80 Prozent Wahrscheinlichkeit, im Budget zu bleiben
Der Schritt von 50 auf 80 Prozent Wahrscheinlichkeit, im Budget zu bleiben, erhöht den Zuschlag bei Straßen und bei Schienenprojekten um 17 Punkte, bei Brücken und Tunneln um 32.
Abbildung 1Zuschläge auf das Investitionsbudget bei 50 und bei 80 Prozent Wahrscheinlichkeit, im Budget zu bleiben
Quelle: Flyvbjerg (2008), S. 16, Tabelle 4: anwendbare Zuschläge für optimistische Verzerrung auf die Investitionsausgaben beim 50. und 80. Perzentil, zu konstanten Preisen, anzuwenden auf das Budget zum Zeitpunkt der Bauentscheidung; Klassengrößen aus den Abbildungen 2 bis 4, S. 13 und 14. Hochbauprojekte, IT-Projekte und Ingenieurbau tragen Spannen aus einer anderen Studie ohne Wahrscheinlichkeitsverteilung und sind nicht dargestellt.
Quelle und Evidenz
Jede Zeile nennt eine Aussage zu dieser Abbildung, ihre Quelle und die Art ihrer Prüfung.
- A FLY08-C4 UK practice from a study by Flyvbjerg and Cowi: categories of transport schemes with statistically similar overrun risk; a road class of 172 projects (rail 46, fixed links 34, from the captions of Figures 2 to 4, pp. 13 and 14); uplifts rise as acceptable risk falls; Table 4 uplifts at the 50th and 80th percentiles, constant prices: roads 15% and 32%, rail 40% and 57%, fixed links 23% and 55% (building, IT and civil engineering ranges from Mott MacDonald without a distribution); the 80th percentile is the Department for Transport's usual accepted risk; the motorway example (£100 million becomes £132 million at 80%, £115 million at 50%); the median suits a large portfolio; lower uplifts only with historical evidence of better estimating and, conversely, higher uplifts where there is evidence of worse estimating (added after G5 F1); the upper percentiles for investors who want a high degree of certainty, for instance in stand-alone projects; uplifts applied to estimated budgets at the time of decision to build (G5 N7); required for funding applications from August 2004 (pp. 10 to 16): "Based on a study by Flyvbjerg and Cowi (2004), the Treasury and the Department for Transport decided to systematically employ reference class forecasting as part of project appraisal for large transportation projects in the UK."; "statistical tests, benchmarkings, and other analyses showed that the risk of cost overruns within each category could be treated as statistically similar"; "For roads, for example, a class of 172 completed and comparable projects was used"; "The lower the acceptable risk for cost overrun, the higher the uplift."; "Applicable capital expenditure optimism bias uplifts for 50% and 80% percentiles, constant prices"; "Based on Mott MacDonald (2002, p. 32); no probability distribution available."; "is the level of risk that the UK Department for Transport is typically willing to accept for large investments in local transportation infrastructure"; "then they would use an uplift of 32% on their estimated capital expenditure budget"; "would be £132 million"; "then the uplift would be 15% and the final budget £115 million"; "The median or average uplift would be pertinent to the investor with a large project portfolio, where cost overruns on one project may be offset by cost savings on another."; "Only if planners have historical evidence to demonstrate that they would be significantly better at estimating costs for the project at hand than their colleagues were for the projects in the reference class would the planners be justified in using lower uplifts"; "Conversely, if there is evidence that the planners are worse at estimating costs than their colleagues, then higher uplifts should be used."; "should be used when investors want a high degree of certainty that cost overrun will not occur, for instance in stand-alone projects"; "The established uplifts for optimism bias should be applied to estimated budgets at the time of decision to build a project."; "From this date local authorities applying for funding for transportation projects with the Department for Transport or with HM Treasury were required to take into account optimism bias by using uplifts"Flyvbjerg (2008) · Flyvbjerg. (2008)
Prüfgrade: A, gegen die gedruckte Seite der Primärquelle geprüft · B, Primärquelle, nur Textebene · C, belastbare Sekundärquelle · D, berichtet.
Aus dem Beitrag
Revenue Operations & KI
Was ist eine Referenzklassenprognose?
Die Referenzklassenprognose leitet das Ergebnis eines Vorhabens aus dem Verlauf vergleichbarer früherer Fälle ab und rückt die Planzahl in deren Richtung.
Den Beitrag lesenDiese Abbildung gehört zu einem Essay: Die Zahlen stehen hier, das Argument dort.
Zitieren oder einbetten
Verwandte Abbildungen
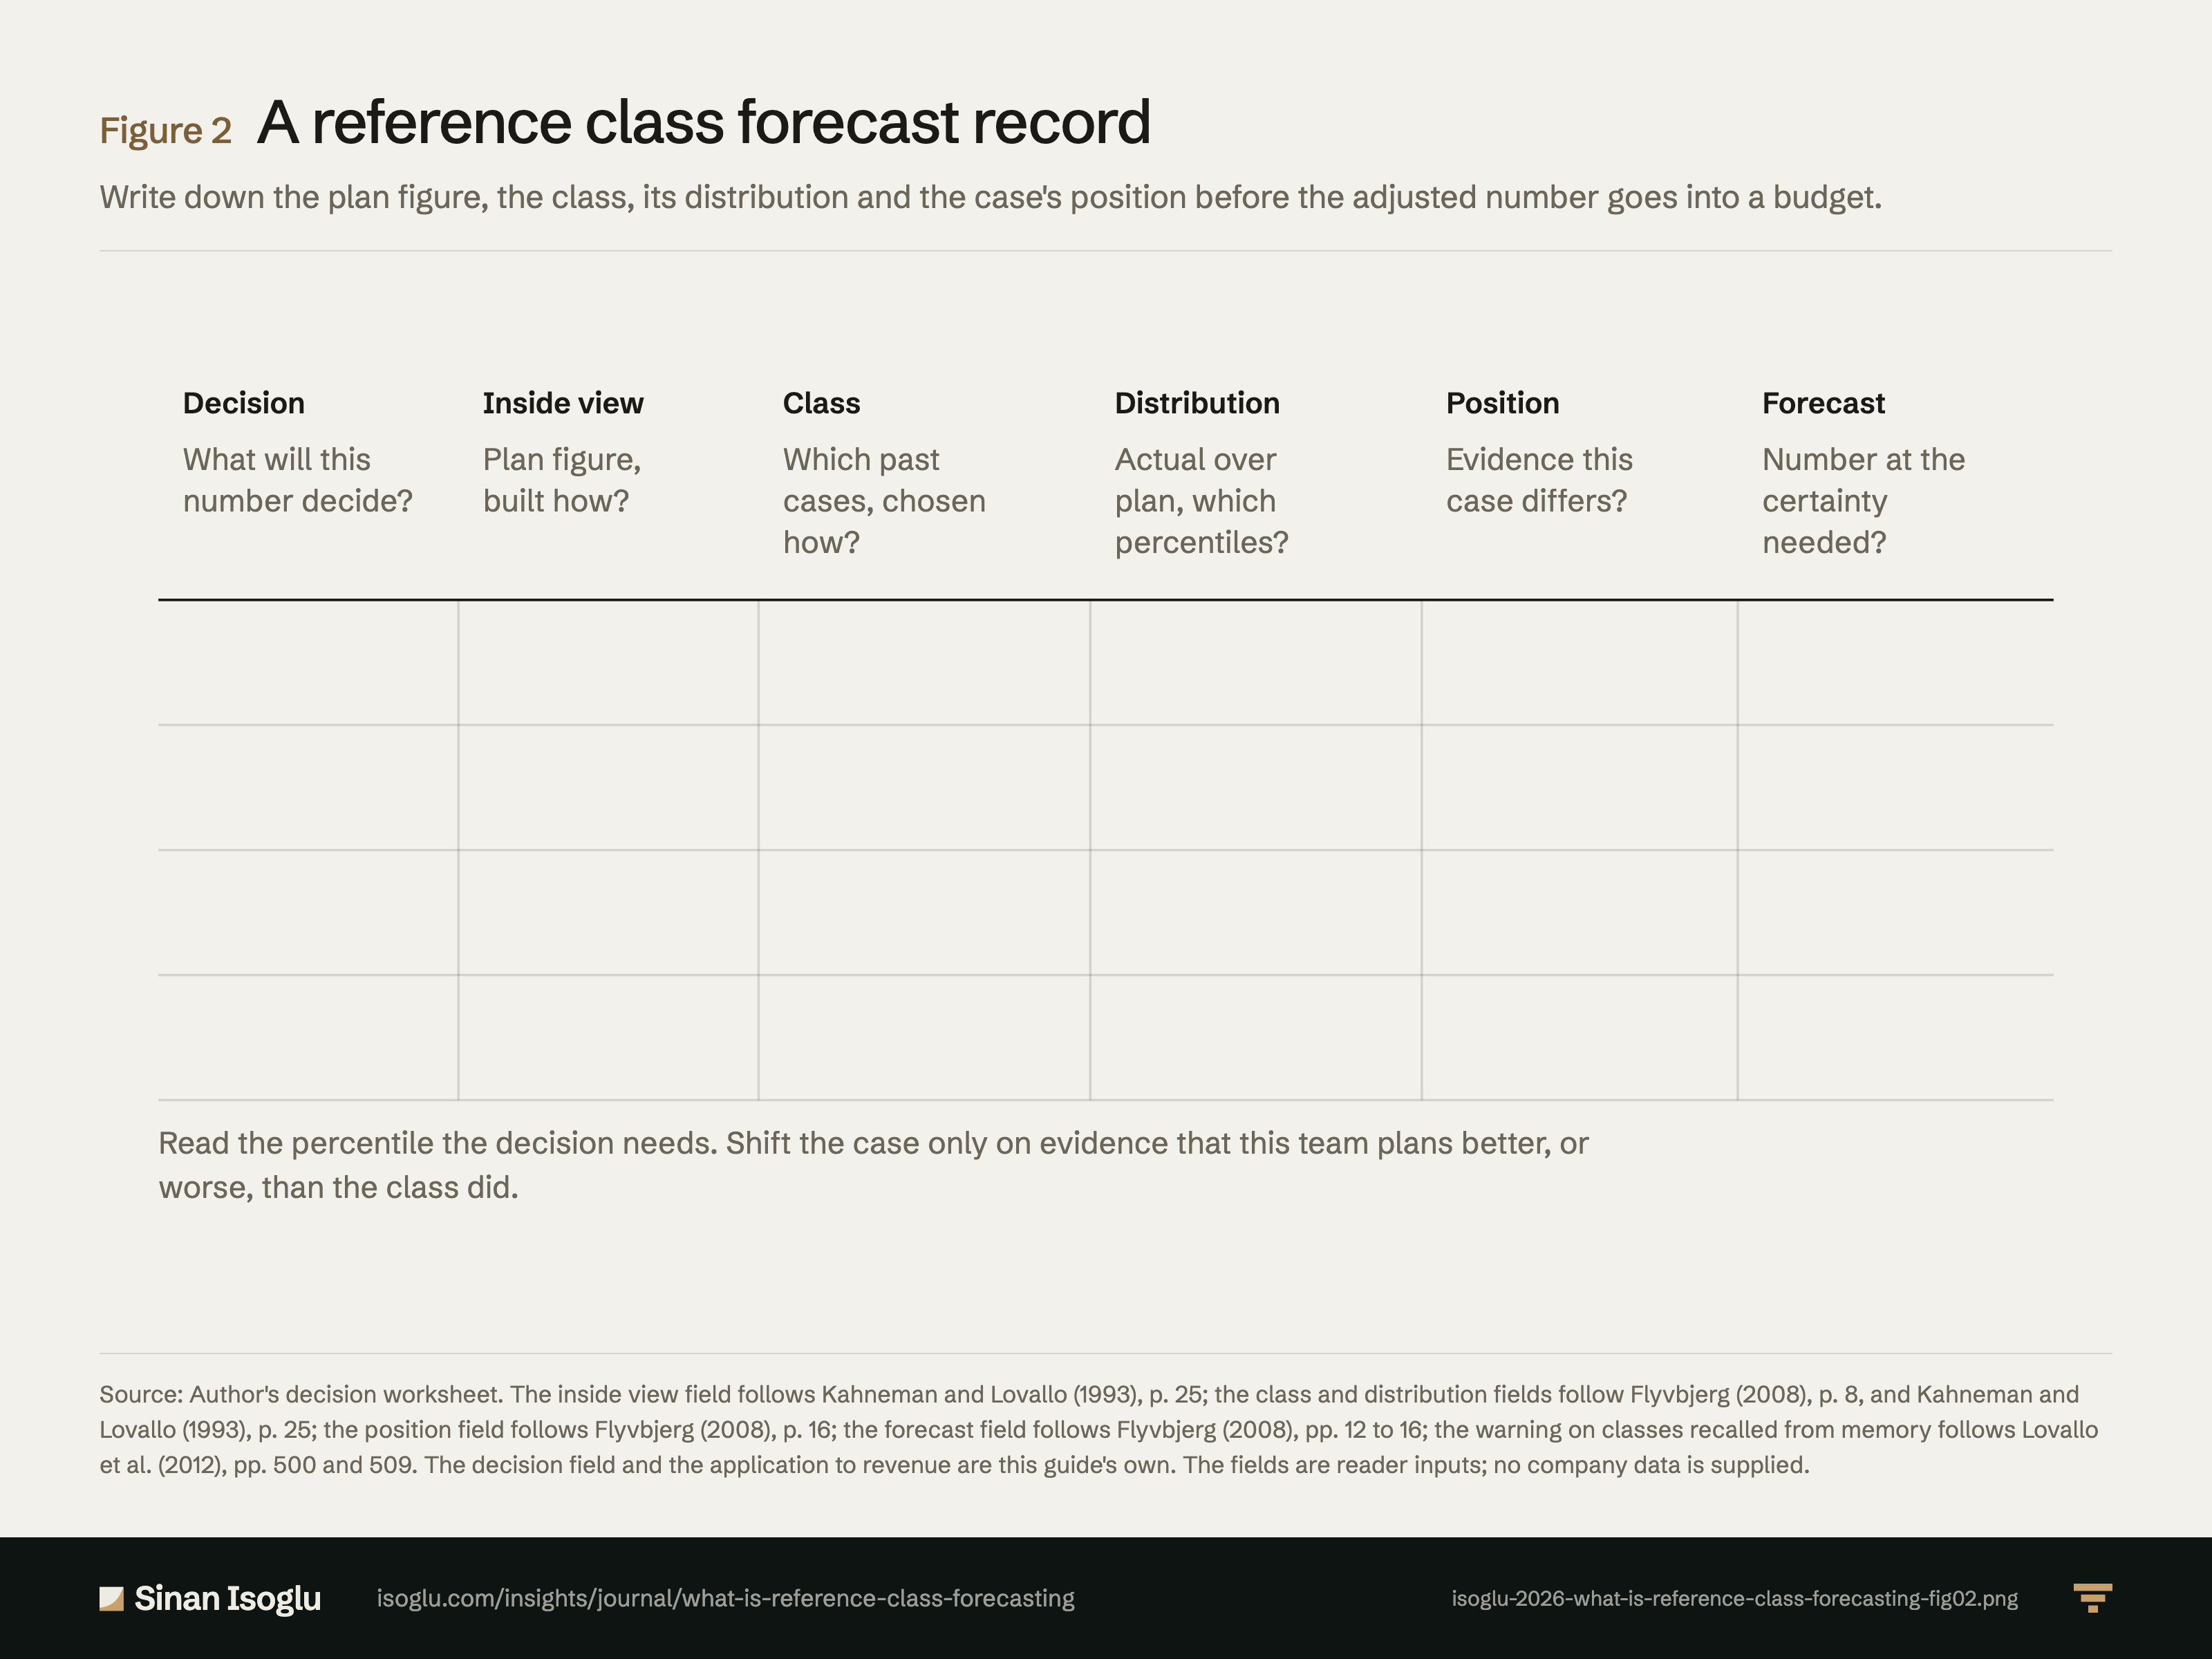
Abbildung 2Grafik
Ein Blatt für eine Referenzklassenprognose
Was ist eine Referenzklassenprognose?
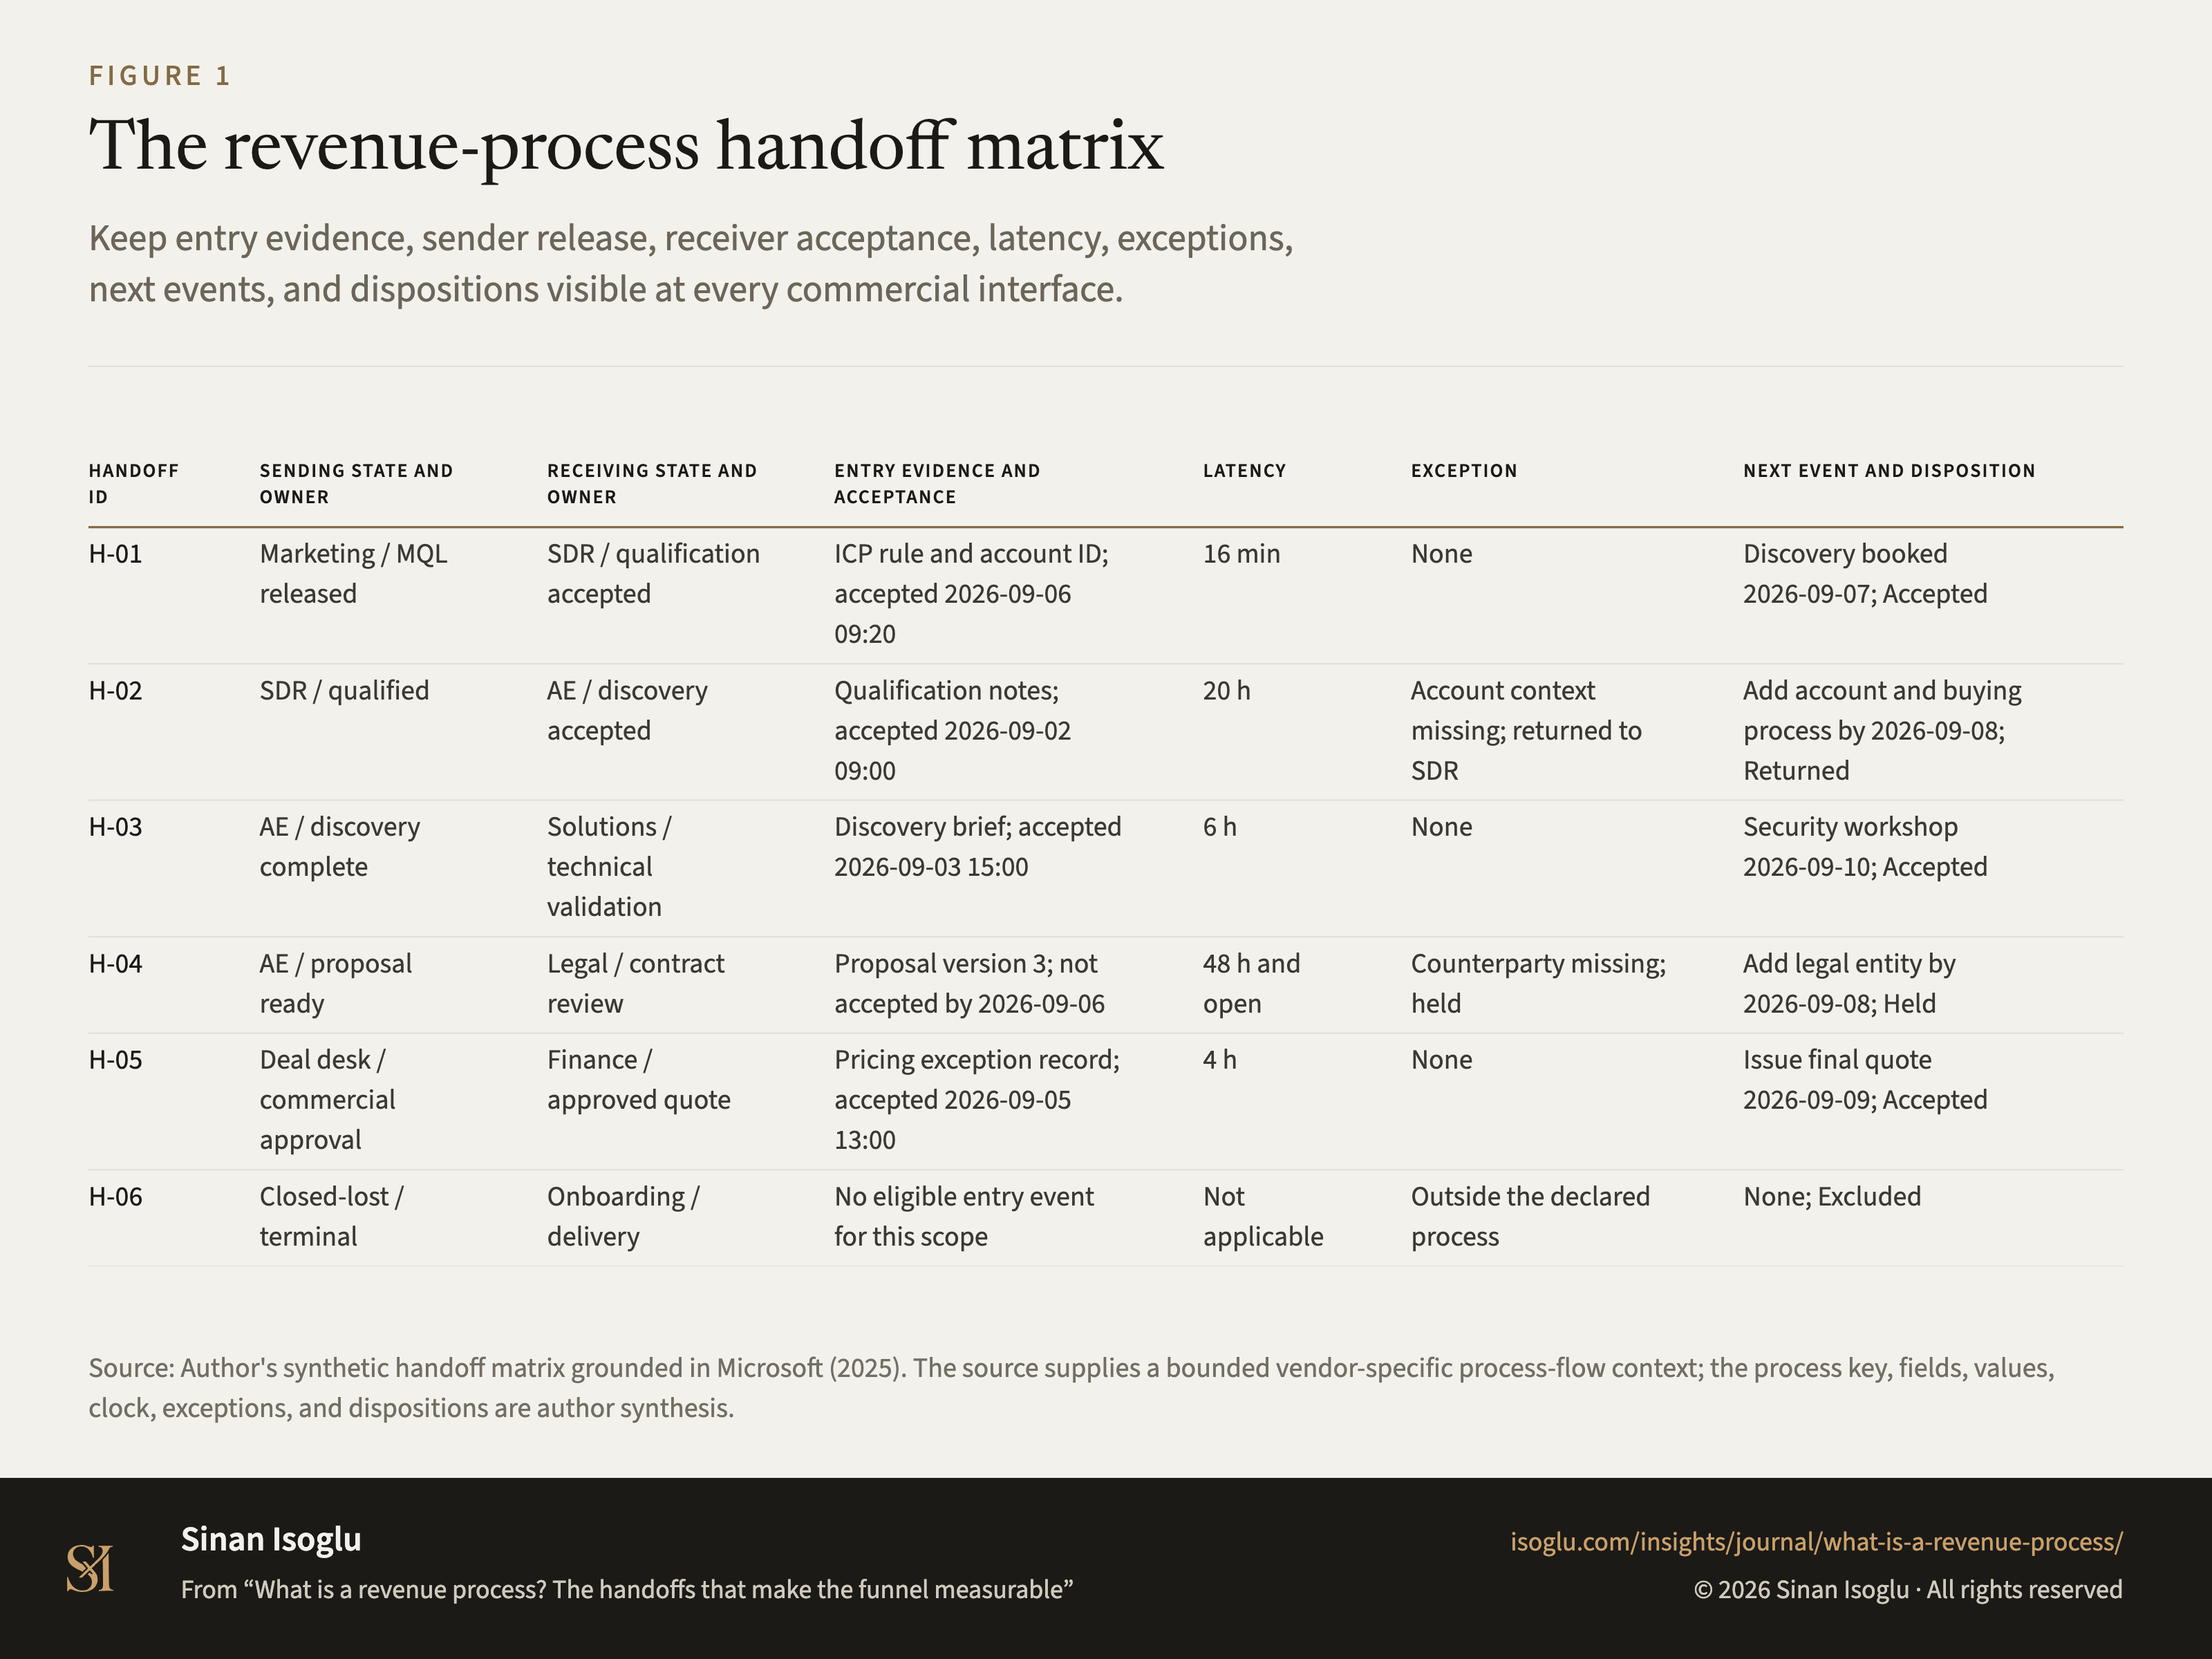
Abbildung 1Grafik
Die Übergabematrix für den Revenue-Prozess
Was ist ein Revenue-Prozess? Die Übergaben, die den Funnel messbar machen
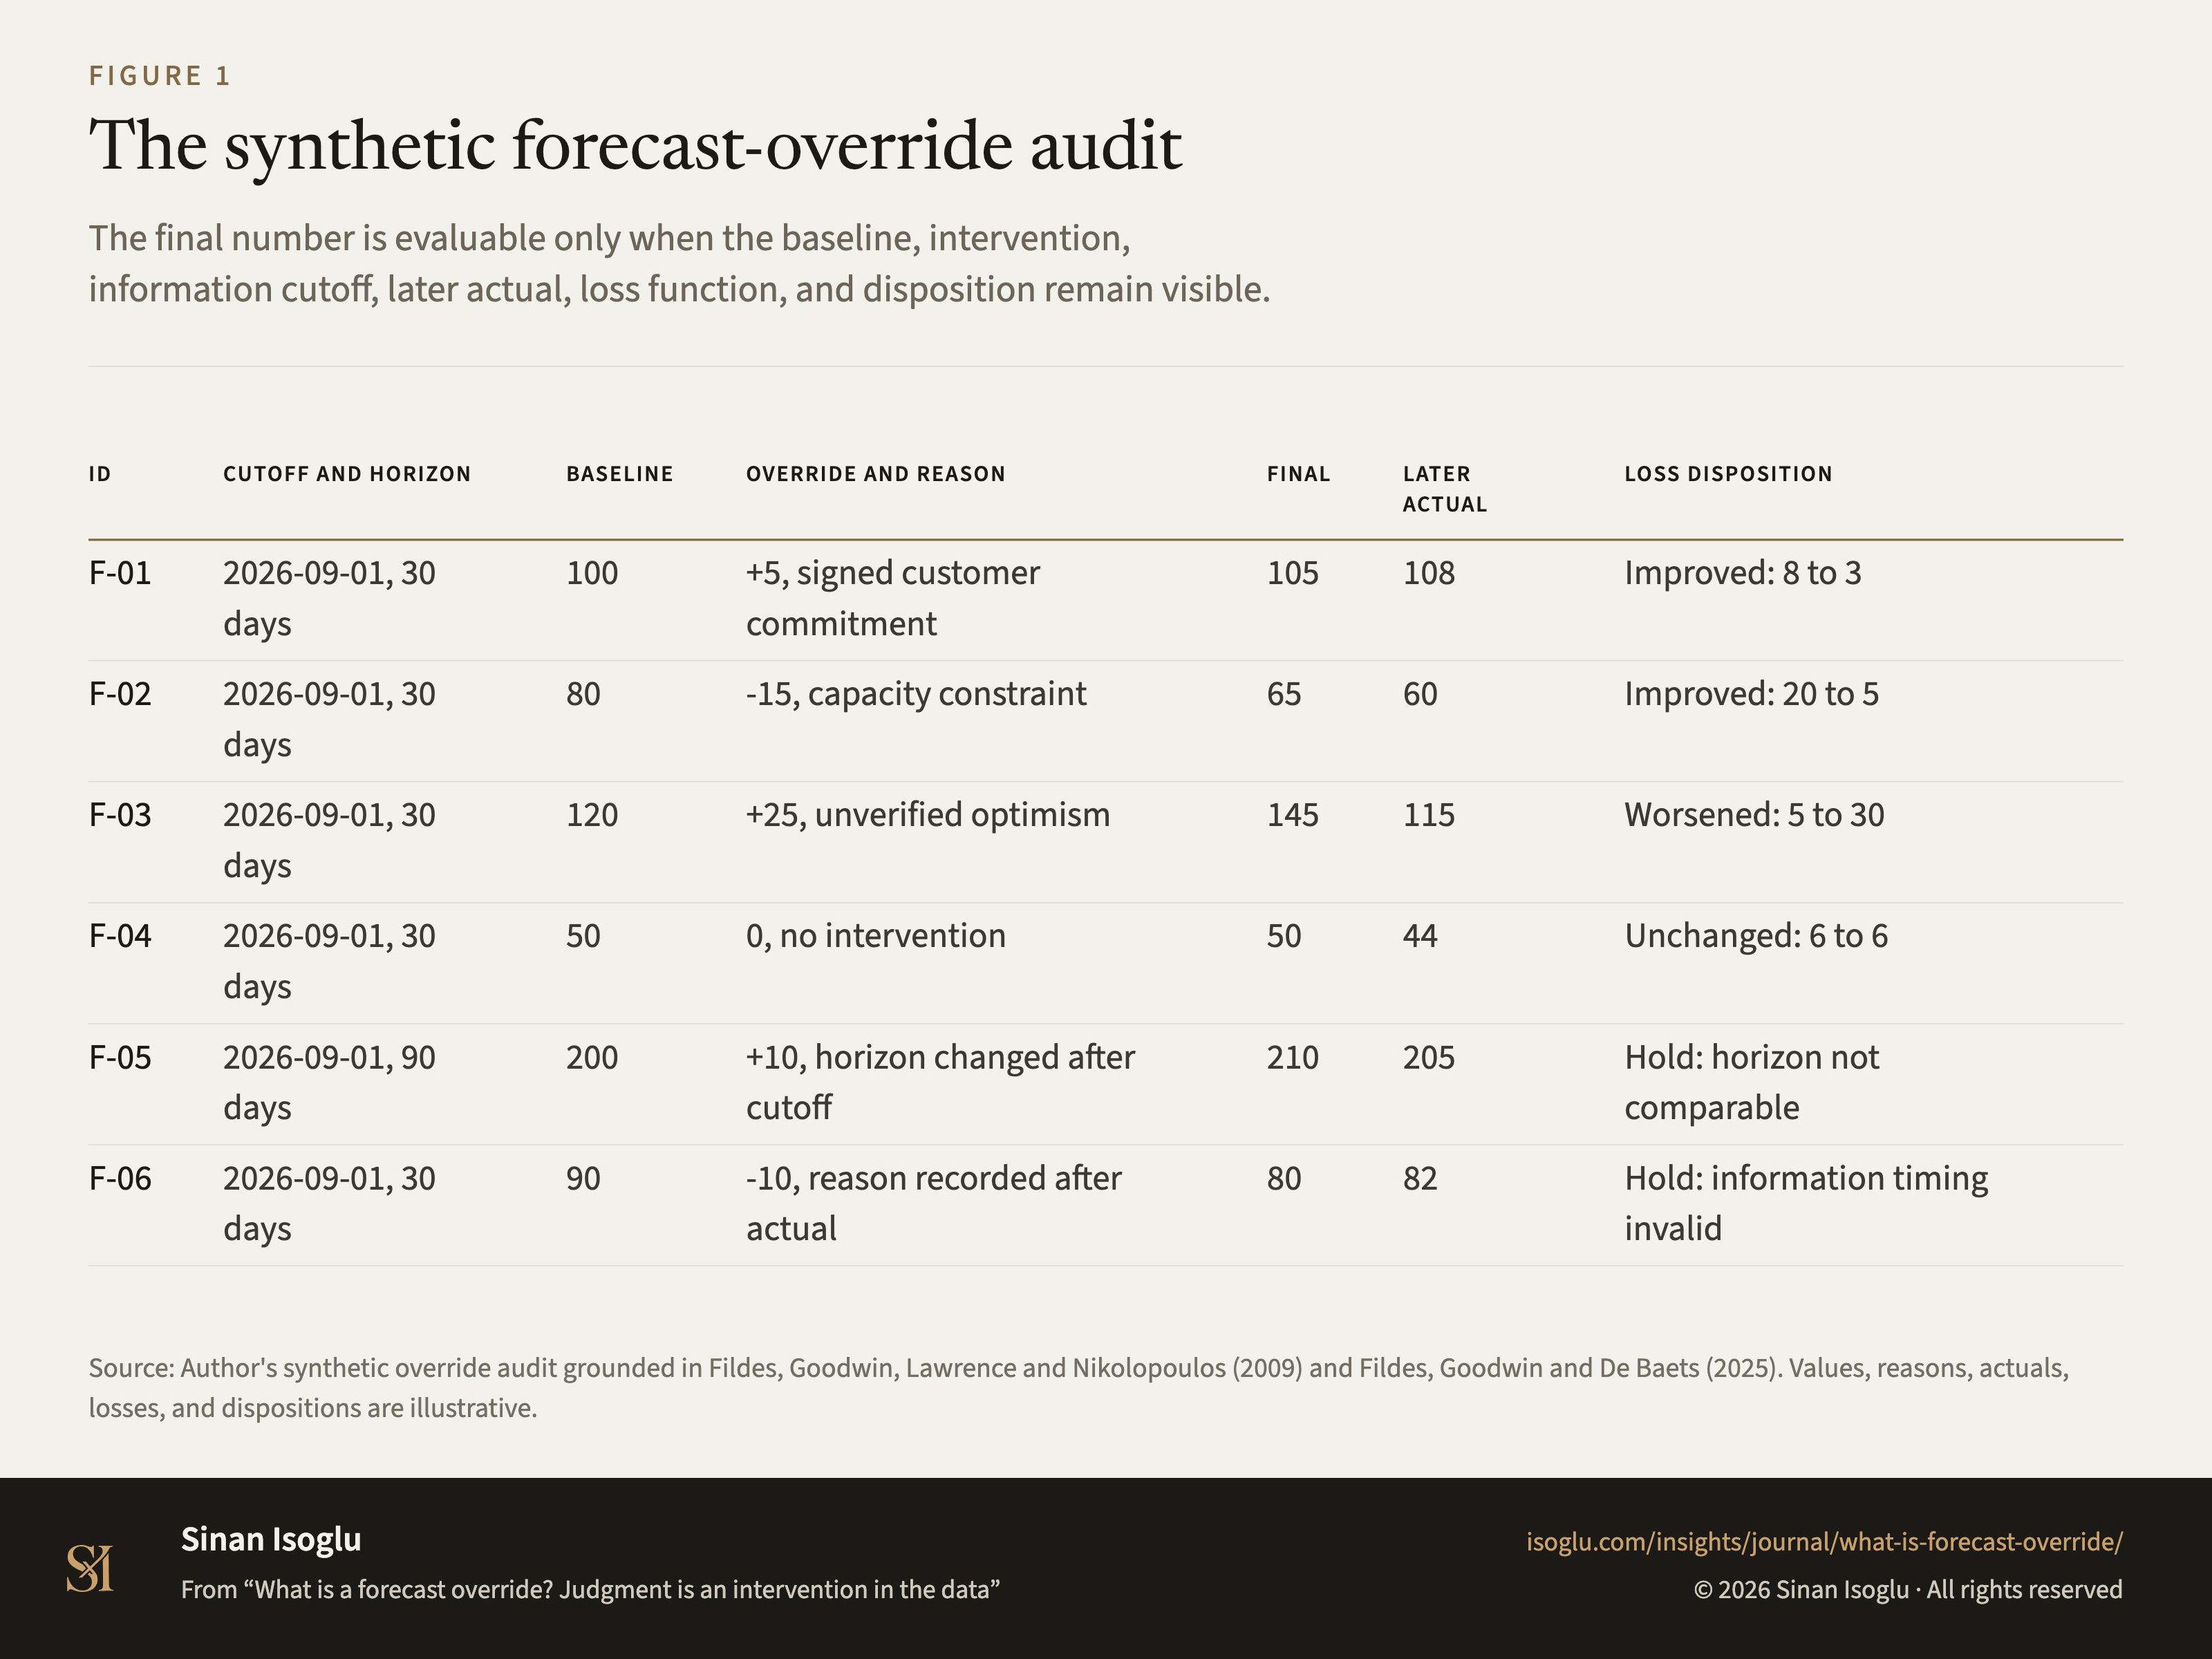
Abbildung 1Grafik
Das synthetische Forecast-Override-Prüfregister
Was ist ein Forecast-Override? Urteil ist ein Eingriff in die Daten
Kontakt
Schicken Sie die Frage, an der Sie arbeiten.
Forschung, ein Gastvortrag oder eine Frage aus der Praxis.