Figure 2From “What is propensity score matching?”
A matched-estimate record
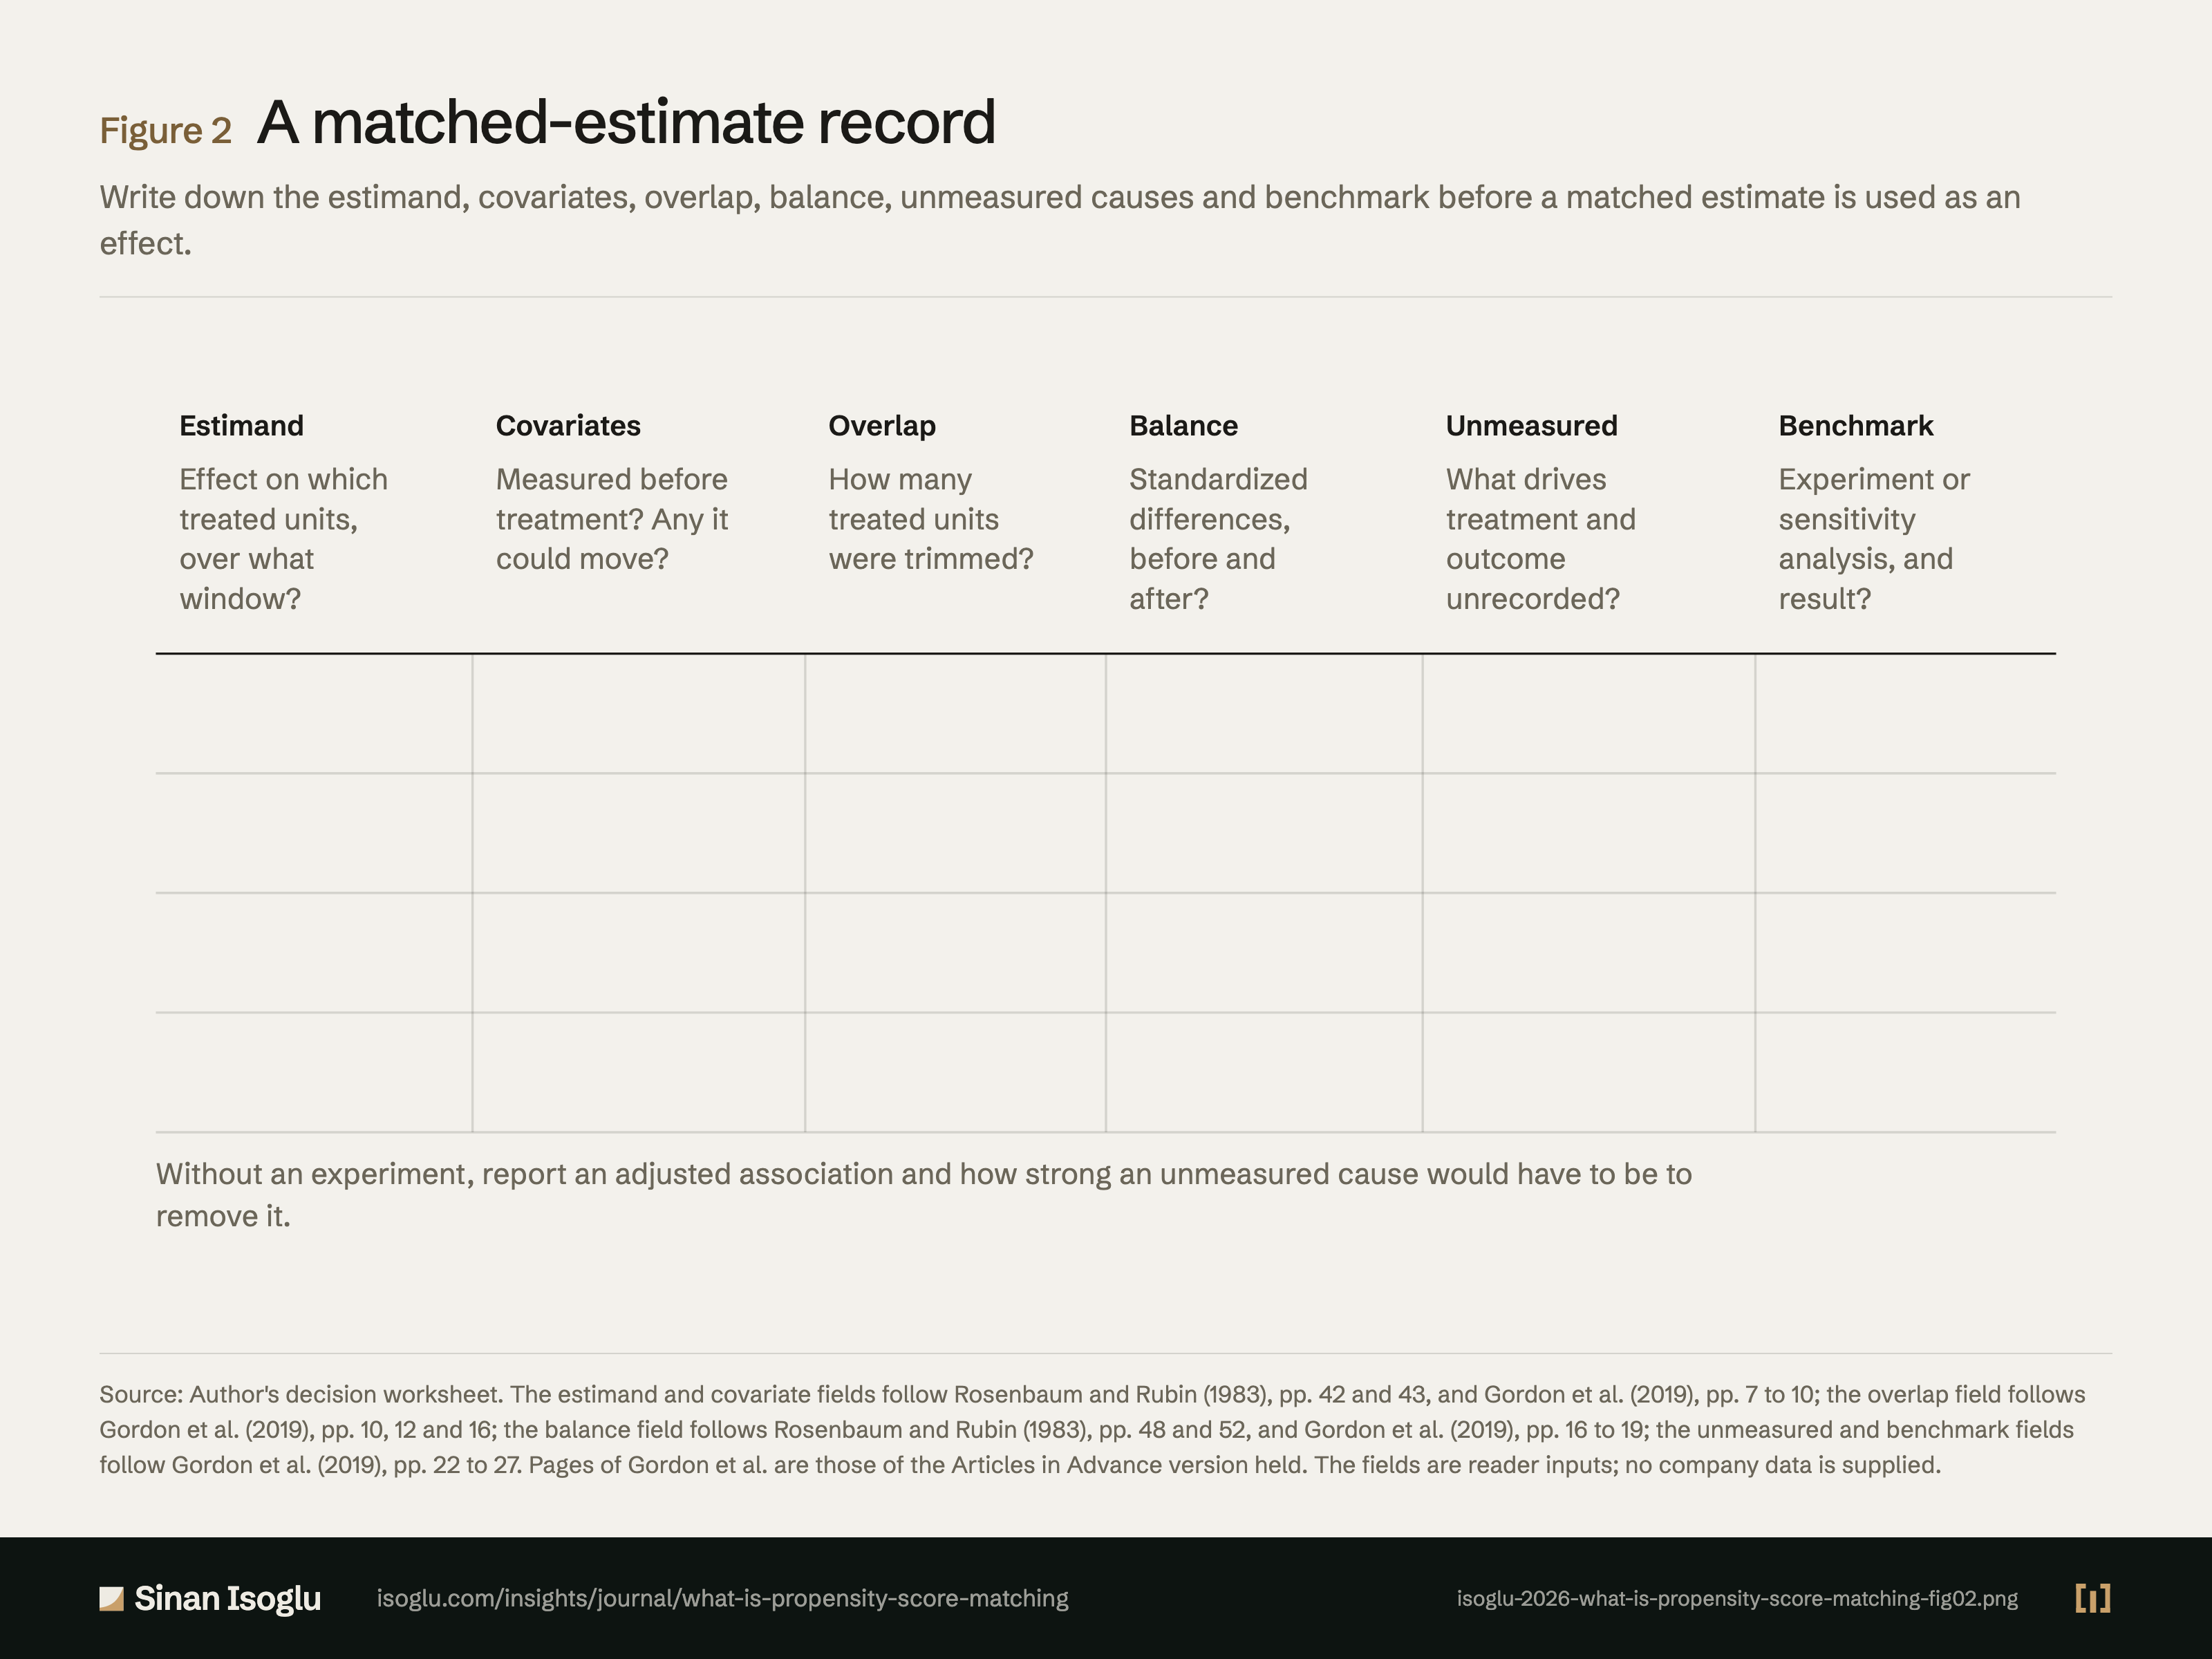
Write down the estimand, covariates, overlap, balance, unmeasured causes and benchmark before a matched estimate is used as an effect.
Figure 2A matched-estimate record
Source: Author's decision worksheet. The estimand and covariate fields follow Rosenbaum and Rubin (1983), pp. 42 and 43, and Gordon et al. (2019), pp. 7 to 10; the overlap field follows Gordon et al. (2019), pp. 10, 12 and 16; the balance field follows Rosenbaum and Rubin (1983), pp. 48 and 52, and Gordon et al. (2019), pp. 16 to 19; the unmeasured and benchmark fields follow Gordon et al. (2019), pp. 22 to 27. Pages of Gordon et al. are those of the Articles in Advance version held. The fields are reader inputs; no company data is supplied.
Source and evidence
Each line names a claim related to this exhibit, its source, and how it was checked.
- B PSM-OWN-C3 A matched estimate is written down as one record: estimand and window, covariates measured before treatment, overlap and what trimming removed, balance on every covariate before and after, unmeasured causes, and the benchmark (an experiment or, failing one, a sensitivity analysis of how strong an unmeasured cause would have to be); without an experiment the record reports an adjusted association and that strength, never an effect; illustrated with a hypothetical B2B software firm's customer webinar series and expansion revenue, with an upgrade evaluation as the unmeasured cause and a holdout of invitations by lot for two quarters with a baseline quarter, provided uninvited accounts cannot attend, converted to the effect on attenders by the share attending as Gordon et al. did, which needs an argument that an invitation without attendance leaves expansion unchanged, since an invitation is itself a message to the account, or else the intention-to-treat effect is reported on its own (revised at G5 2026-10-15); untested.Author worksheet grounded in RR83-C4, RR83-C8, GZBC19-C1, GZBC19-C8, GZBC19-C9, GZBC19-C10 and GZBC19-C14
Grades: A, verified against the printed page of the primary source · B, primary source, text layer only · C, authoritative secondary · D, reported.
From the essay
From the research bench
What is propensity score matching?
Propensity score matching compares treated units with untreated ones that had a similar estimated chance of treatment. It balances only what was measured.
Read the essayThis exhibit belongs to an essay: the numbers live here, the argument lives there.
Cite or embed
Related exhibits
Contact
Bring the question you're working on.
Research, a guest lecture, or a commercial question.