Abbildung 2Aus „Was ist Propensity-Score-Matching?“
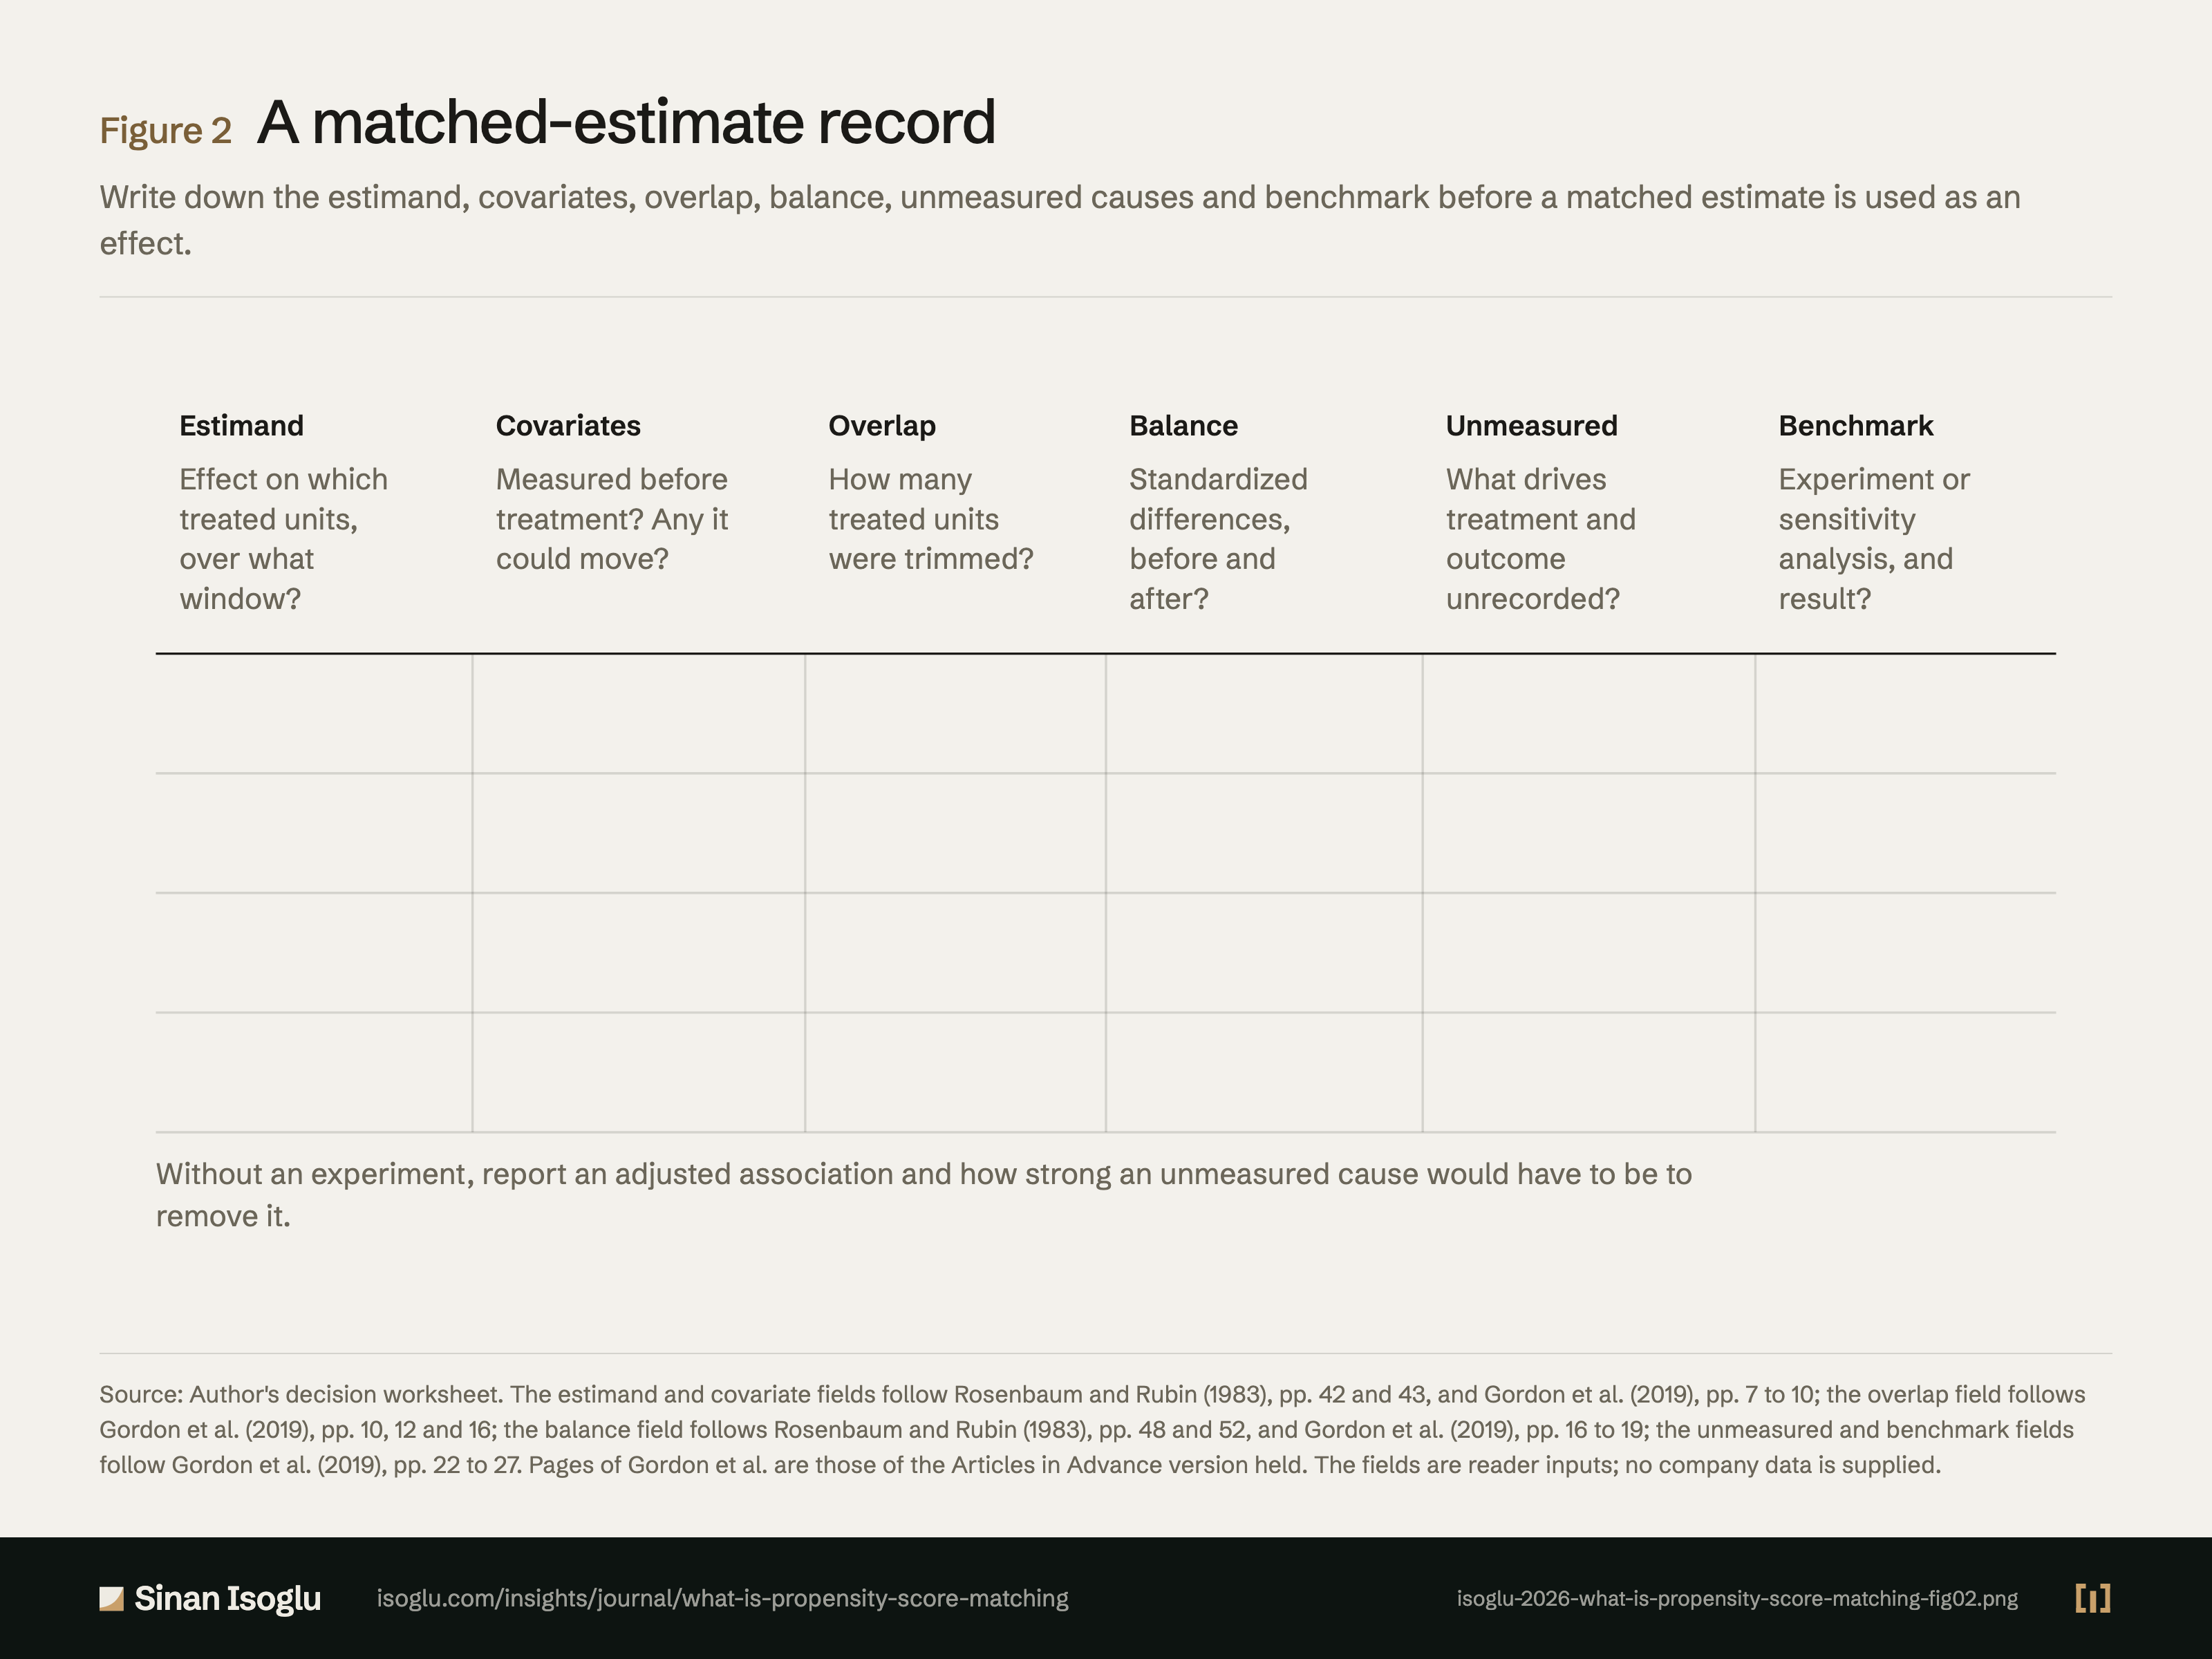
Ein Blatt für eine Schätzung aus dem Matching
Estimand, Kovariaten, Überlappung, Balance, nicht erfasste Ursachen und Maßstab festhalten, bevor eine Schätzung aus dem Matching als Effekt gilt.
Abbildung 2Ein Blatt für eine Schätzung aus dem Matching
Quelle: Entscheidungsblatt des Autors. Die Felder für Estimand und Kovariaten folgen Rosenbaum und Rubin (1983), S. 42 und 43, und Gordon et al. (2019), S. 7 bis 10; das Feld für die Überlappung folgt Gordon et al. (2019), S. 10, 12 und 16; das Feld für die Balance folgt Rosenbaum und Rubin (1983), S. 48 und 52, und Gordon et al. (2019), S. 16 bis 19; die Felder für nicht erfasste Ursachen und den Maßstab folgen Gordon et al. (2019), S. 22 bis 27. Die Seiten von Gordon et al. sind die der vorliegenden Articles-in-Advance-Fassung. Die Felder sind Eingaben der Lesenden; es werden keine Unternehmensdaten geliefert.
Quelle und Evidenz
Jede Zeile nennt eine Aussage zu dieser Abbildung, ihre Quelle und die Art ihrer Prüfung.
- B PSM-OWN-C3 A matched estimate is written down as one record: estimand and window, covariates measured before treatment, overlap and what trimming removed, balance on every covariate before and after, unmeasured causes, and the benchmark (an experiment or, failing one, a sensitivity analysis of how strong an unmeasured cause would have to be); without an experiment the record reports an adjusted association and that strength, never an effect; illustrated with a hypothetical B2B software firm's customer webinar series and expansion revenue, with an upgrade evaluation as the unmeasured cause and a holdout of invitations by lot for two quarters with a baseline quarter, provided uninvited accounts cannot attend, converted to the effect on attenders by the share attending as Gordon et al. did, which needs an argument that an invitation without attendance leaves expansion unchanged, since an invitation is itself a message to the account, or else the intention-to-treat effect is reported on its own (revised at G5 2026-10-15); untested.Author worksheet grounded in RR83-C4, RR83-C8, GZBC19-C1, GZBC19-C8, GZBC19-C9, GZBC19-C10 and GZBC19-C14
Prüfgrade: A, gegen die gedruckte Seite der Primärquelle geprüft · B, Primärquelle, nur Textebene · C, belastbare Sekundärquelle · D, berichtet.
Aus dem Beitrag
Aus der Forschung
Was ist Propensity-Score-Matching?
Propensity-Score-Matching vergleicht Behandelte mit Unbehandelten, die eine ähnliche geschätzte Behandlungschance hatten. Es gleicht nur Gemessenes aus.
Den Beitrag lesenDiese Abbildung gehört zu einem Essay: Die Zahlen stehen hier, das Argument dort.
Zitieren oder einbetten
Verwandte Abbildungen
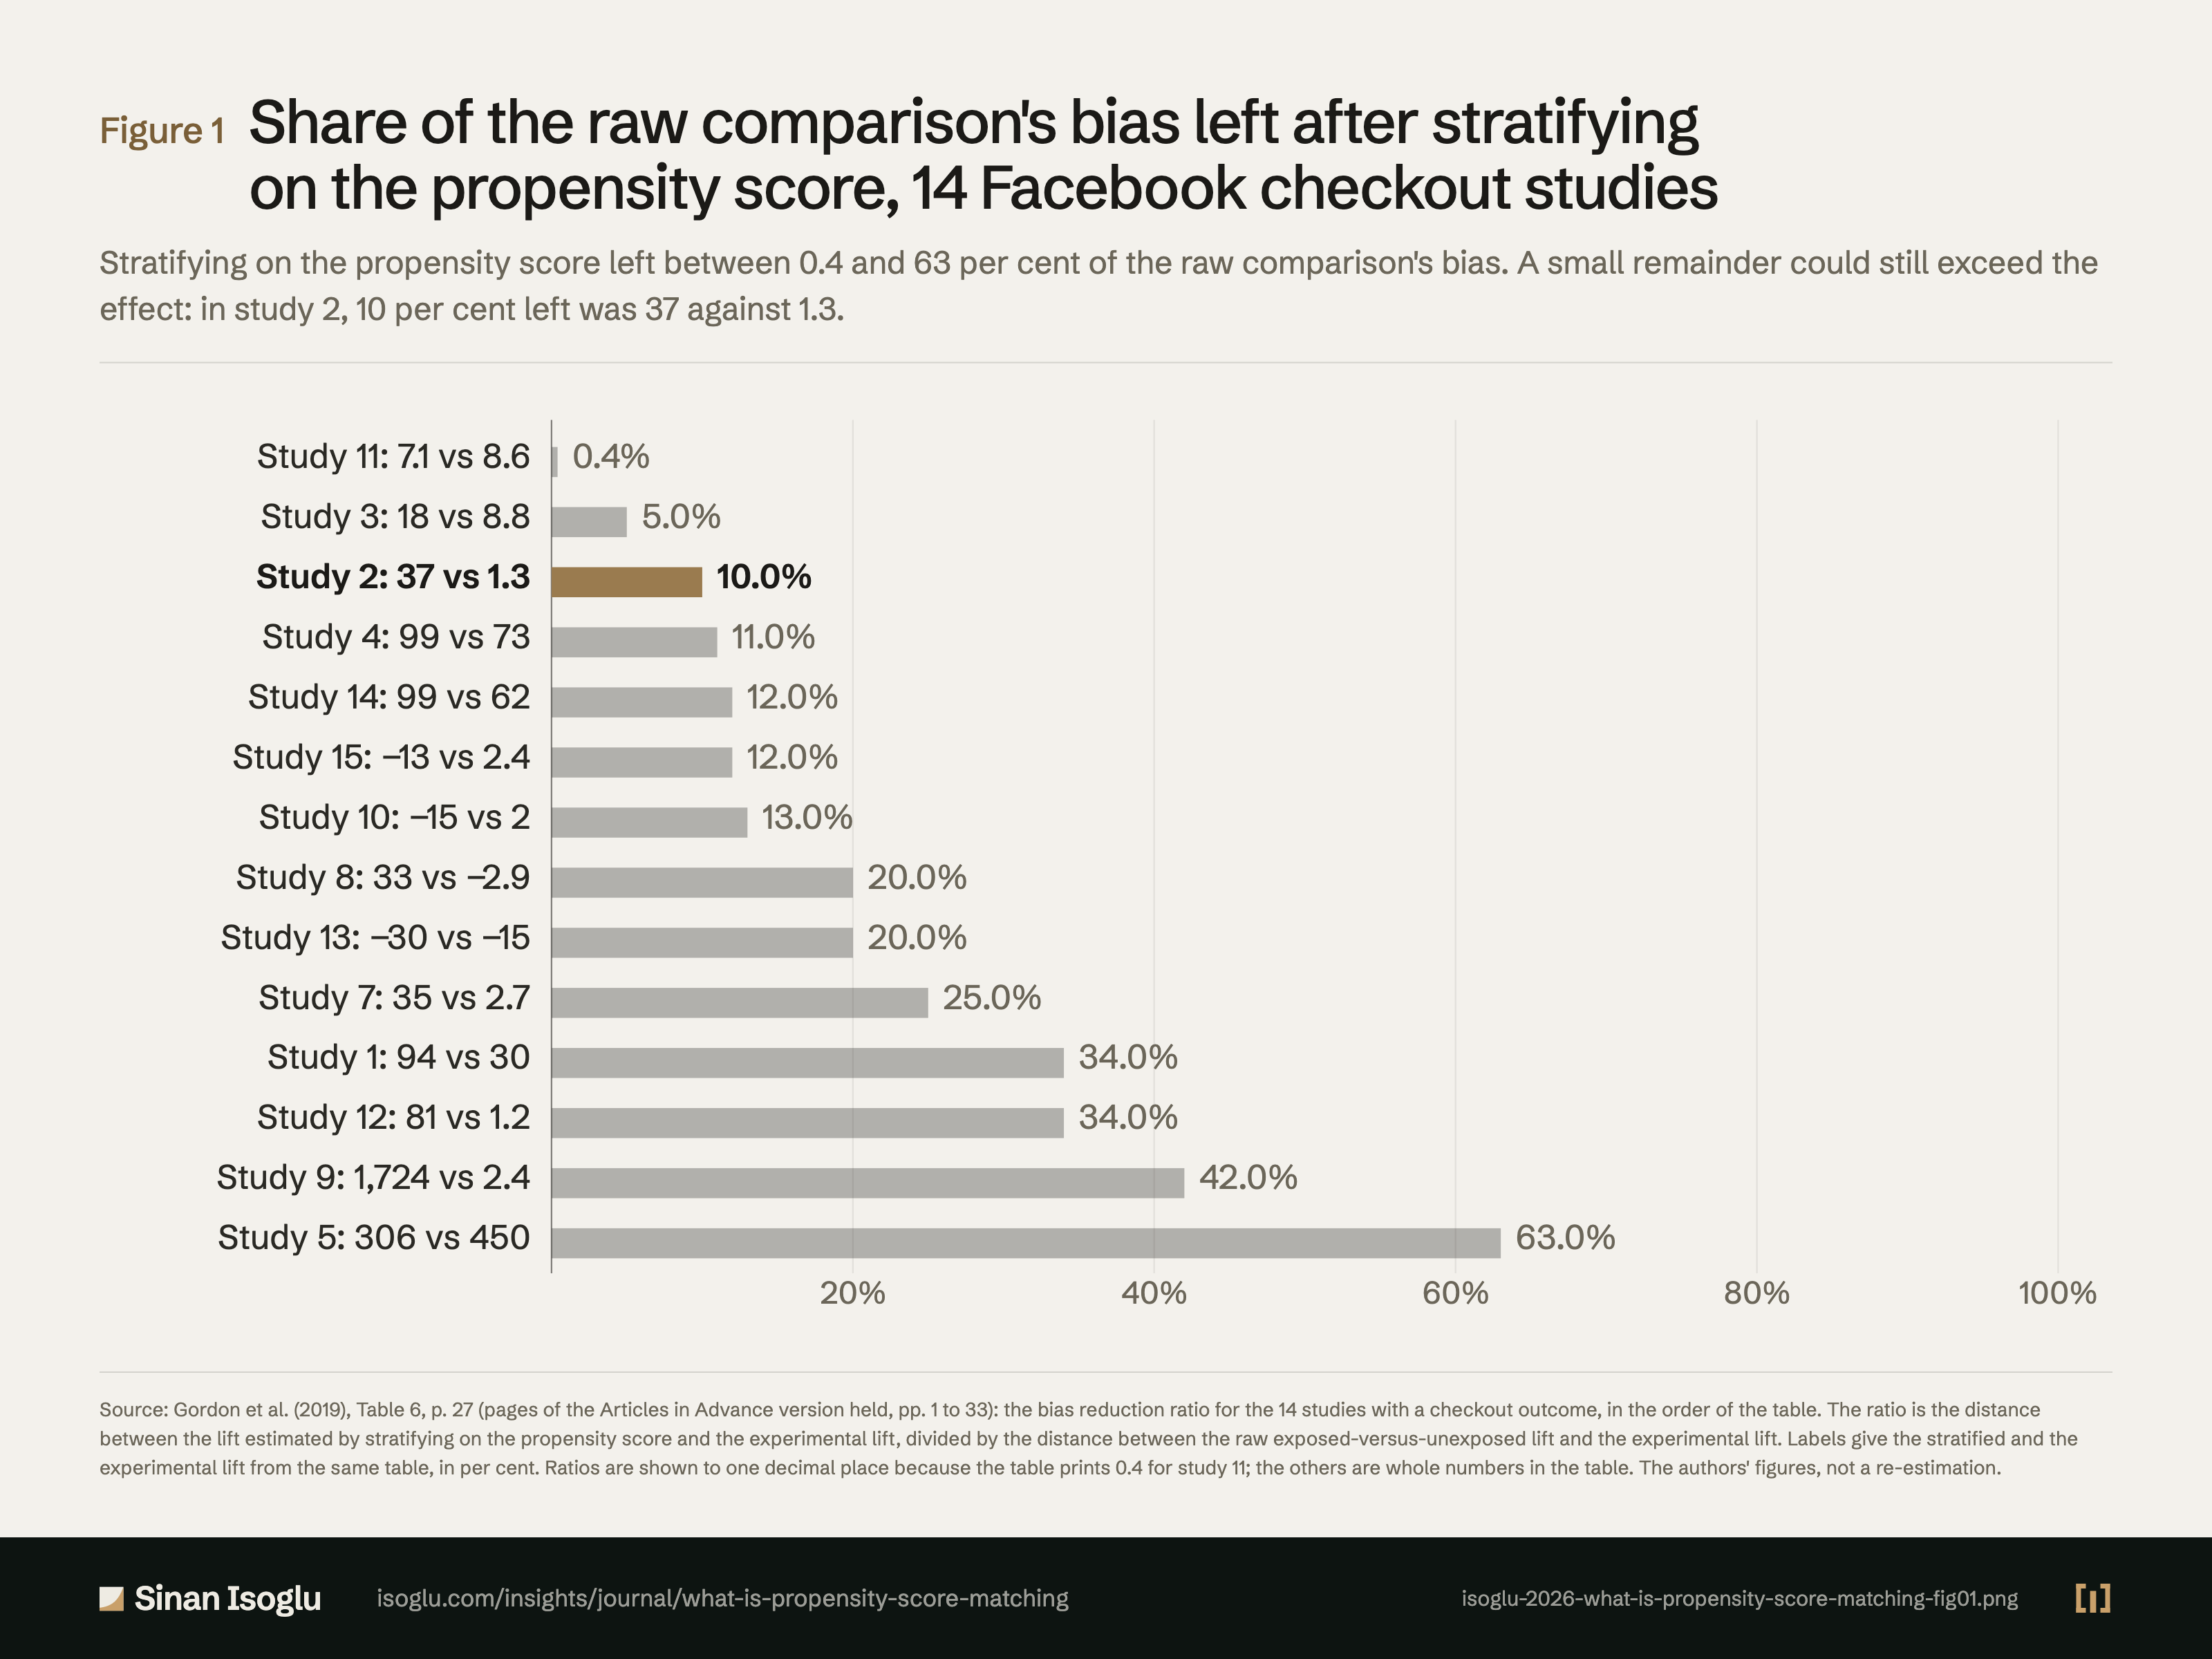
Abbildung 1Grafik
Anteil der Verzerrung des rohen Vergleichs nach der Stratifizierung auf dem Propensity Score, 14 Facebook-Studien mit Kauf als Conversion
Was ist Propensity-Score-Matching?
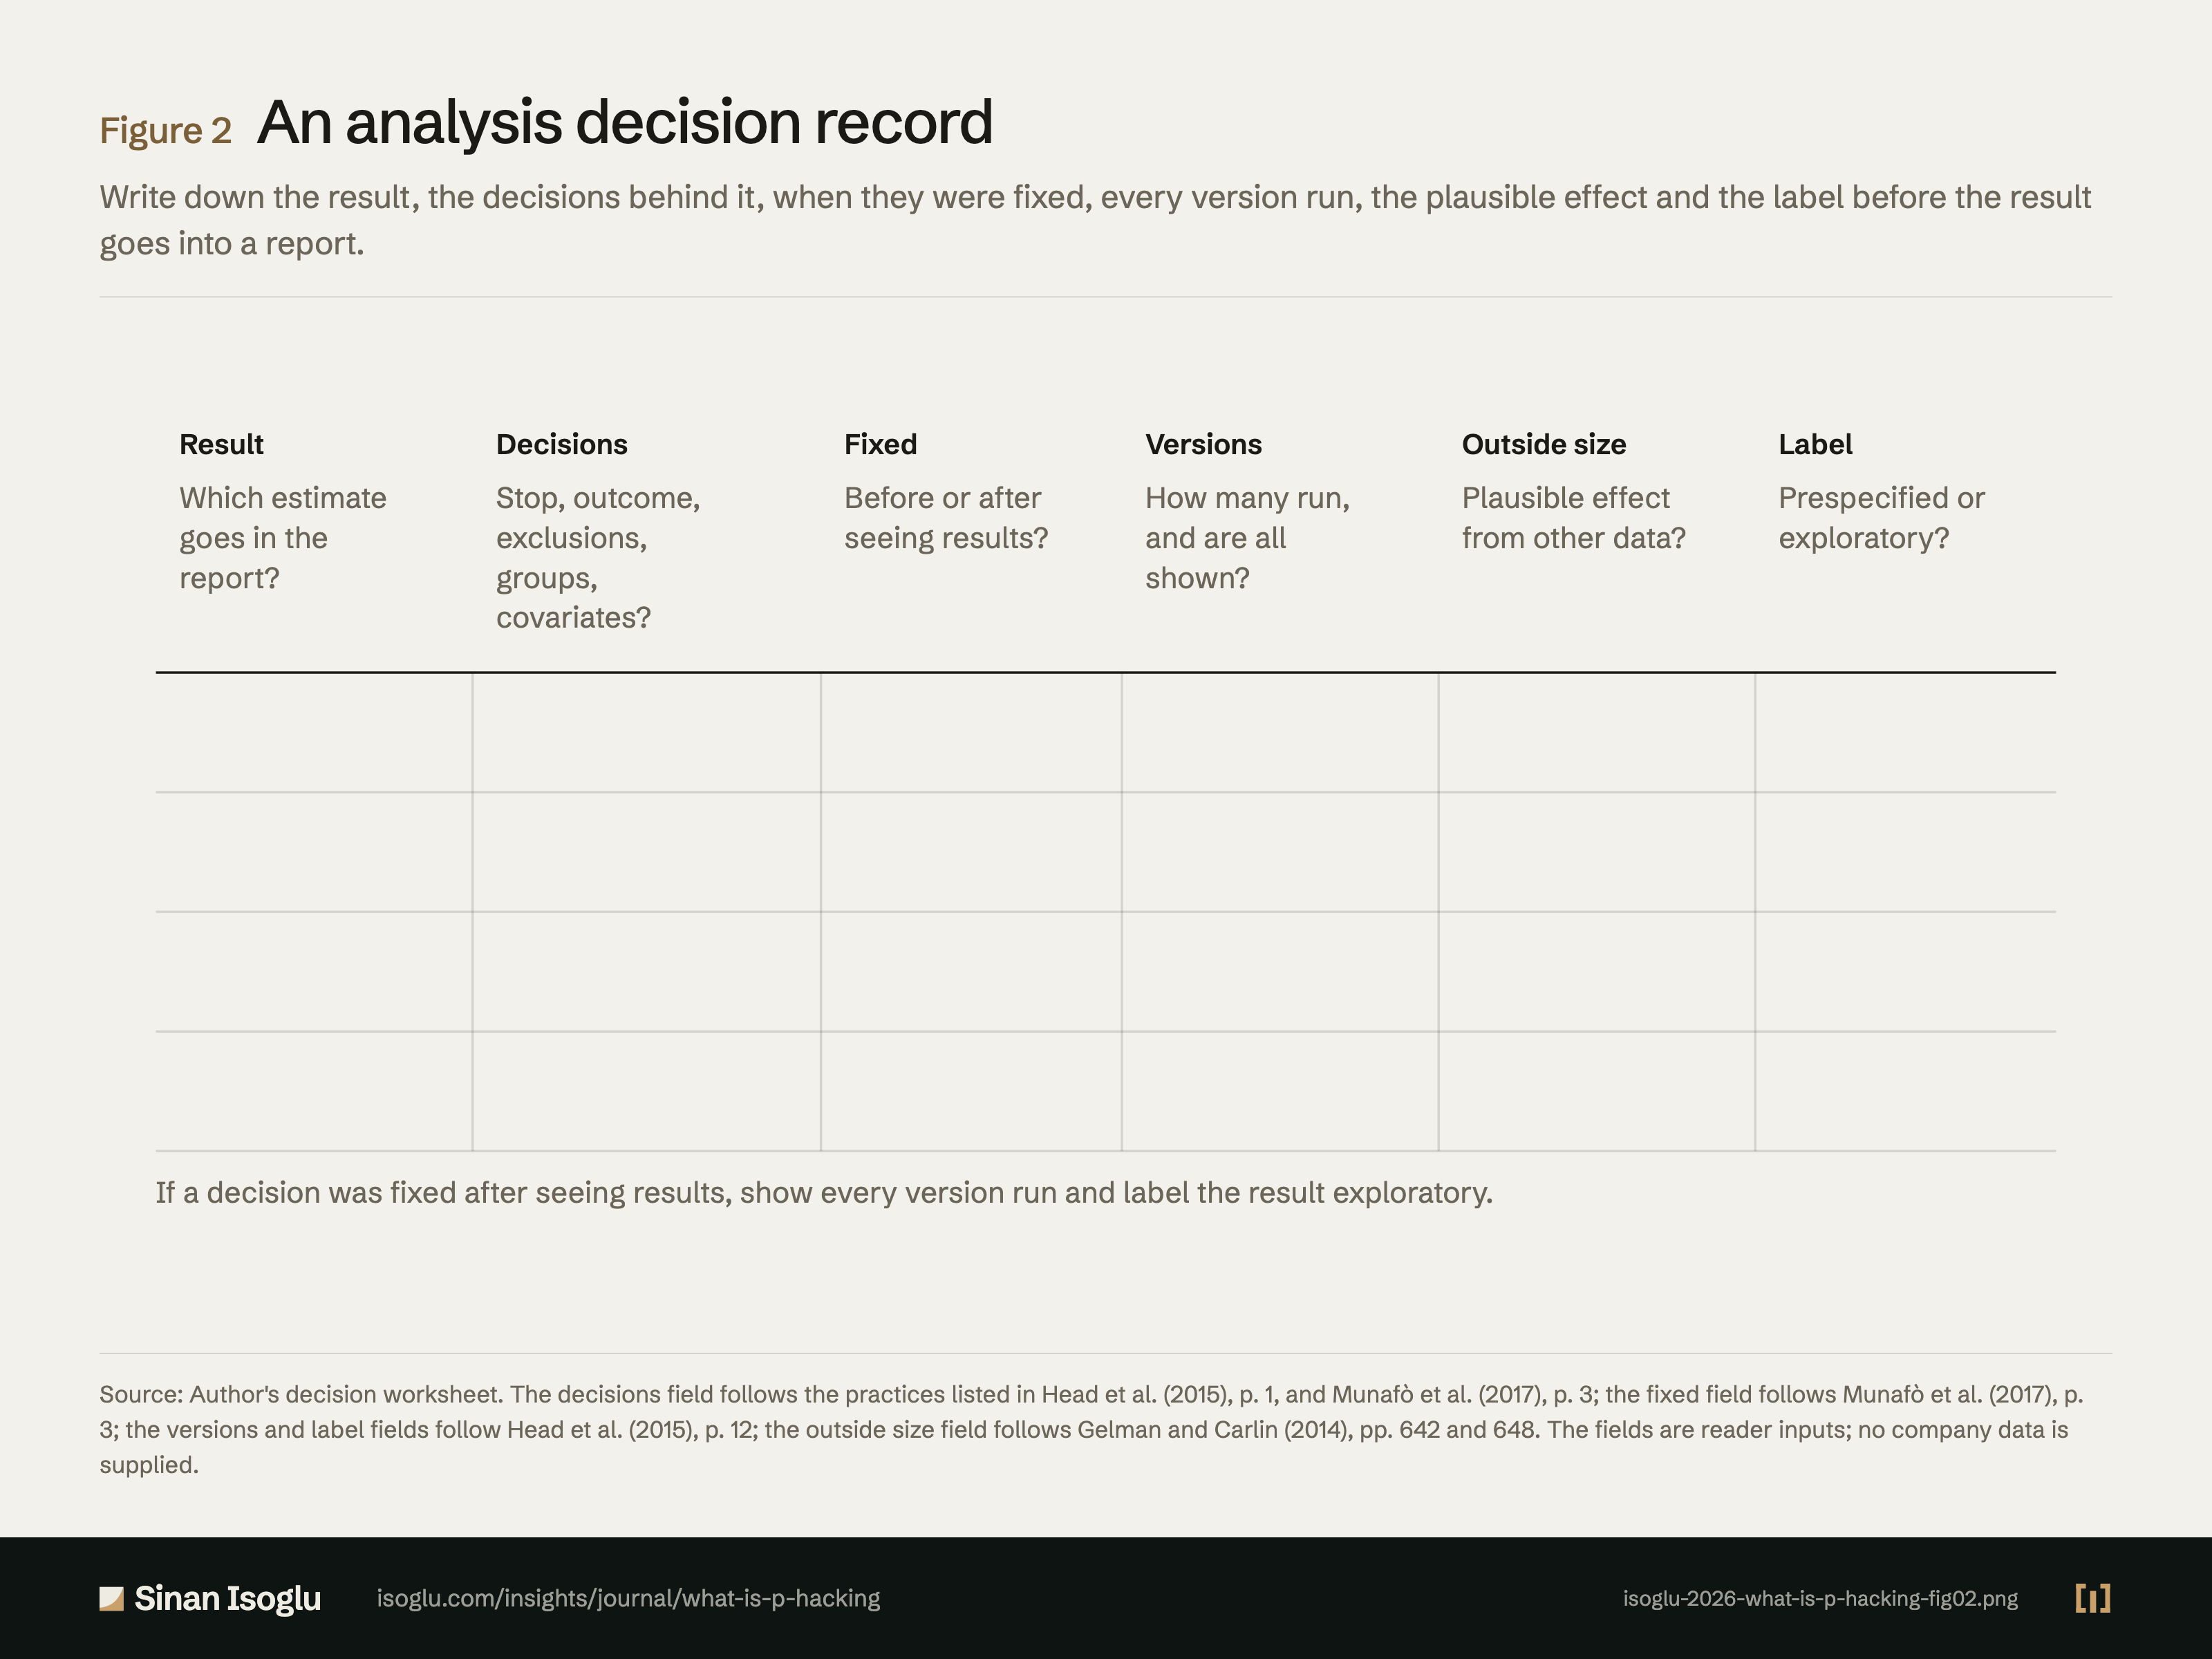
Abbildung 2Grafik
Ein Blatt für Analyseentscheidungen
Was ist P-Hacking?
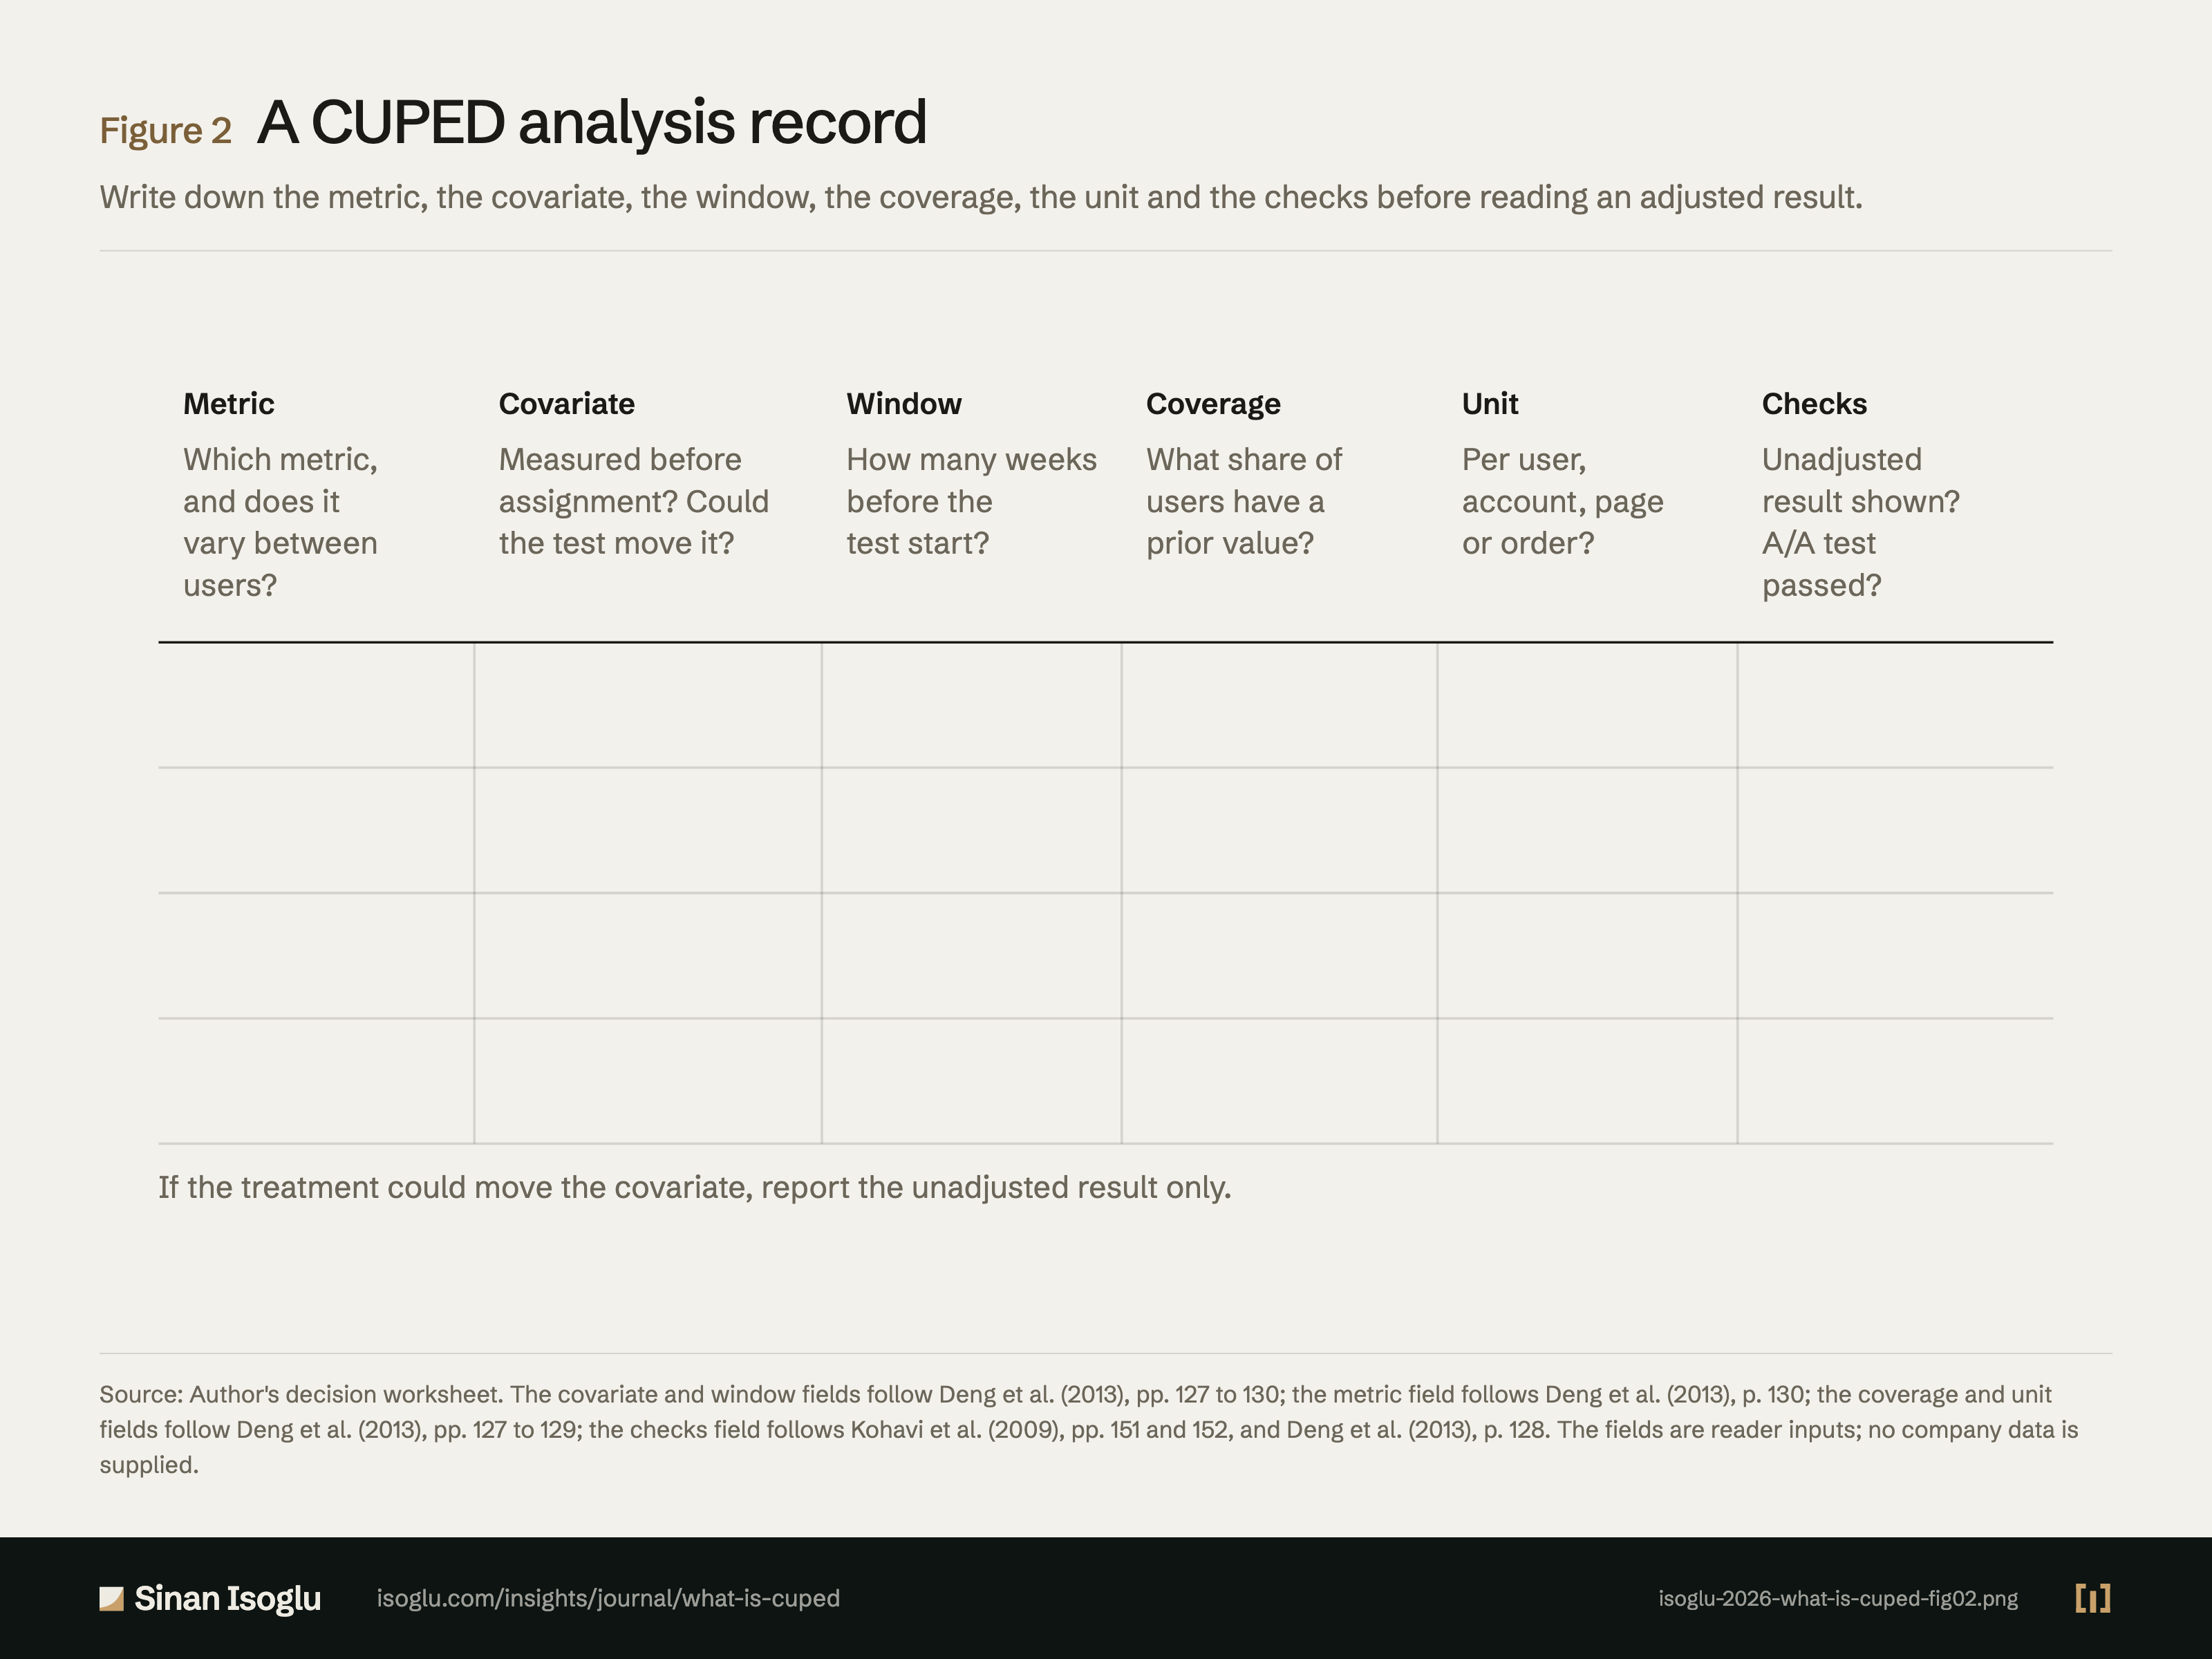
Abbildung 2Grafik
Ein Blatt für eine CUPED-Auswertung
Was ist CUPED?
Kontakt
Schicken Sie die Frage, an der Sie arbeiten.
Forschung, ein Gastvortrag oder eine Frage aus der Praxis.