← Every exhibit
Table 1From “What is incrementality?”
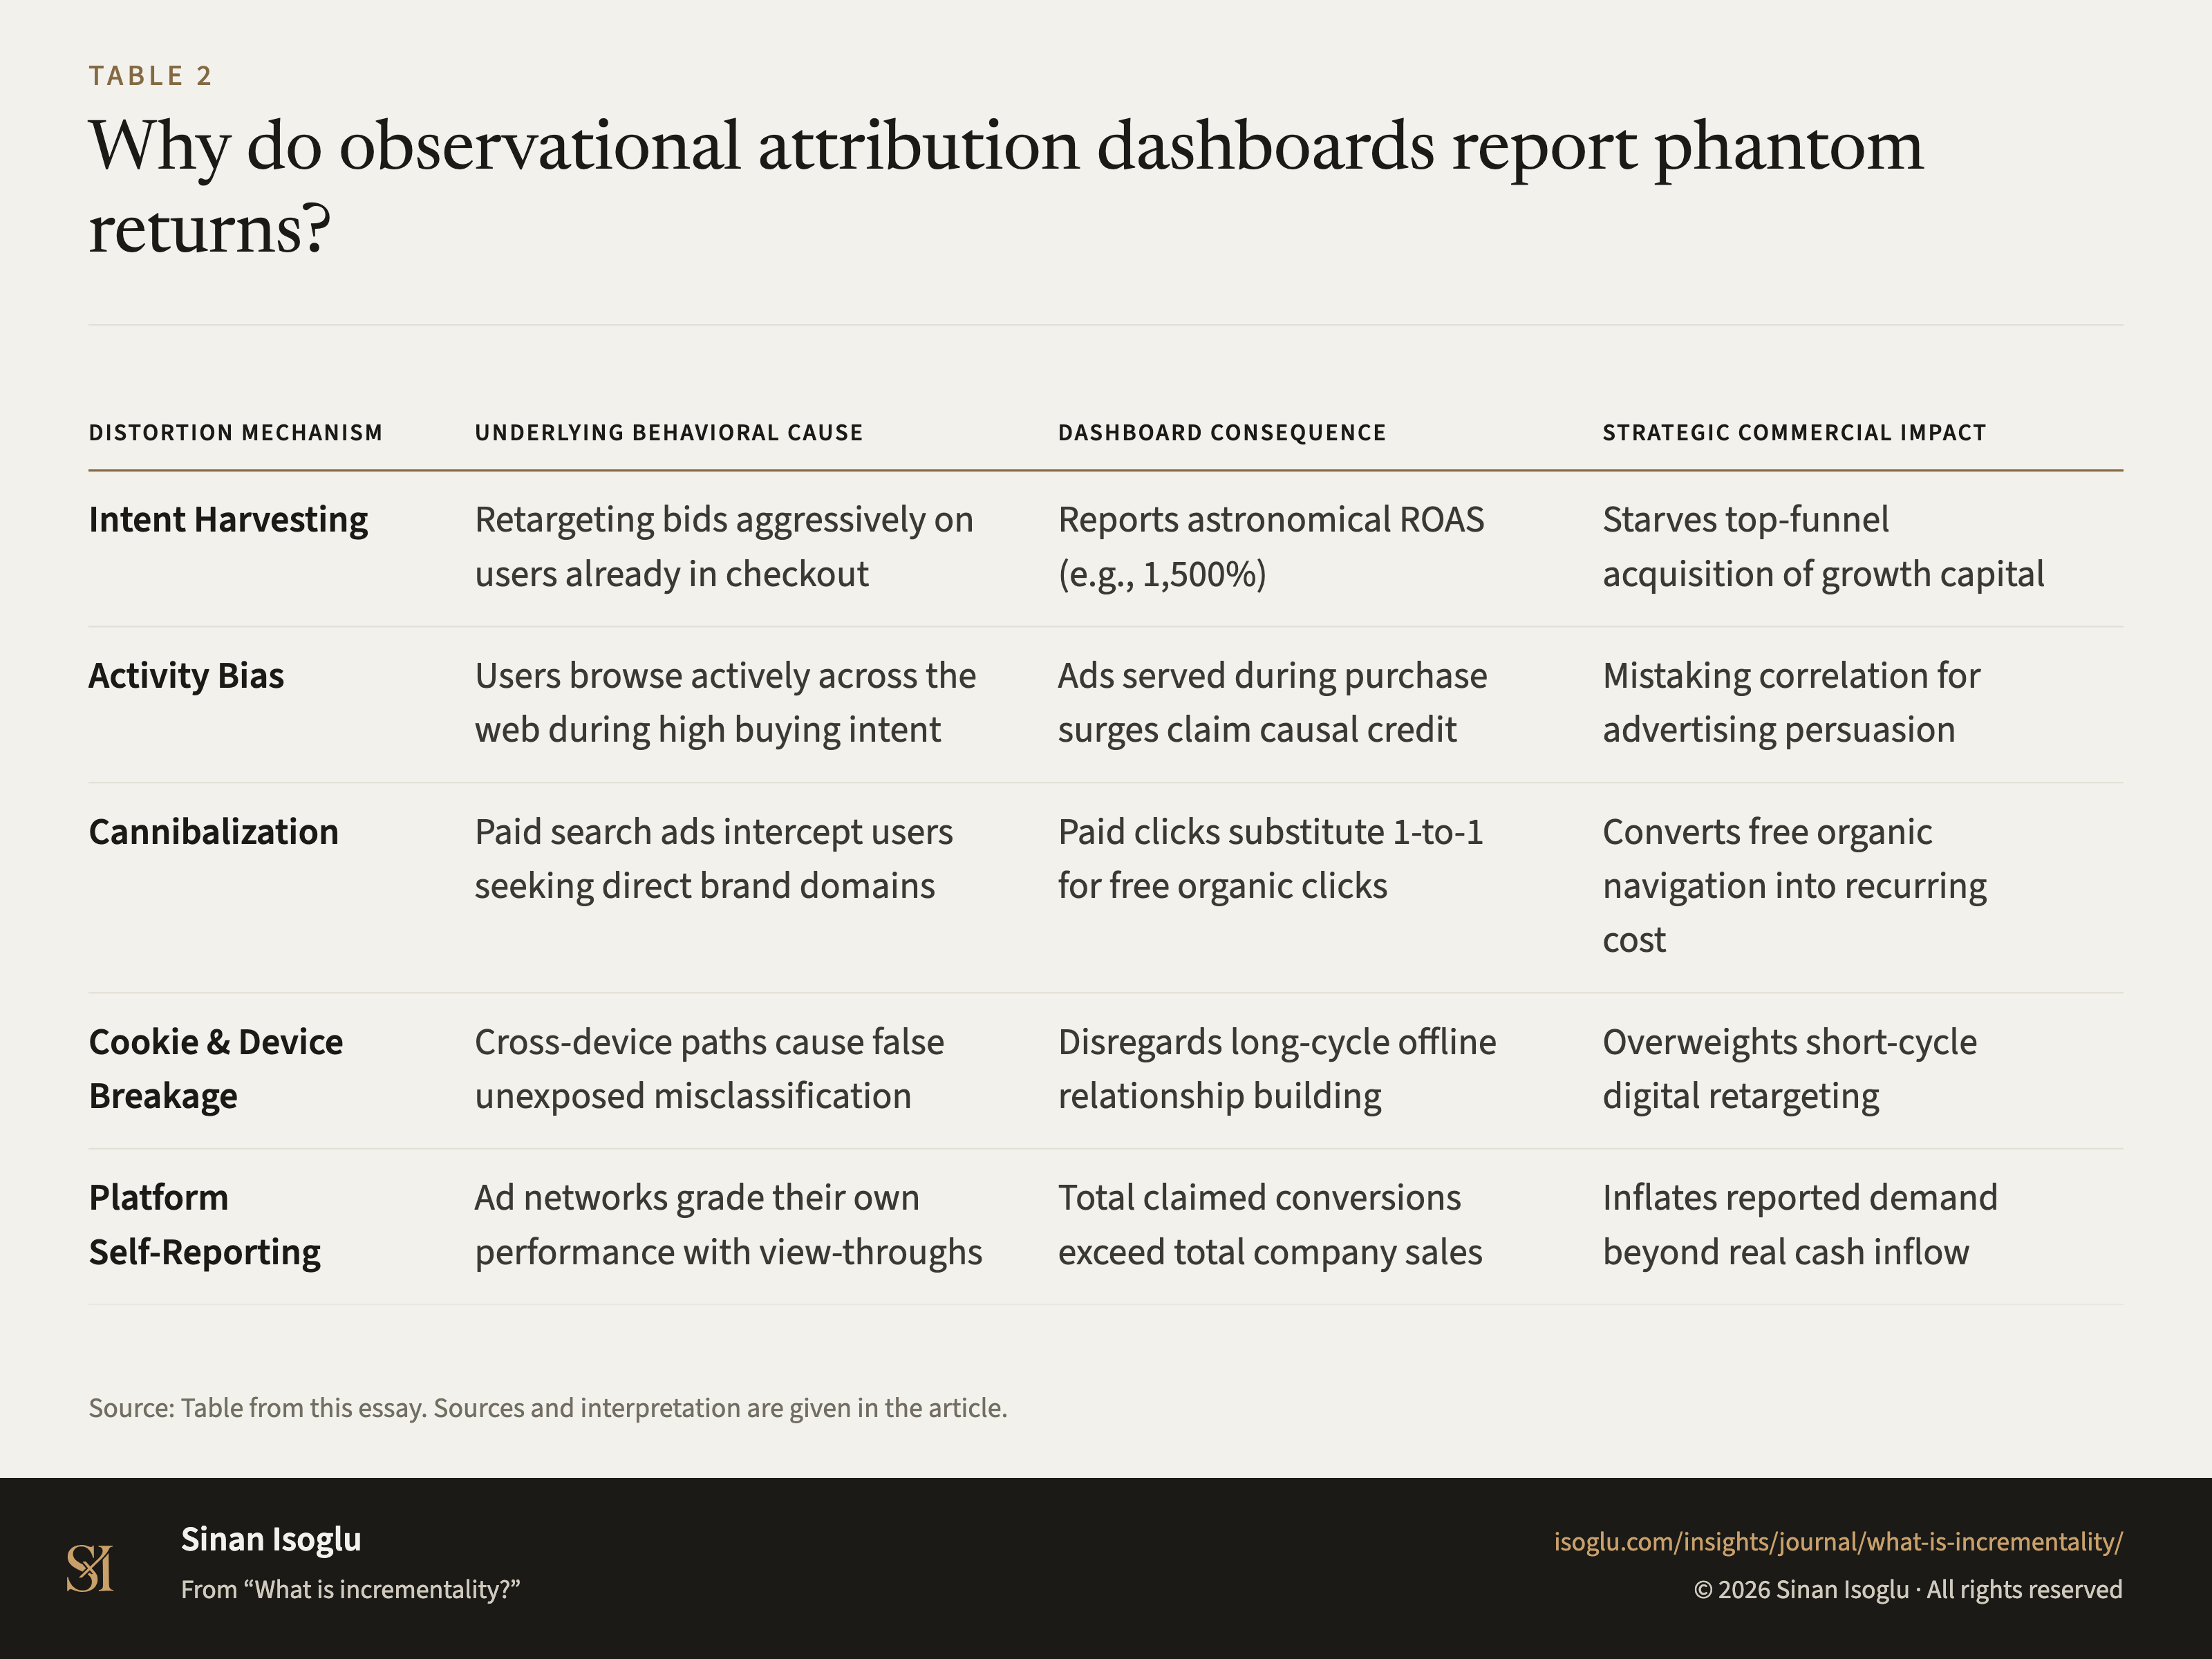
Why do observational attribution dashboards report phantom returns?
Table 1Why do observational attribution dashboards report phantom returns?
| Distortion mechanism | Underlying behavioral cause | Dashboard consequence | Strategic commercial impact |
|---|---|---|---|
| Intent Harvesting | Retargeting bids aggressively on users already in checkout | Reports astronomical ROAS (e.g., 1,500%) | Starves top-funnel acquisition of growth capital |
| Activity Bias | Users browse actively across the web during high buying intent | Ads served during purchase surges claim causal credit | Mistaking correlation for advertising persuasion |
| Cannibalization | Paid search ads intercept users seeking direct brand domains | Paid clicks substitute 1-to-1 for free organic clicks | Converts free organic navigation into recurring cost |
| Cookie & Device Breakage | Cross-device paths cause false unexposed misclassification | Disregards long-cycle offline relationship building | Overweights short-cycle digital retargeting |
| Platform Self-Reporting | Ad networks grade their own performance with view-throughs | Total claimed conversions exceed total company sales | Inflates reported demand beyond real cash inflow |
Swipe or scroll horizontally if the table is wider than your screen.
Source: Table from this essay. Sources and interpretation are given in the article.
PNG4:3, 1600 × 1200, with the title, the source line and the attribution set in the image isoglu-2026-what-is-incrementality-fig02.png
From the essay
From the research bench
What is incrementality?
Incrementality isolates the true causal revenue lift produced by commercial interventions relative to an unexposed counterfactual baseline.
Read the essayThis exhibit belongs to an essay: the numbers live here, the argument lives there.
Cite or embed

Contact
Bring the question you're working on.
Research, a guest lecture, or a commercial question.