Figure 1From “What is dynamic pricing?”
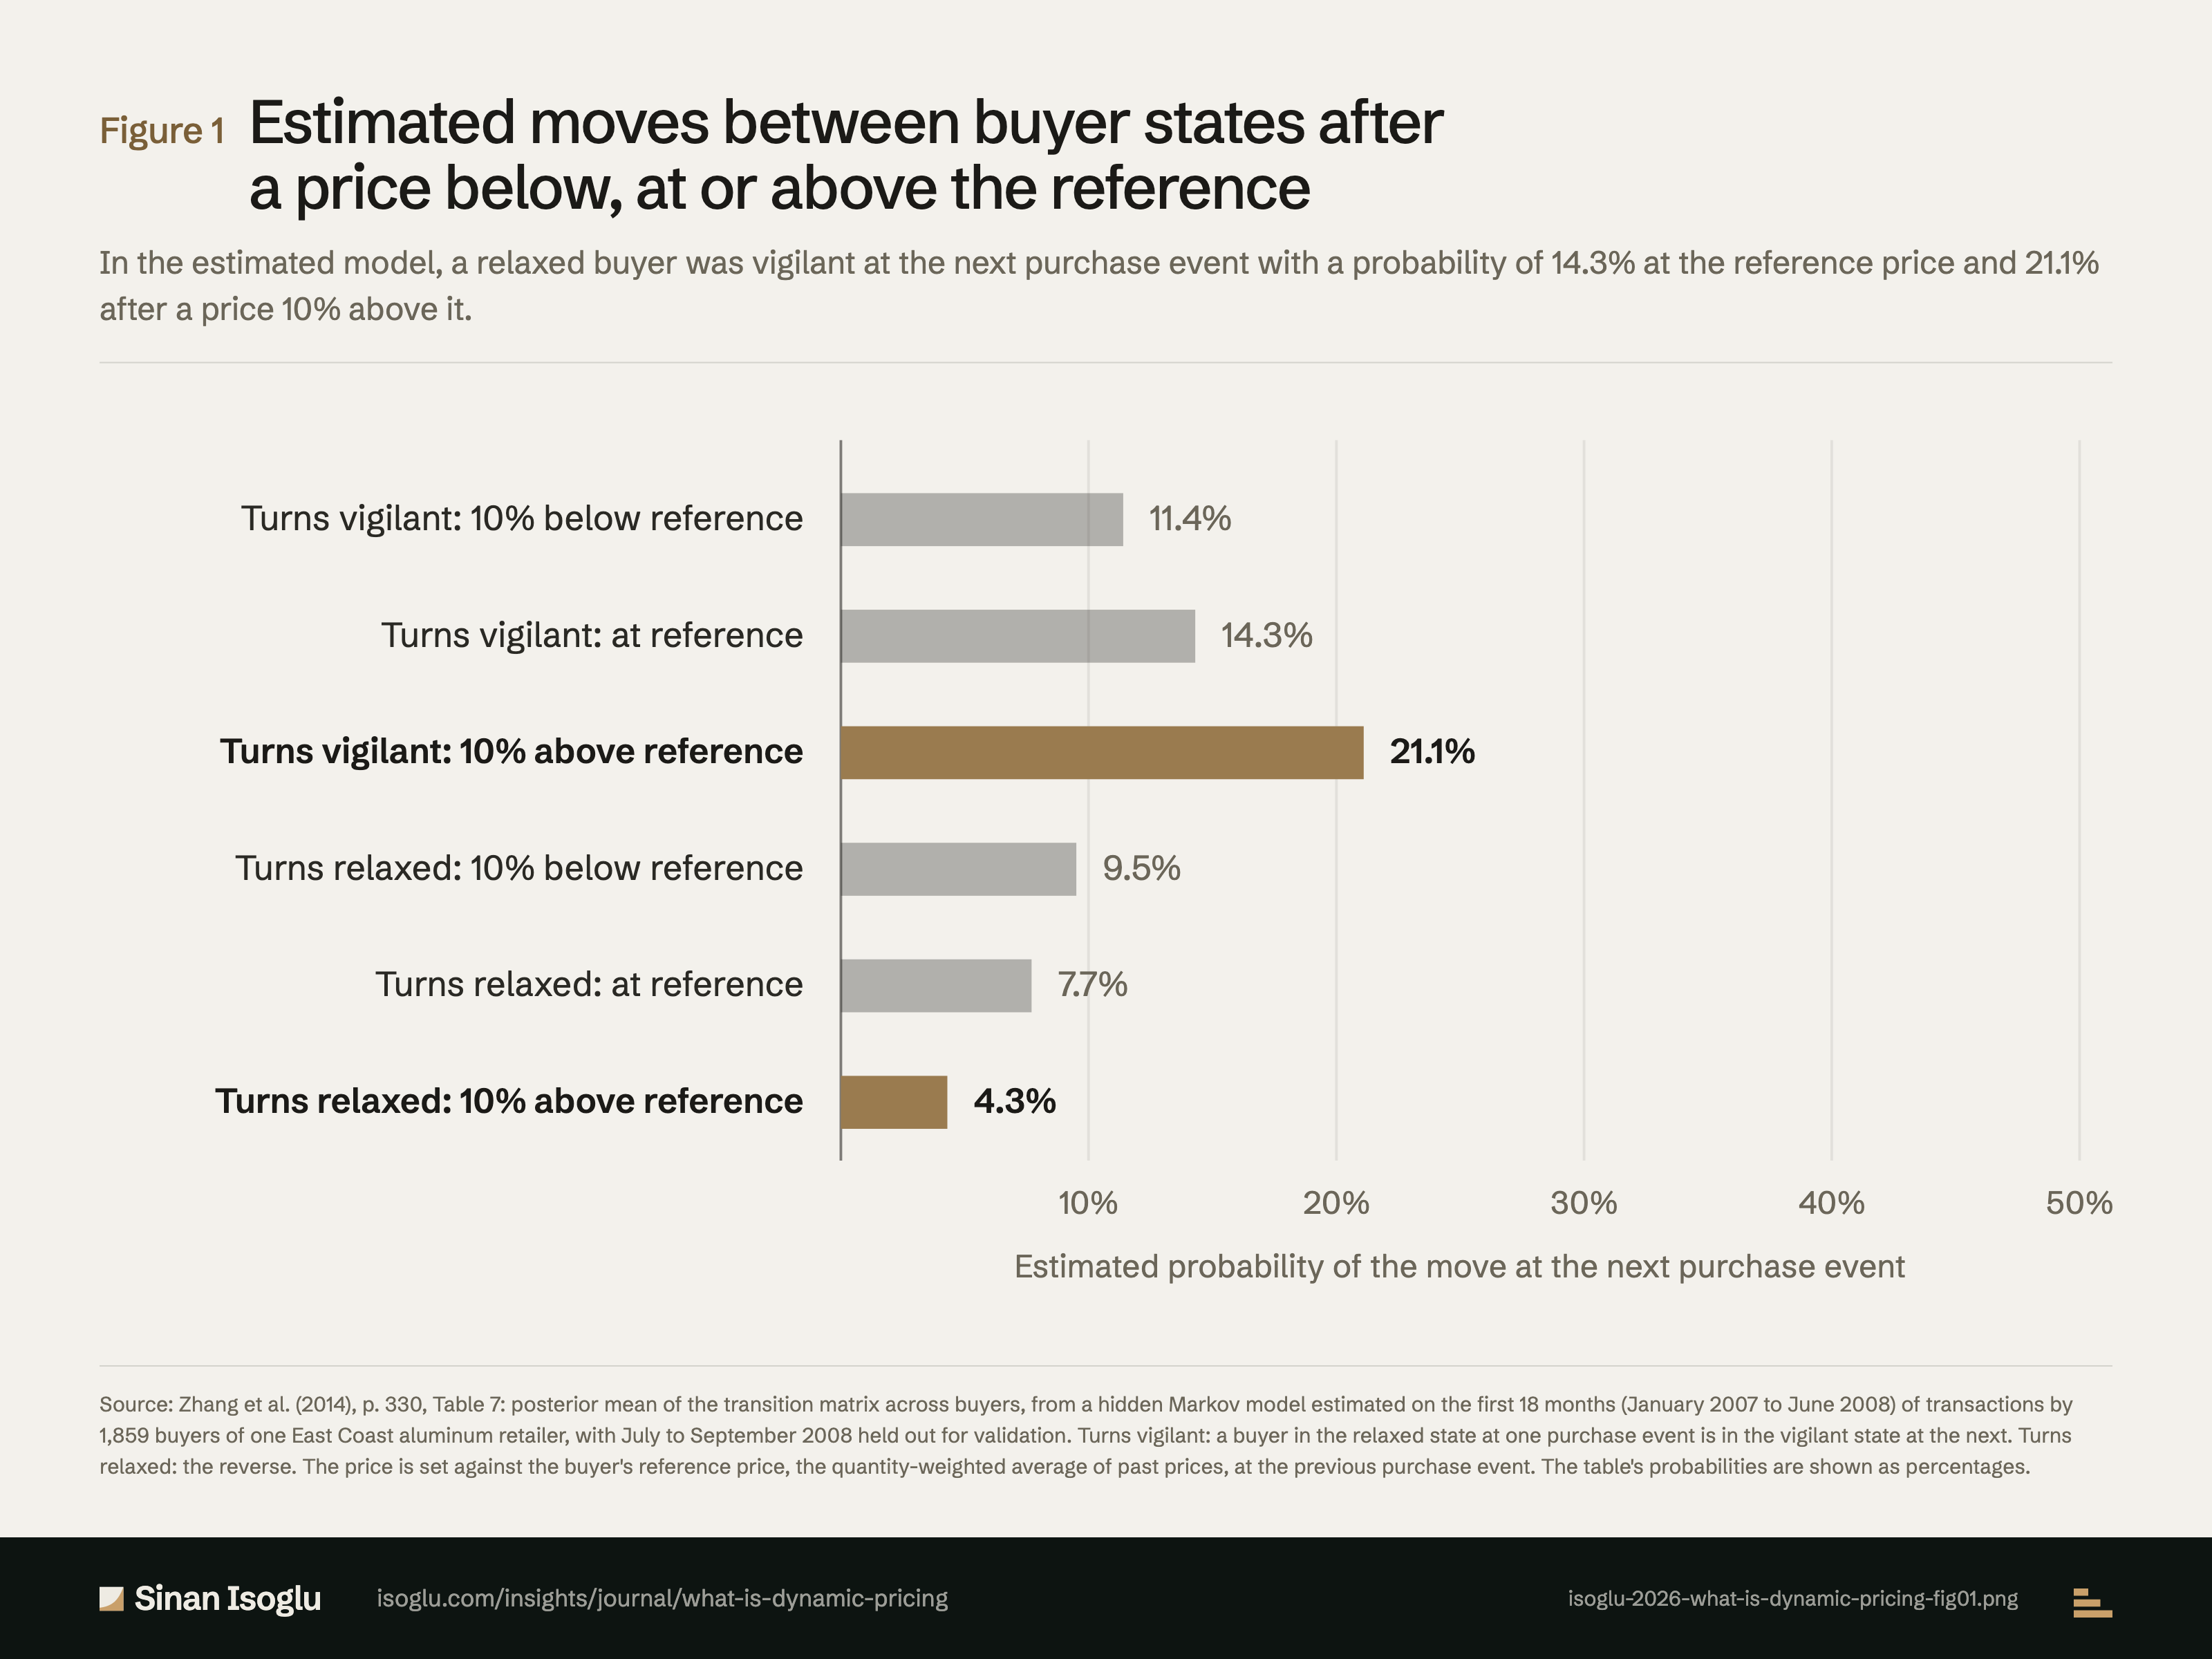
Estimated moves between buyer states after a price below, at or above the reference
In the estimated model, a relaxed buyer was vigilant at the next purchase event with a probability of 14.3% at the reference price and 21.1% after a price 10% above it.
Figure 1Estimated moves between buyer states after a price below, at or above the reference
Source: Zhang et al. (2014), p. 330, Table 7: posterior mean of the transition matrix across buyers, from a hidden Markov model estimated on the first 18 months (January 2007 to June 2008) of transactions by 1,859 buyers of one East Coast aluminum retailer, with July to September 2008 held out for validation. Turns vigilant: a buyer in the relaxed state at one purchase event is in the vigilant state at the next. Turns relaxed: the reverse. The price is set against the buyer's reference price, the quantity-weighted average of past prices, at the previous purchase event. The table's probabilities are shown as percentages.
Source and evidence
Each line names a claim related to this exhibit, its source, and how it was checked.
- A ZNA14-C6 Prices enter as gains or losses against a reference price, the quantity-weighted average of the buyer's past prices; Table 7 (p. 330), posterior mean transition matrix across buyers: relaxed to vigilant 0.114, 0.143 and 0.211 after a price 10% below, at and 10% above the reference; vigilant to relaxed 0.095, 0.077 and 0.043; a price increase may move the buyer into a sticky state of higher price sensitivity; in simulated one-off price changes, losses persist longer than gains (pp. 321, 329 to 331): "we use the quantity-weighted average price the buyer observed in past purchase events as a reference price"; "the transition matrix when the price equals the reference price"; "Posterior Mean of the Transition Matrix Across Buyers"; "the likelihood of a buyer dropping from the relaxed to the vigilant state (14.3%) is almost twice as high as the likelihood of moving from the vigilant to the relaxed state (7.7%)"; "It should be noted that Table 7 presents transition matrices computed at the posterior mean."; "Thus, a price increase may have a long-term effect by transitioning the buyer to a (sticky) state of increased price sensitivity."; "the negative effects of a price hike (loss) on all four decisions persist longer than the positive effects of price drop (gain)"Zhang, Netzer & Ansari (2014) · zhang-netzer-ansari-2014-dynamic-targeted-pricing
Grades: A, verified against the printed page of the primary source · B, primary source, text layer only · C, authoritative secondary · D, reported.
From the essay
Pricing & revenue architecture
What is dynamic pricing?
Dynamic pricing sets the price of the same offer again as time, demand, capacity, cost or the buyer changes. In surveys, fairness turned on the reason.
Read the essayThis exhibit belongs to an essay: the numbers live here, the argument lives there.
Cite or embed
Related exhibits
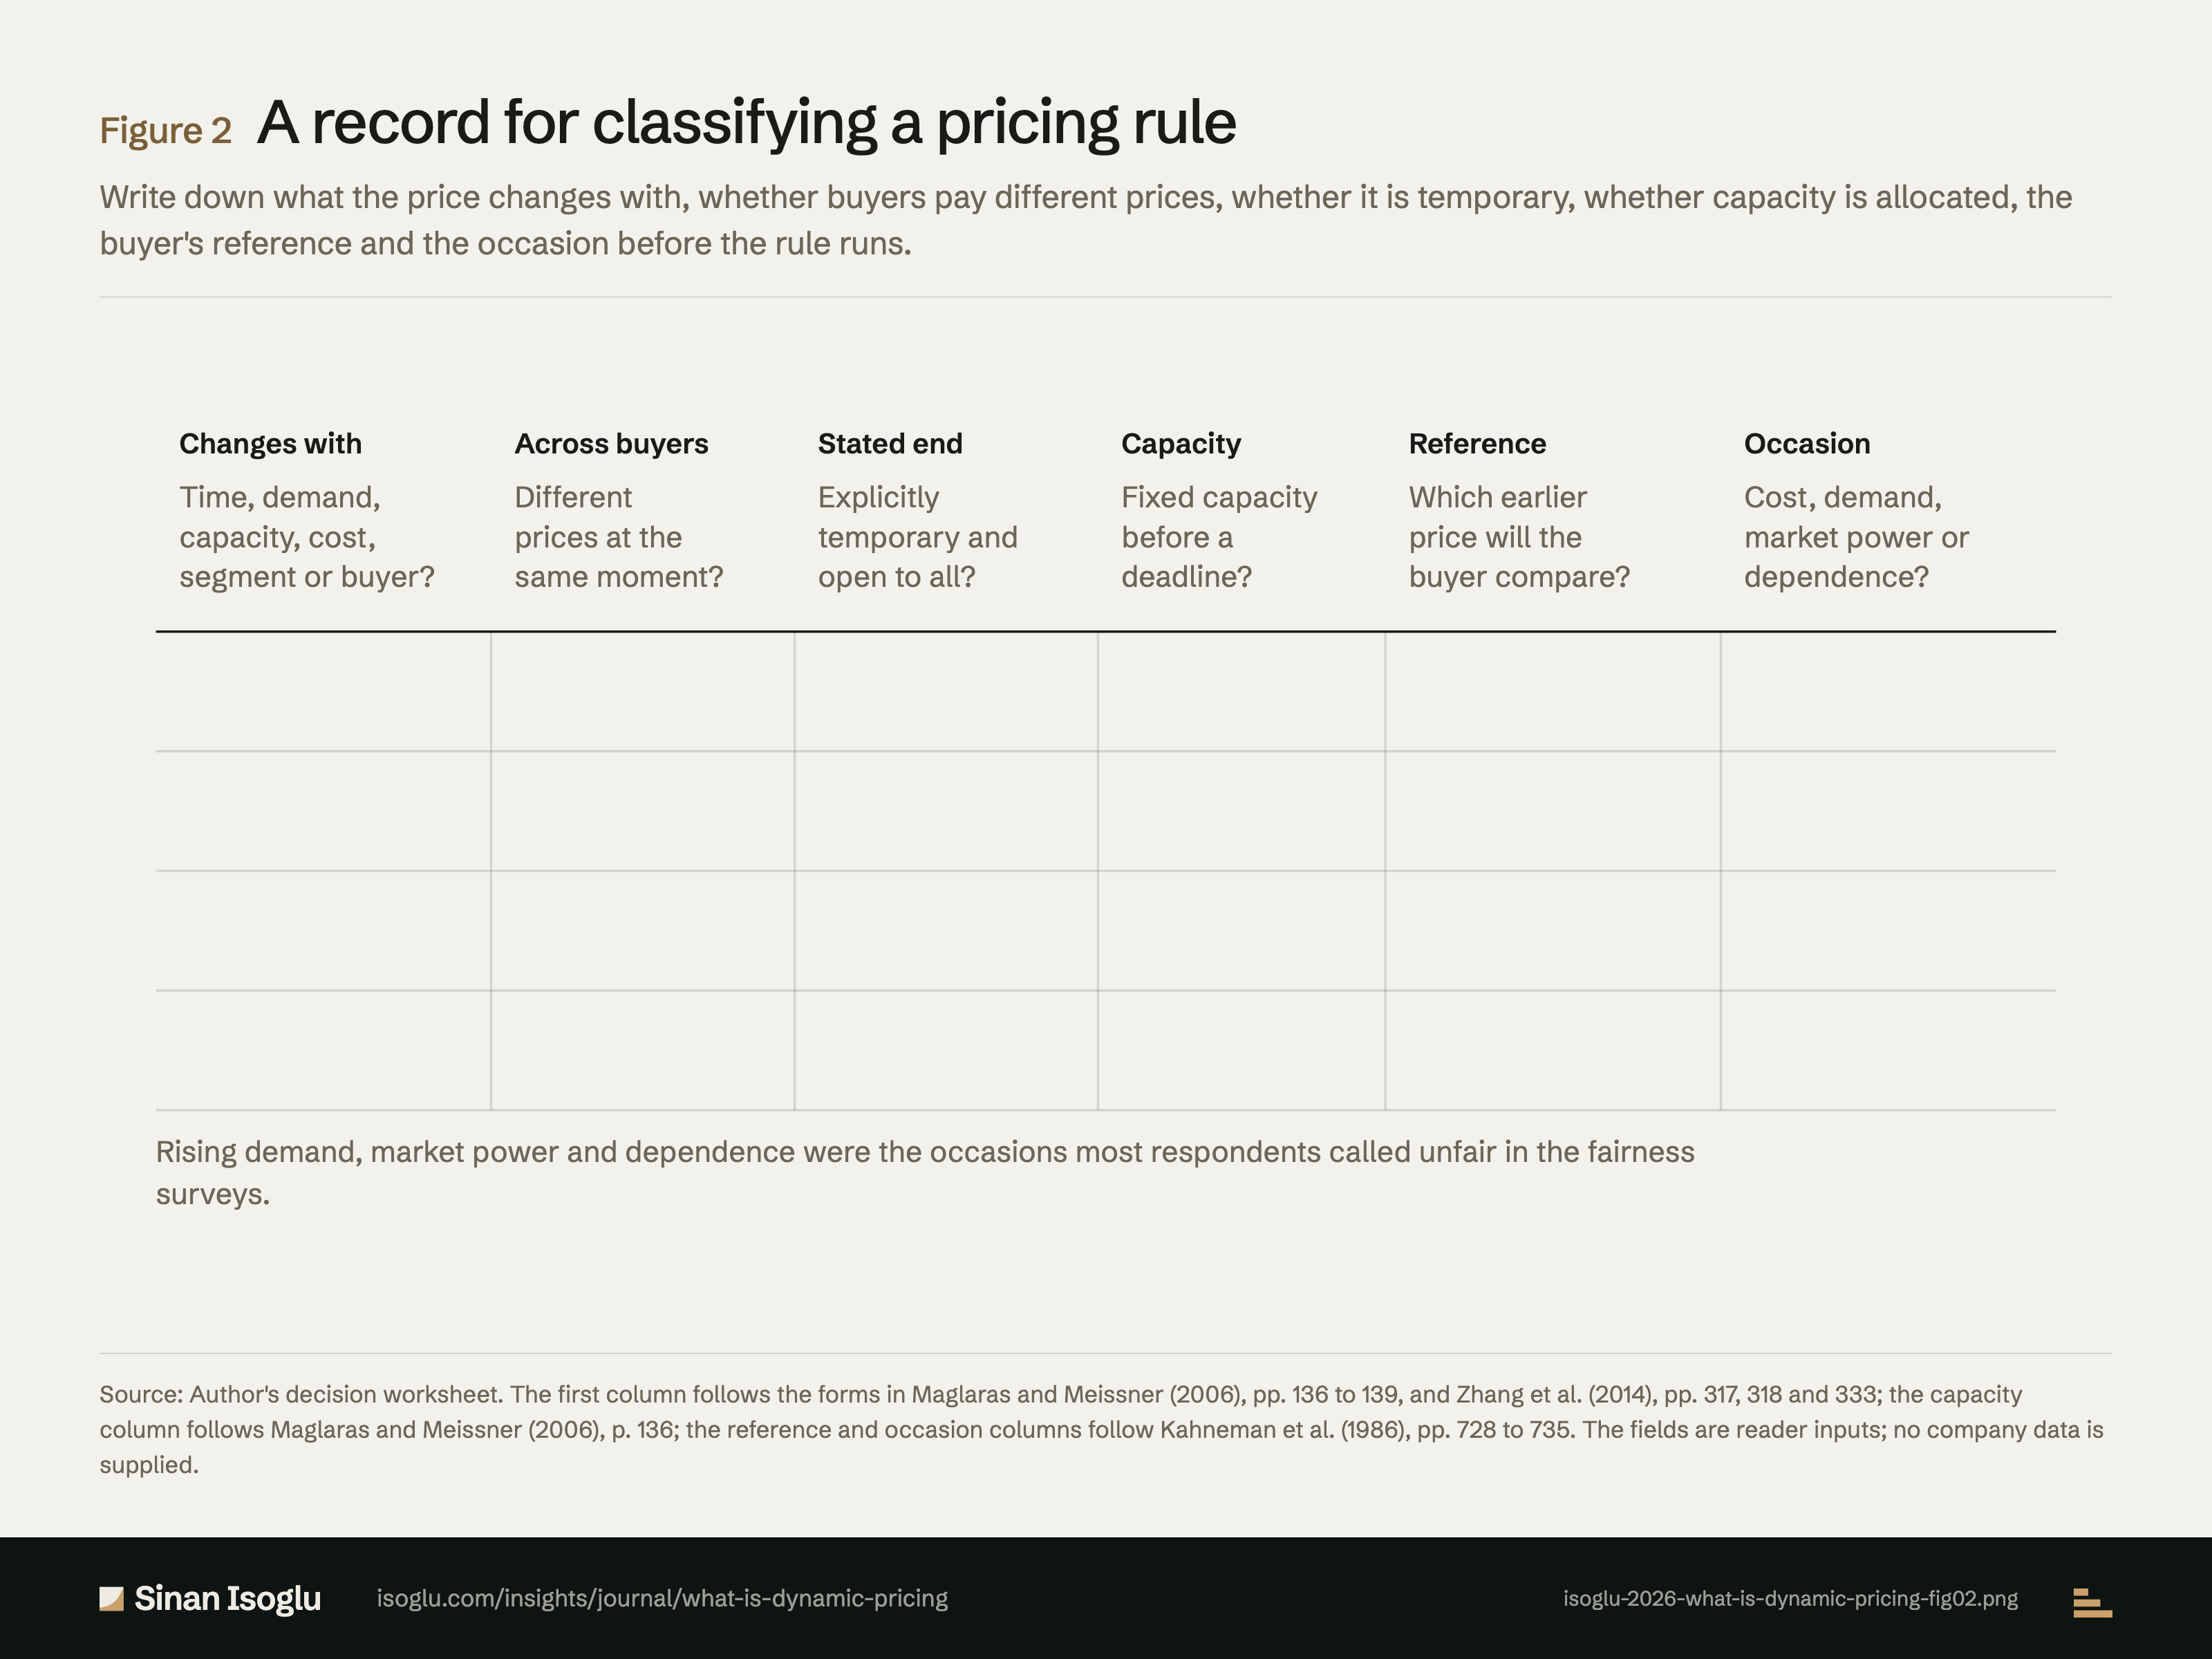
Figure 2Figure
A record for classifying a pricing rule
What is dynamic pricing?
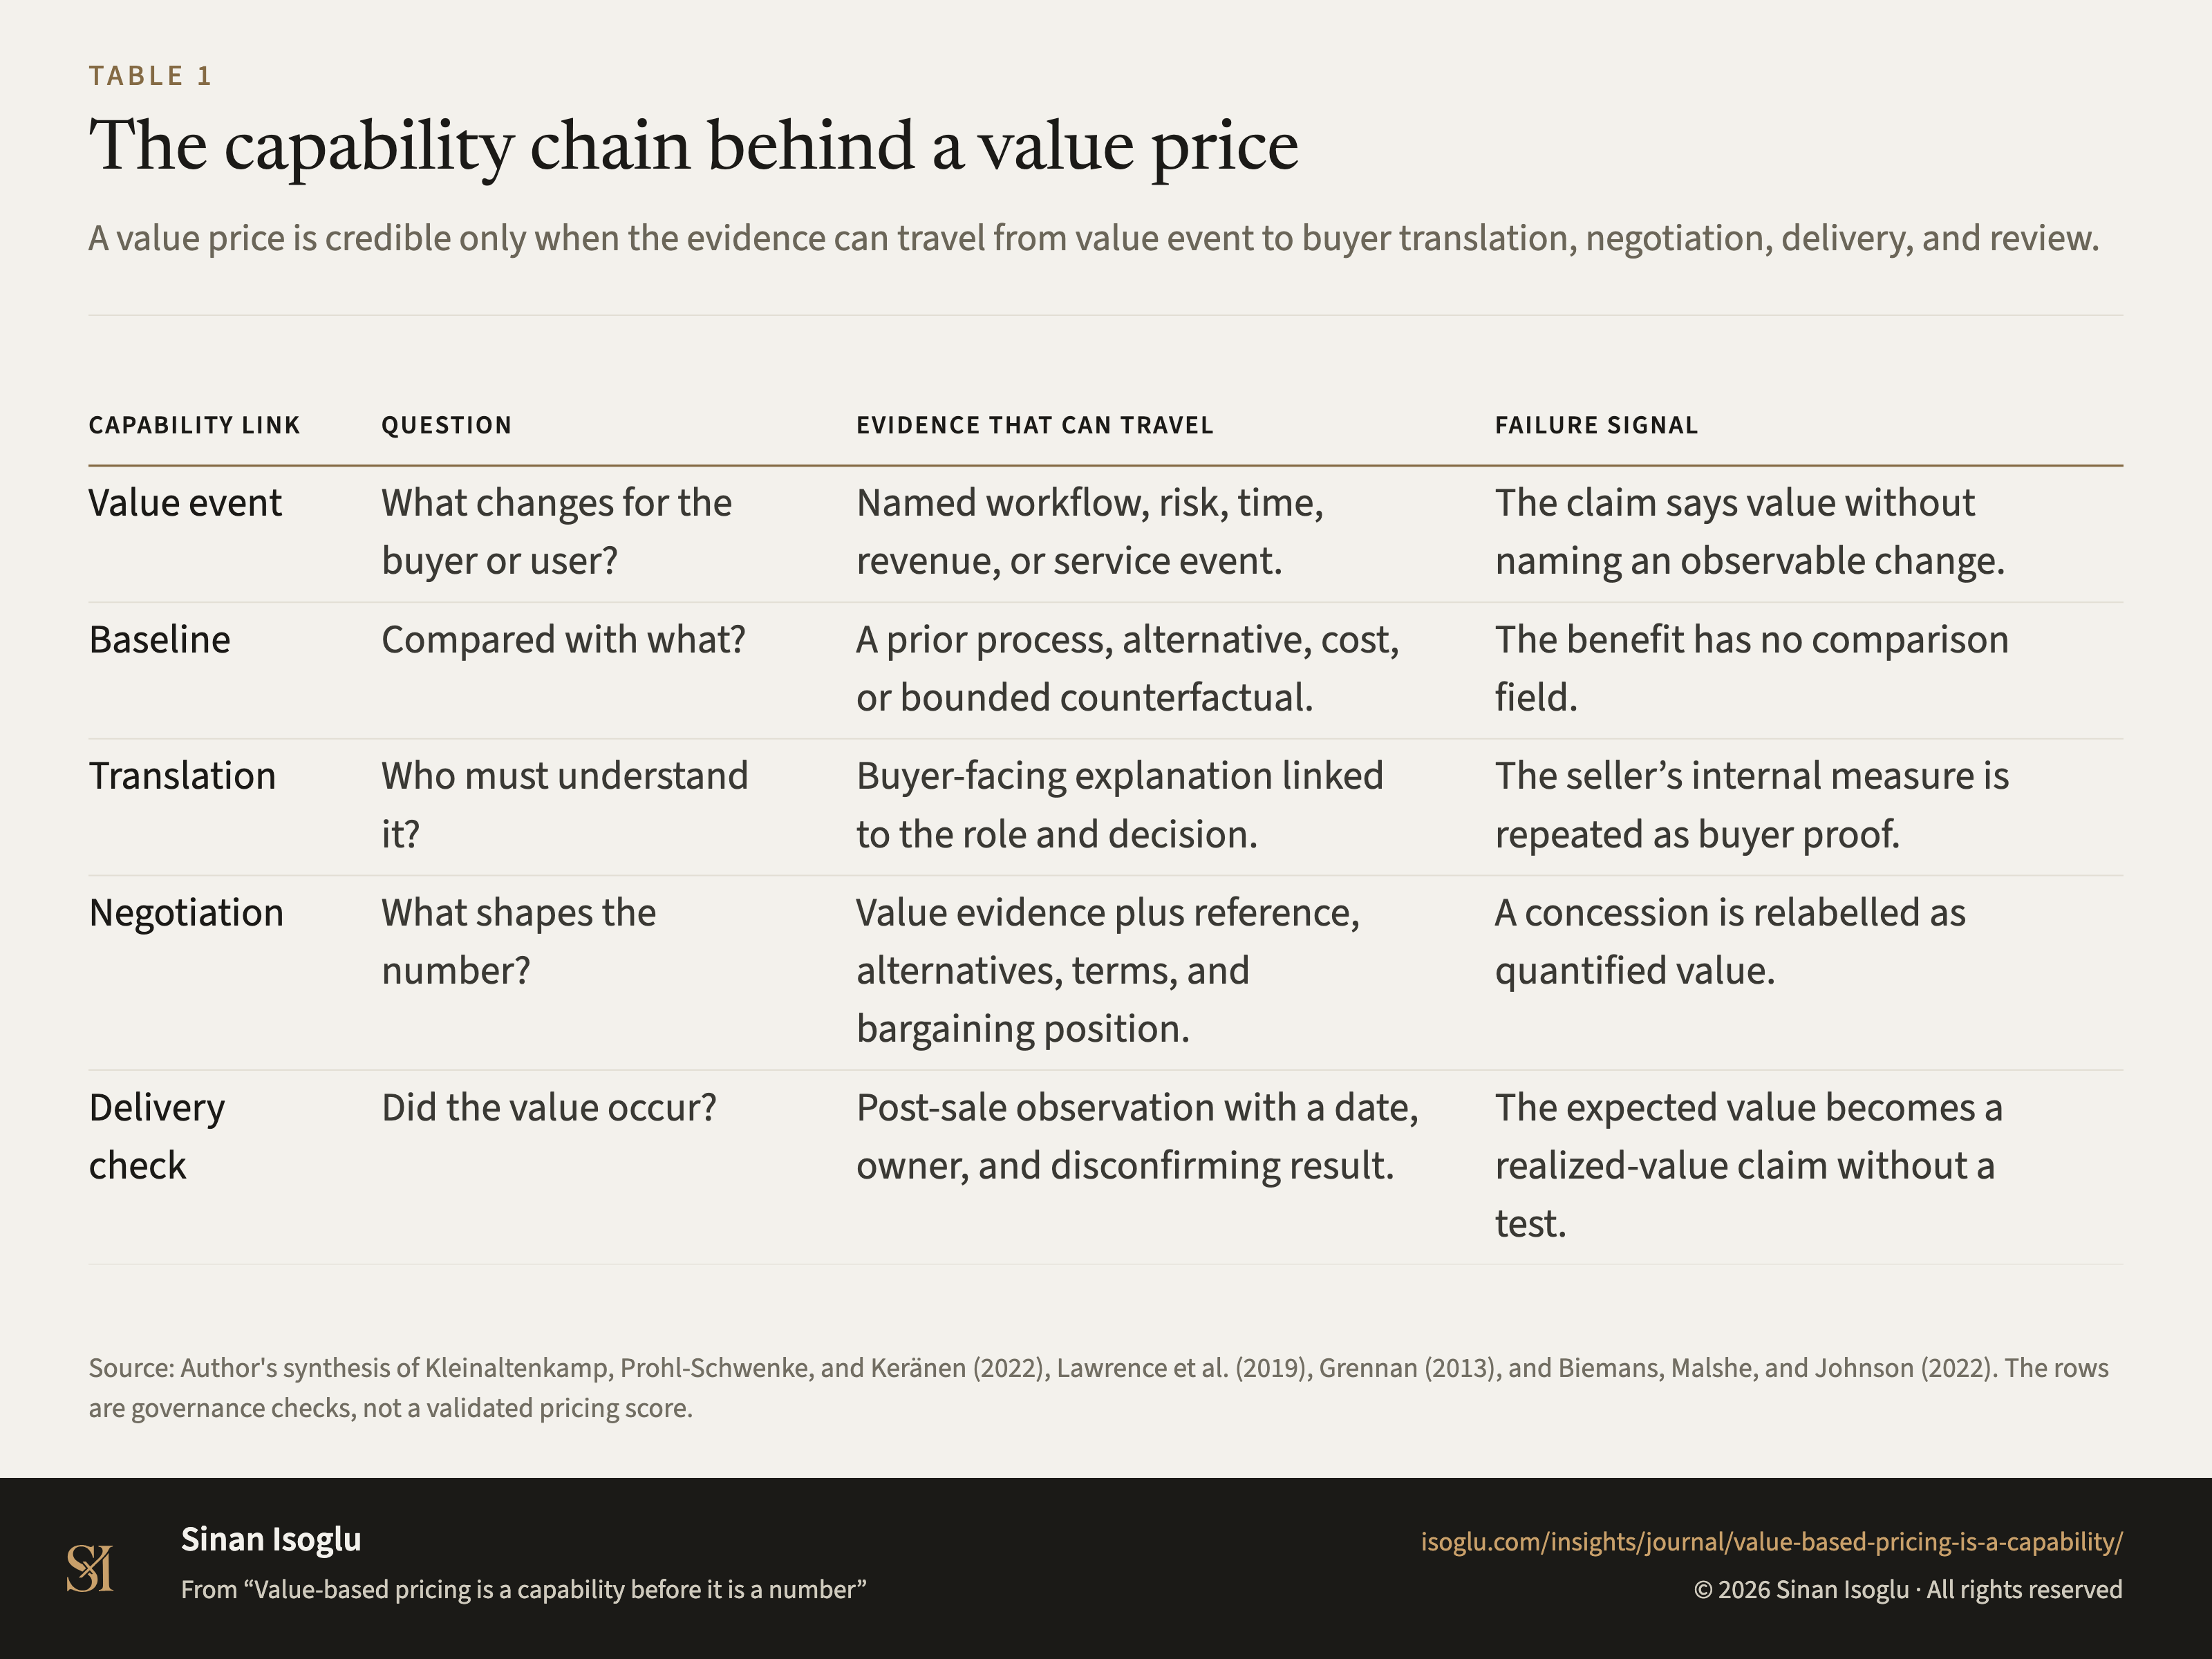
Table 1Table
The capability chain behind a value price
Value-based pricing is a capability before it is a number
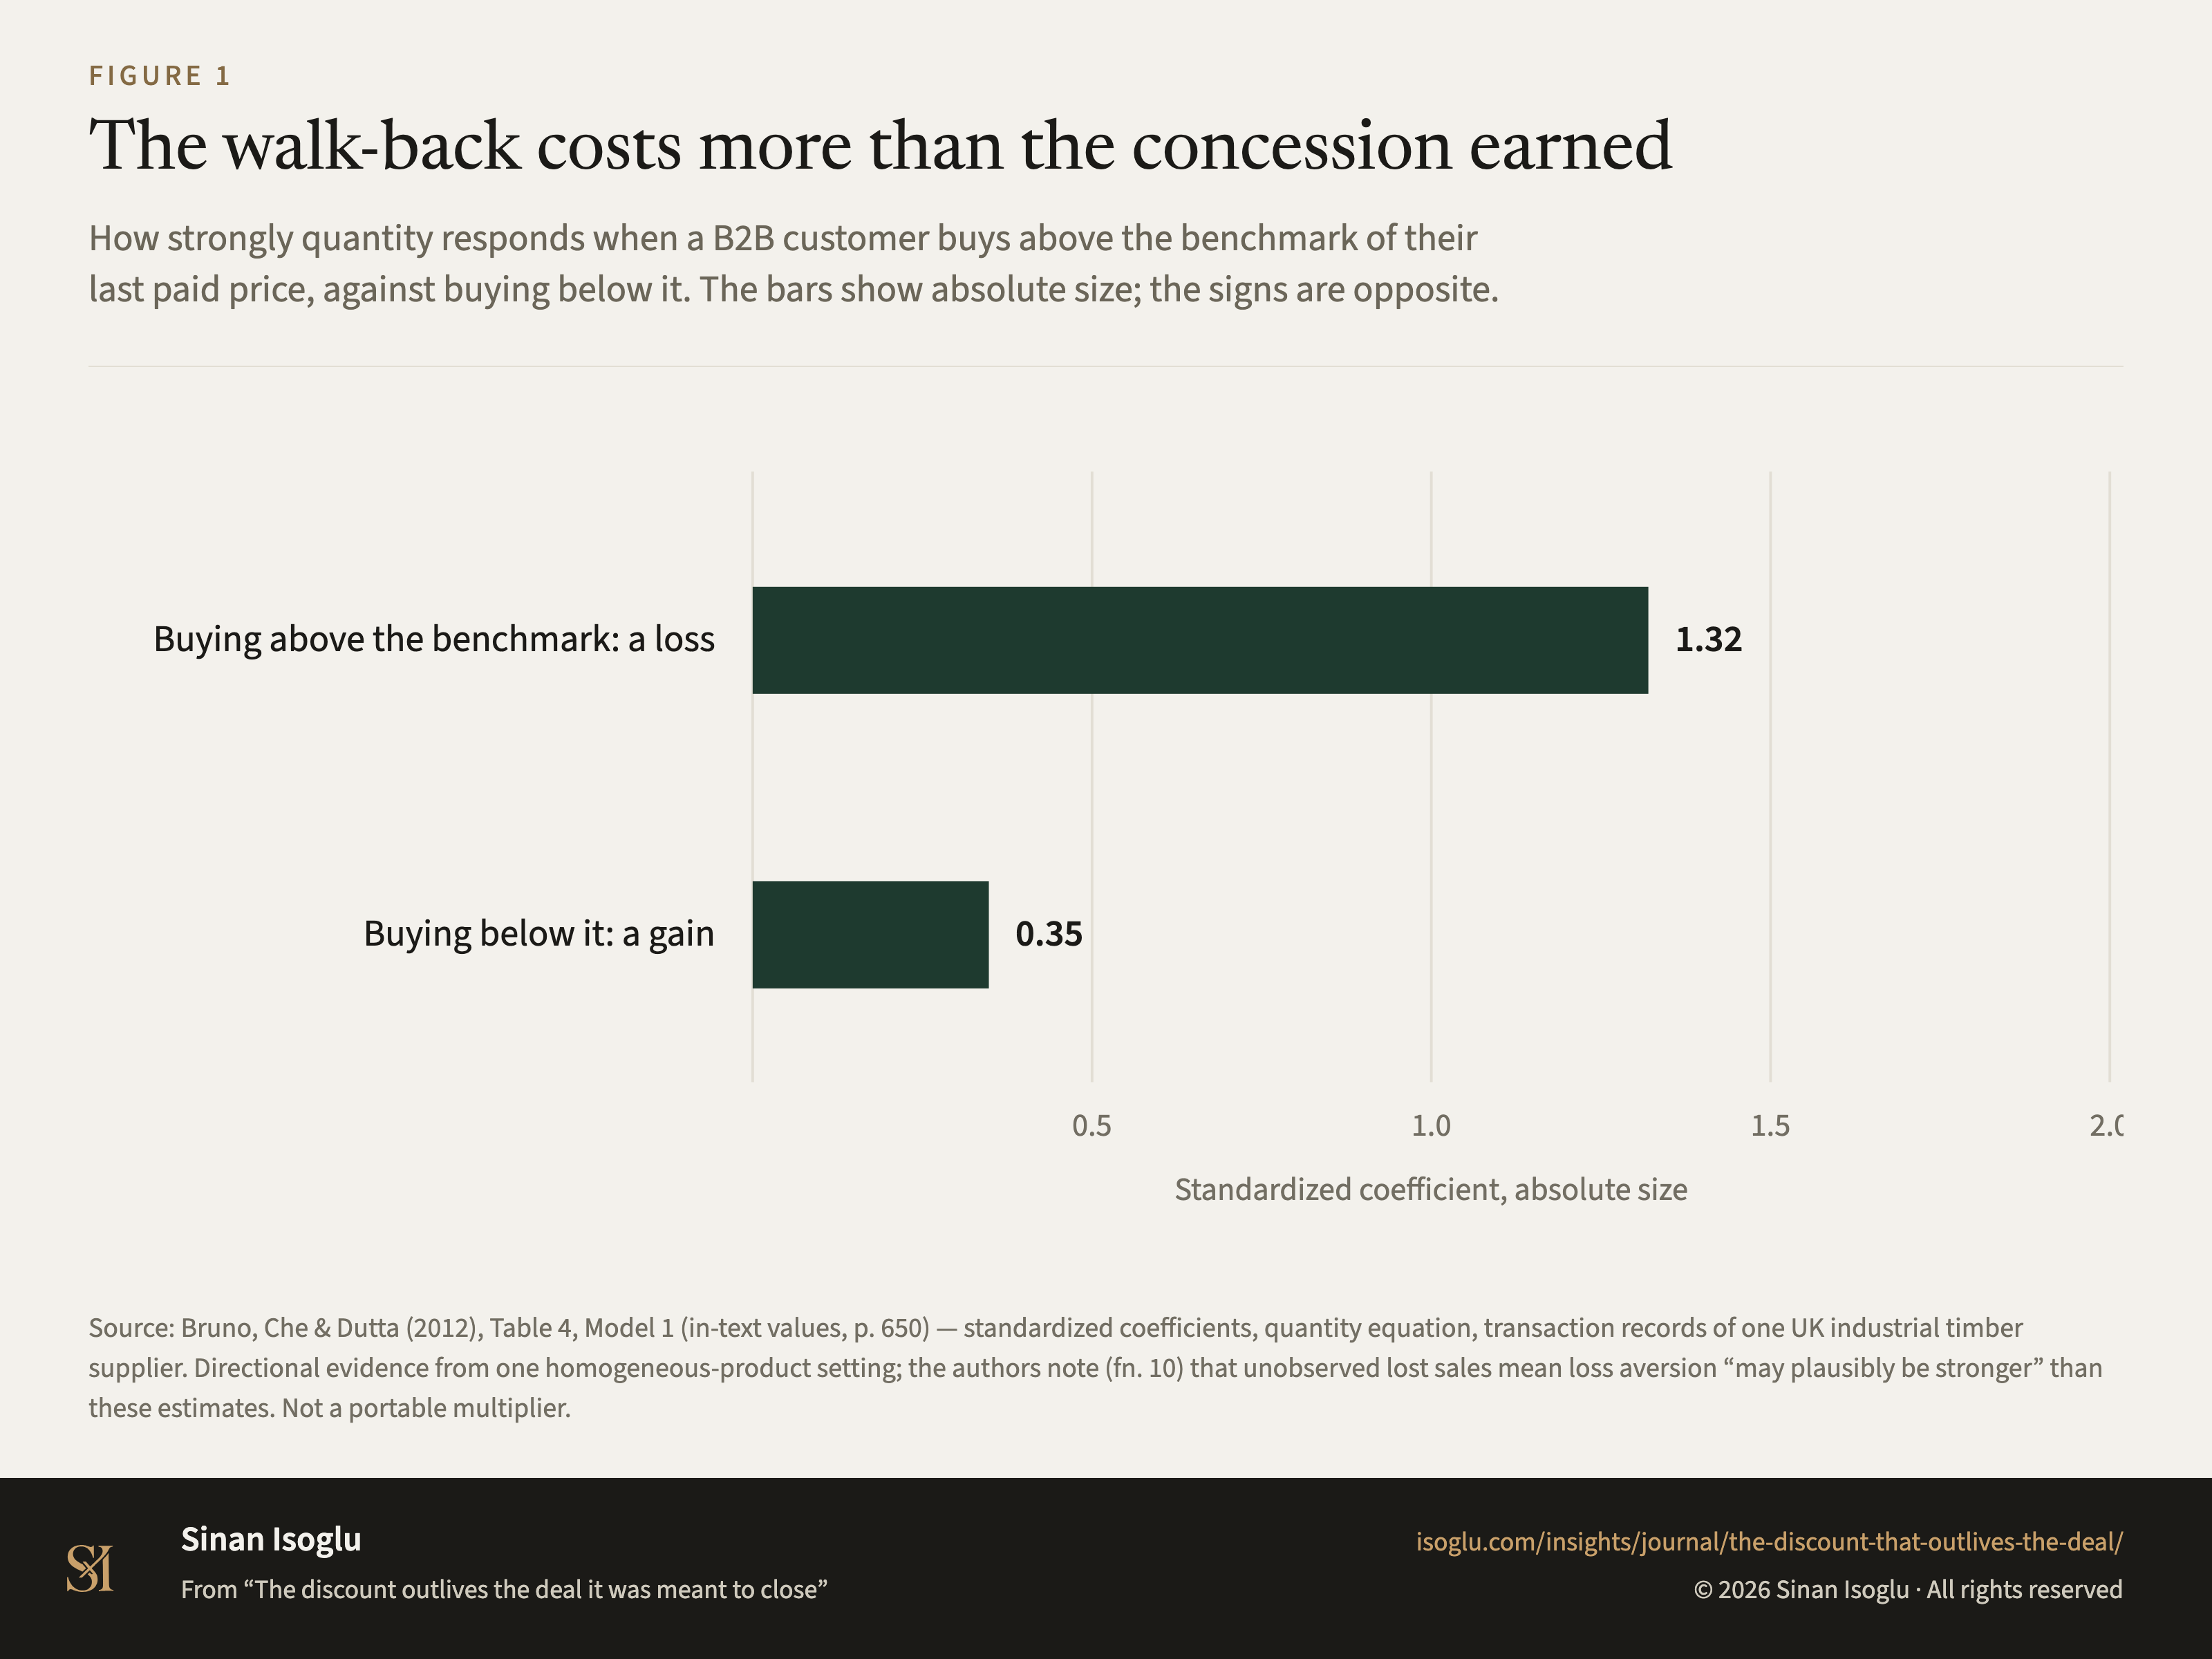
Figure 1Figure
The walk-back costs more than the concession earned
The discount outlives the deal it was meant to close
Contact
Bring the question you're working on.
Research, a guest lecture, or a commercial question.