The walk-back costs more than the concession earned
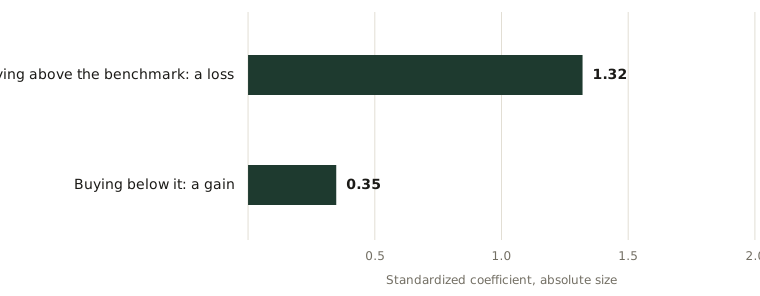
How strongly quantity responds when a B2B customer buys above the benchmark of their last paid price, against buying below it. The bars show absolute size; the signs are opposite.
Reference & Evidence
Source: Bruno, Che & Dutta (2012), Table 4, Model 1 (in-text values, p. 650) — standardized coefficients, quantity equation, transaction records of one UK industrial timber supplier. Directional evidence from one homogeneous-product setting; the authors note (fn. 10) that unobserved lost sales mean loss aversion “may plausibly be stronger” than these estimates. Not a portable multiplier.
Each line is a claim from the register this journal publishes against, resolved from the register at build time.
- A Quantity-equation LOSS −1.32 (SE .17) vs GAIN .348 (SE .15), standardized: loss aversion, direction only (BCD12-X1) bruno-che-dutta-2012-reference-price-b2b ·
BCD12-C3 - A The sample, counted in the paper: "the number of customers in our final data set is 135, and the number of salespeople is 33. We use a total of 10,614" transactions, for products each customer bought "at least ten times in the two-year period" bruno-che-dutta-2012-reference-price-b2b ·
BCD12-C9
Grades: A, verified against the printed page of the primary source · B, primary source, text layer only · C, authoritative secondary · D, reported.