Abbildung 1Aus „Was ist Kundenrückgewinnung?“
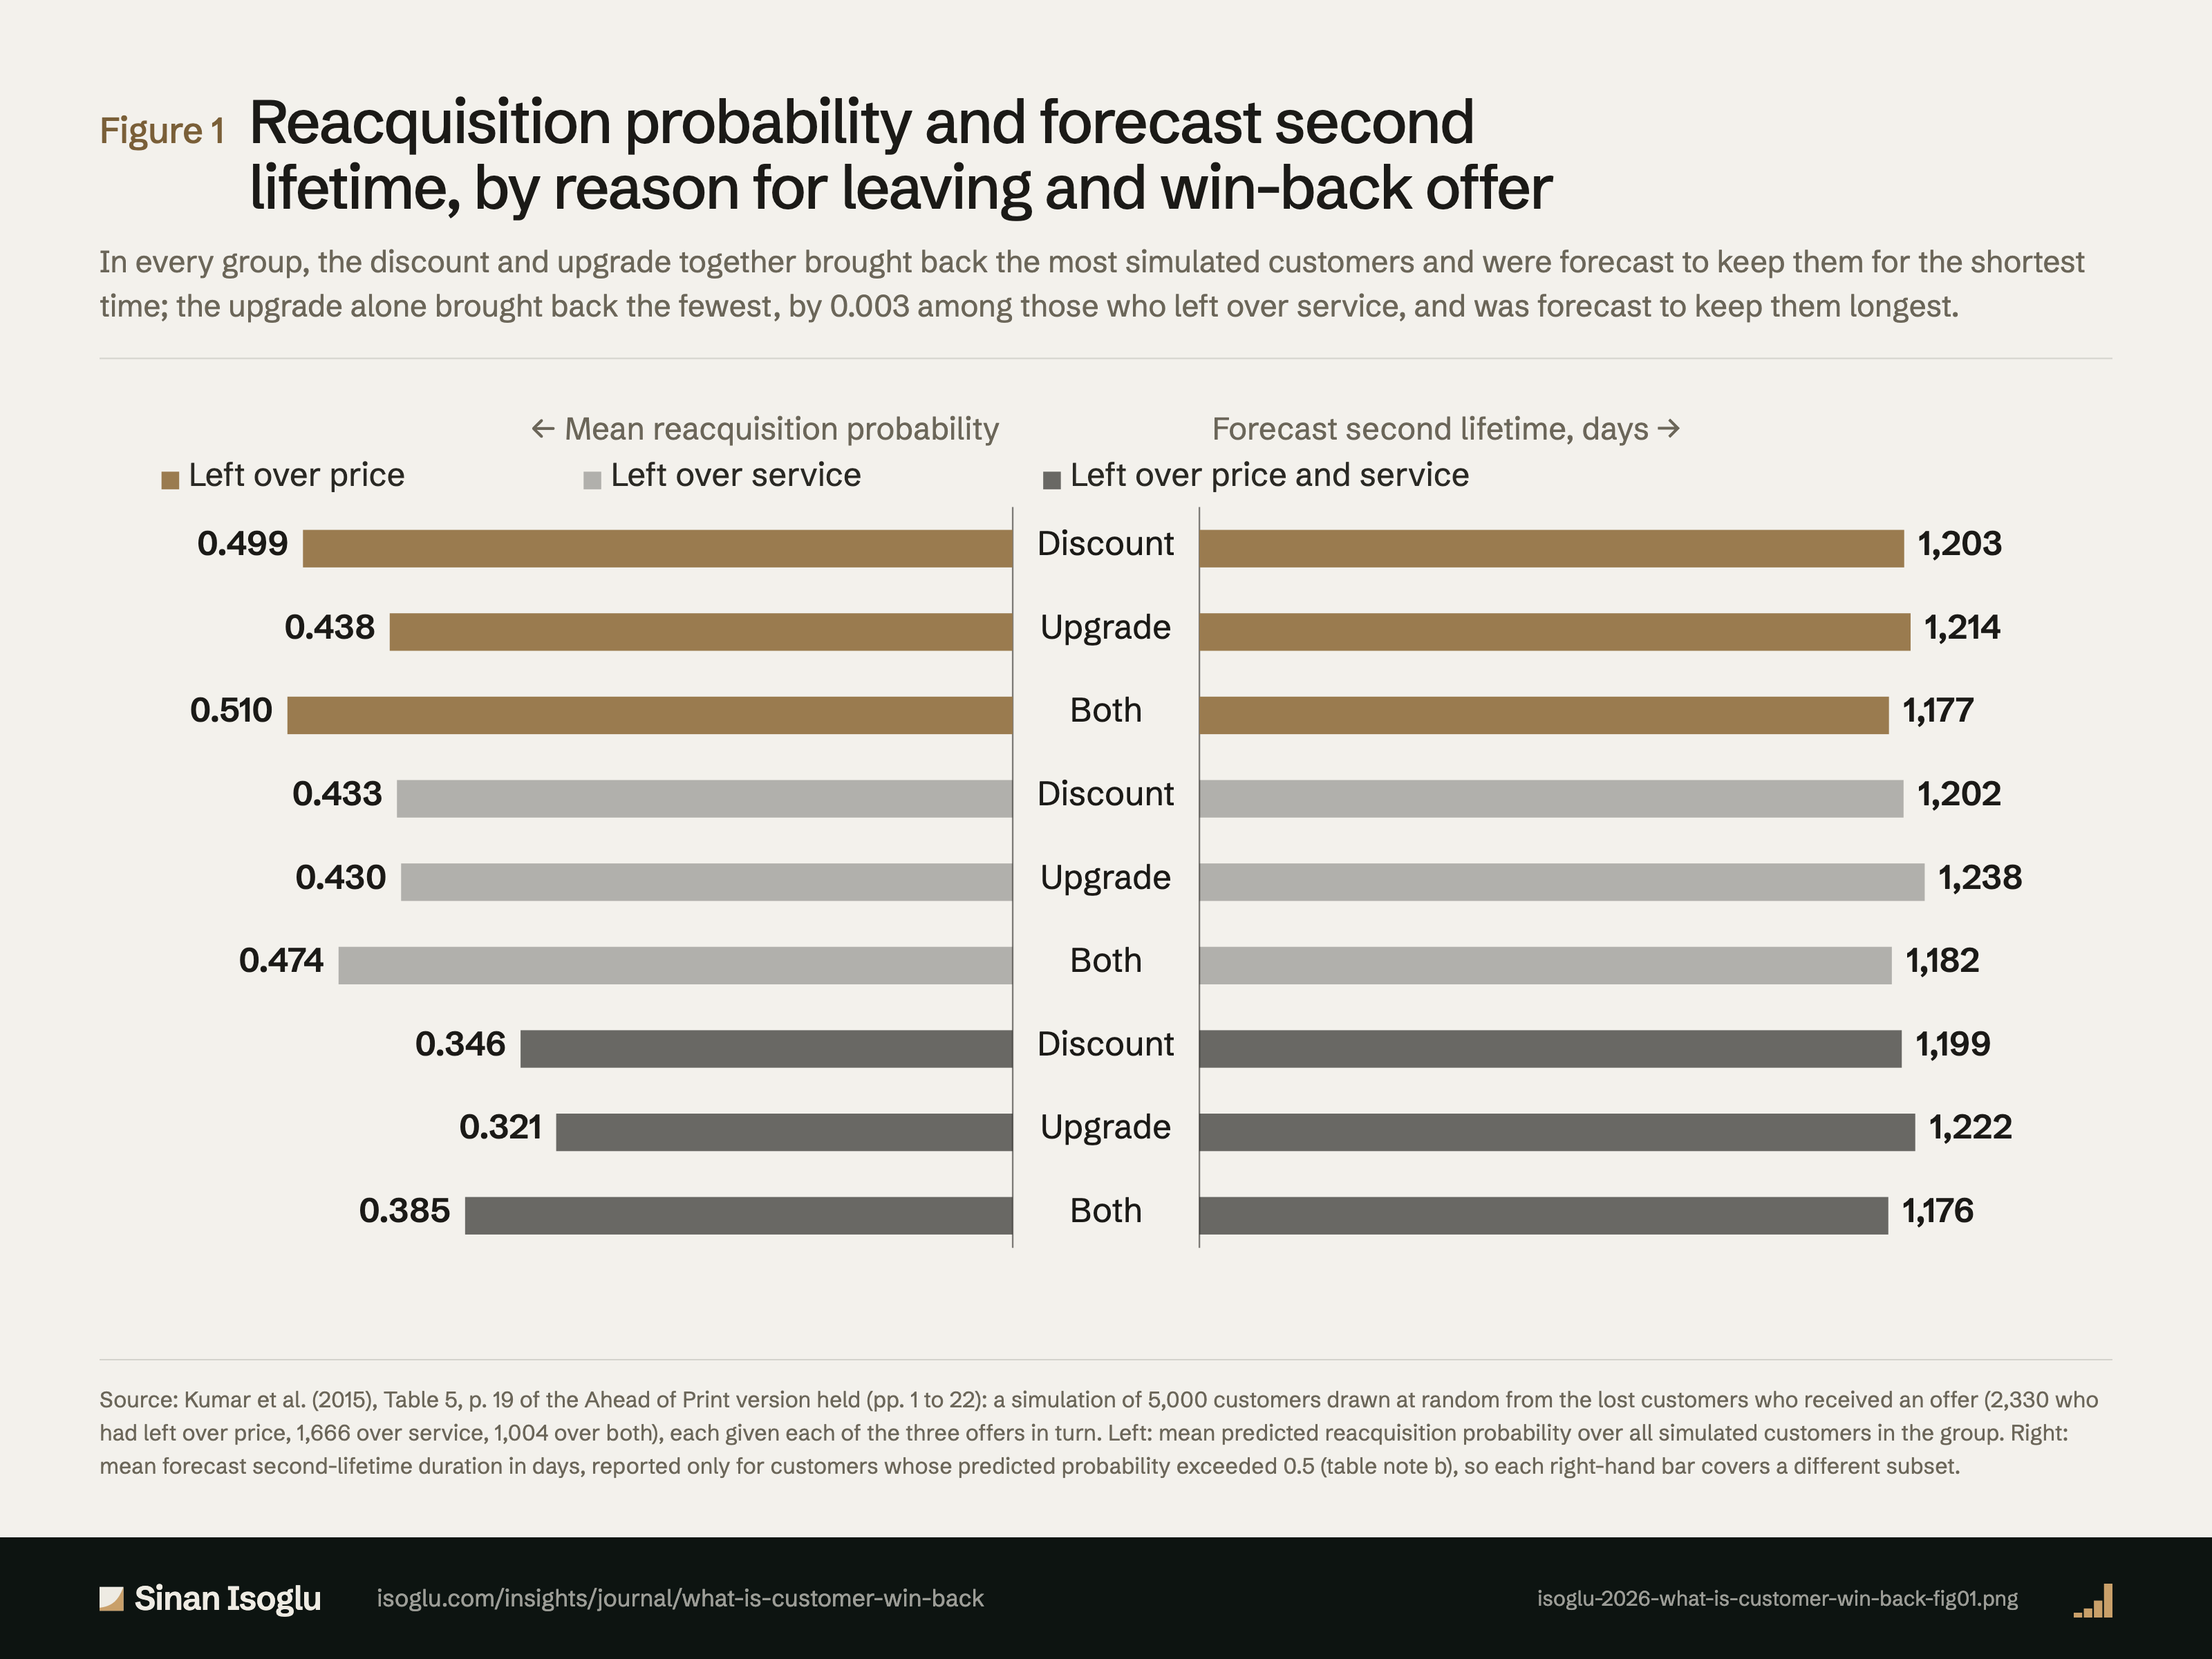
Rückgewinnungswahrscheinlichkeit und prognostizierte zweite Kundenbeziehung, nach Abwanderungsgrund und Angebot
In jeder Gruppe holten Preisnachlass und Paket-Upgrade zusammen die meisten simulierten Kunden zurück und hielten sie der Prognose nach am kürzesten; das Upgrade allein holte die wenigsten zurück, bei den wegen des Service Gegangenen mit 0,003 Abstand, und sollte sie der Prognose nach am längsten halten.
Abbildung 1Rückgewinnungswahrscheinlichkeit und prognostizierte zweite Kundenbeziehung, nach Abwanderungsgrund und Angebot
Quelle: Kumar et al. (2015), Tabelle 5, S. 19 der vorliegenden Ahead-of-Print-Fassung (S. 1 bis 22): eine Simulation von 5.000 Kunden, zufällig gezogen aus den verlorenen Kunden, die ein Angebot erhielten (2.330, die wegen des Preises gegangen waren, 1.666 wegen des Service, 1.004 aus beiden Gründen), von denen jeder nacheinander jedes der drei Angebote erhält. Links: mittlere vorhergesagte Rückgewinnungswahrscheinlichkeit über alle simulierten Kunden der Gruppe. Rechts: mittlere prognostizierte Dauer der zweiten Beziehung in Tagen, nur für Kunden mit einer vorhergesagten Wahrscheinlichkeit über 0,5 (Tabellenanmerkung b), sodass jeder rechte Balken eine andere Teilmenge abdeckt.
Quelle und Evidenz
Jede Zeile nennt eine Aussage zu dieser Abbildung, ihre Quelle und die Art ihrer Prüfung.
- A KBZ15-C5 Simulation of 5,000 customers drawn from the pre-reacquisition sample (2,330 price, 1,666 service, 1,004 both), each under each of three offers (Table 5, p. 19): mean reacquisition probability for discount, upgrade, both: price leavers .499, .438, .510; service leavers .433, .430, .474; both-reason leavers .346, .321, .385; mean forecast second-lifetime duration in days, for customers with predicted probability above .5 only: 1,203, 1,214, 1,177; 1,202, 1,238, 1,182; 1,199, 1,222, 1,176; the bundle reacquires most regardless of reason; for the price group the bundle's shorter duration is tested (t-tests) and a similar conclusion drawn for the others; expected second-lifetime profitability, defined as the product of probability, duration in months and monthly profit, is highest under the price offer for price leavers and under the bundle for the other groups; caution because offer depth did not vary (Ahead of Print version, pp. 18 to 20): "drawing 5,000 customers from the pre-reacquisition"; "Simulation Results"; "The mean forecast of second-lifetime duration and profitability/month is reported only for those whose predicted reacquisition probability is"; "offer is the most successful, regardless of the reason for"; "are reacquired with a price offer (M = 1,203"; "We draw a similar conclusion for other"; "price-related reasons, a price win-back offer yields the"; "highest expected second-lifetime profitability compared"; "the expected second-lifetime profitability as a product of reacquisition probability, second-lifetime duration (in months)"; "In addition, one should be cautious interpreting the"; "without varying the depth of the"Kumar, Bhagwat & Zhang (2015) · Kumar, Bhagwat & Zhang. (2015)
- B WINB-OWN-C5 Kumar et al.'s own descriptive shares imply raw return rates by offer type that order the offers differently from their model: return rate = share among the 14,384 reacquired × 14,384 ÷ (share among the 53,729 targeted × 53,729), so discount .42 × 14,384 ÷ (.37 × 53,729) = 30.4% (29.6 to 31.2 within the rounding of the printed shares), upgrade .36 × 14,384 ÷ (.38 × 53,729) = 25.4% (24.7 to 26.1), both .22 × 14,384 ÷ (.25 × 53,729) = 23.6% (22.6 to 24.6), overall 26.8%, the article's 27%; the combined offer's bounds lie below the other two, while the jointly estimated model puts it first and the upgrade last (Table 3, p. 13, and Table 4, p. 16, both read from page images; p. 17); with the type of offer randomly assigned and stated to be unrelated to the reason for leaving, the raw shares are themselves a fair comparison; the article does not reconcile the two, so the page reports the ranking as the authors' estimate and does not say which is right (a table error, a different estimation sample or an assignment less balanced than described would each explain it). Added after G5 F1.Author check of KBZ15-C2 and KBZ15-C3
Prüfgrade: A, gegen die gedruckte Seite der Primärquelle geprüft · B, Primärquelle, nur Textebene · C, belastbare Sekundärquelle · D, berichtet.
Aus dem Beitrag
Wachstum, das sich potenziert
Was ist Kundenrückgewinnung?
Kundenrückgewinnung heißt, abgewanderte Kunden zurückzuholen. Ihr Wert liegt in der zweiten Beziehung: wer zurückkommt, mit welchem Angebot und wie lange.
Den Beitrag lesenDiese Abbildung gehört zu einem Essay: Die Zahlen stehen hier, das Argument dort.
Zitieren oder einbetten
Verwandte Abbildungen
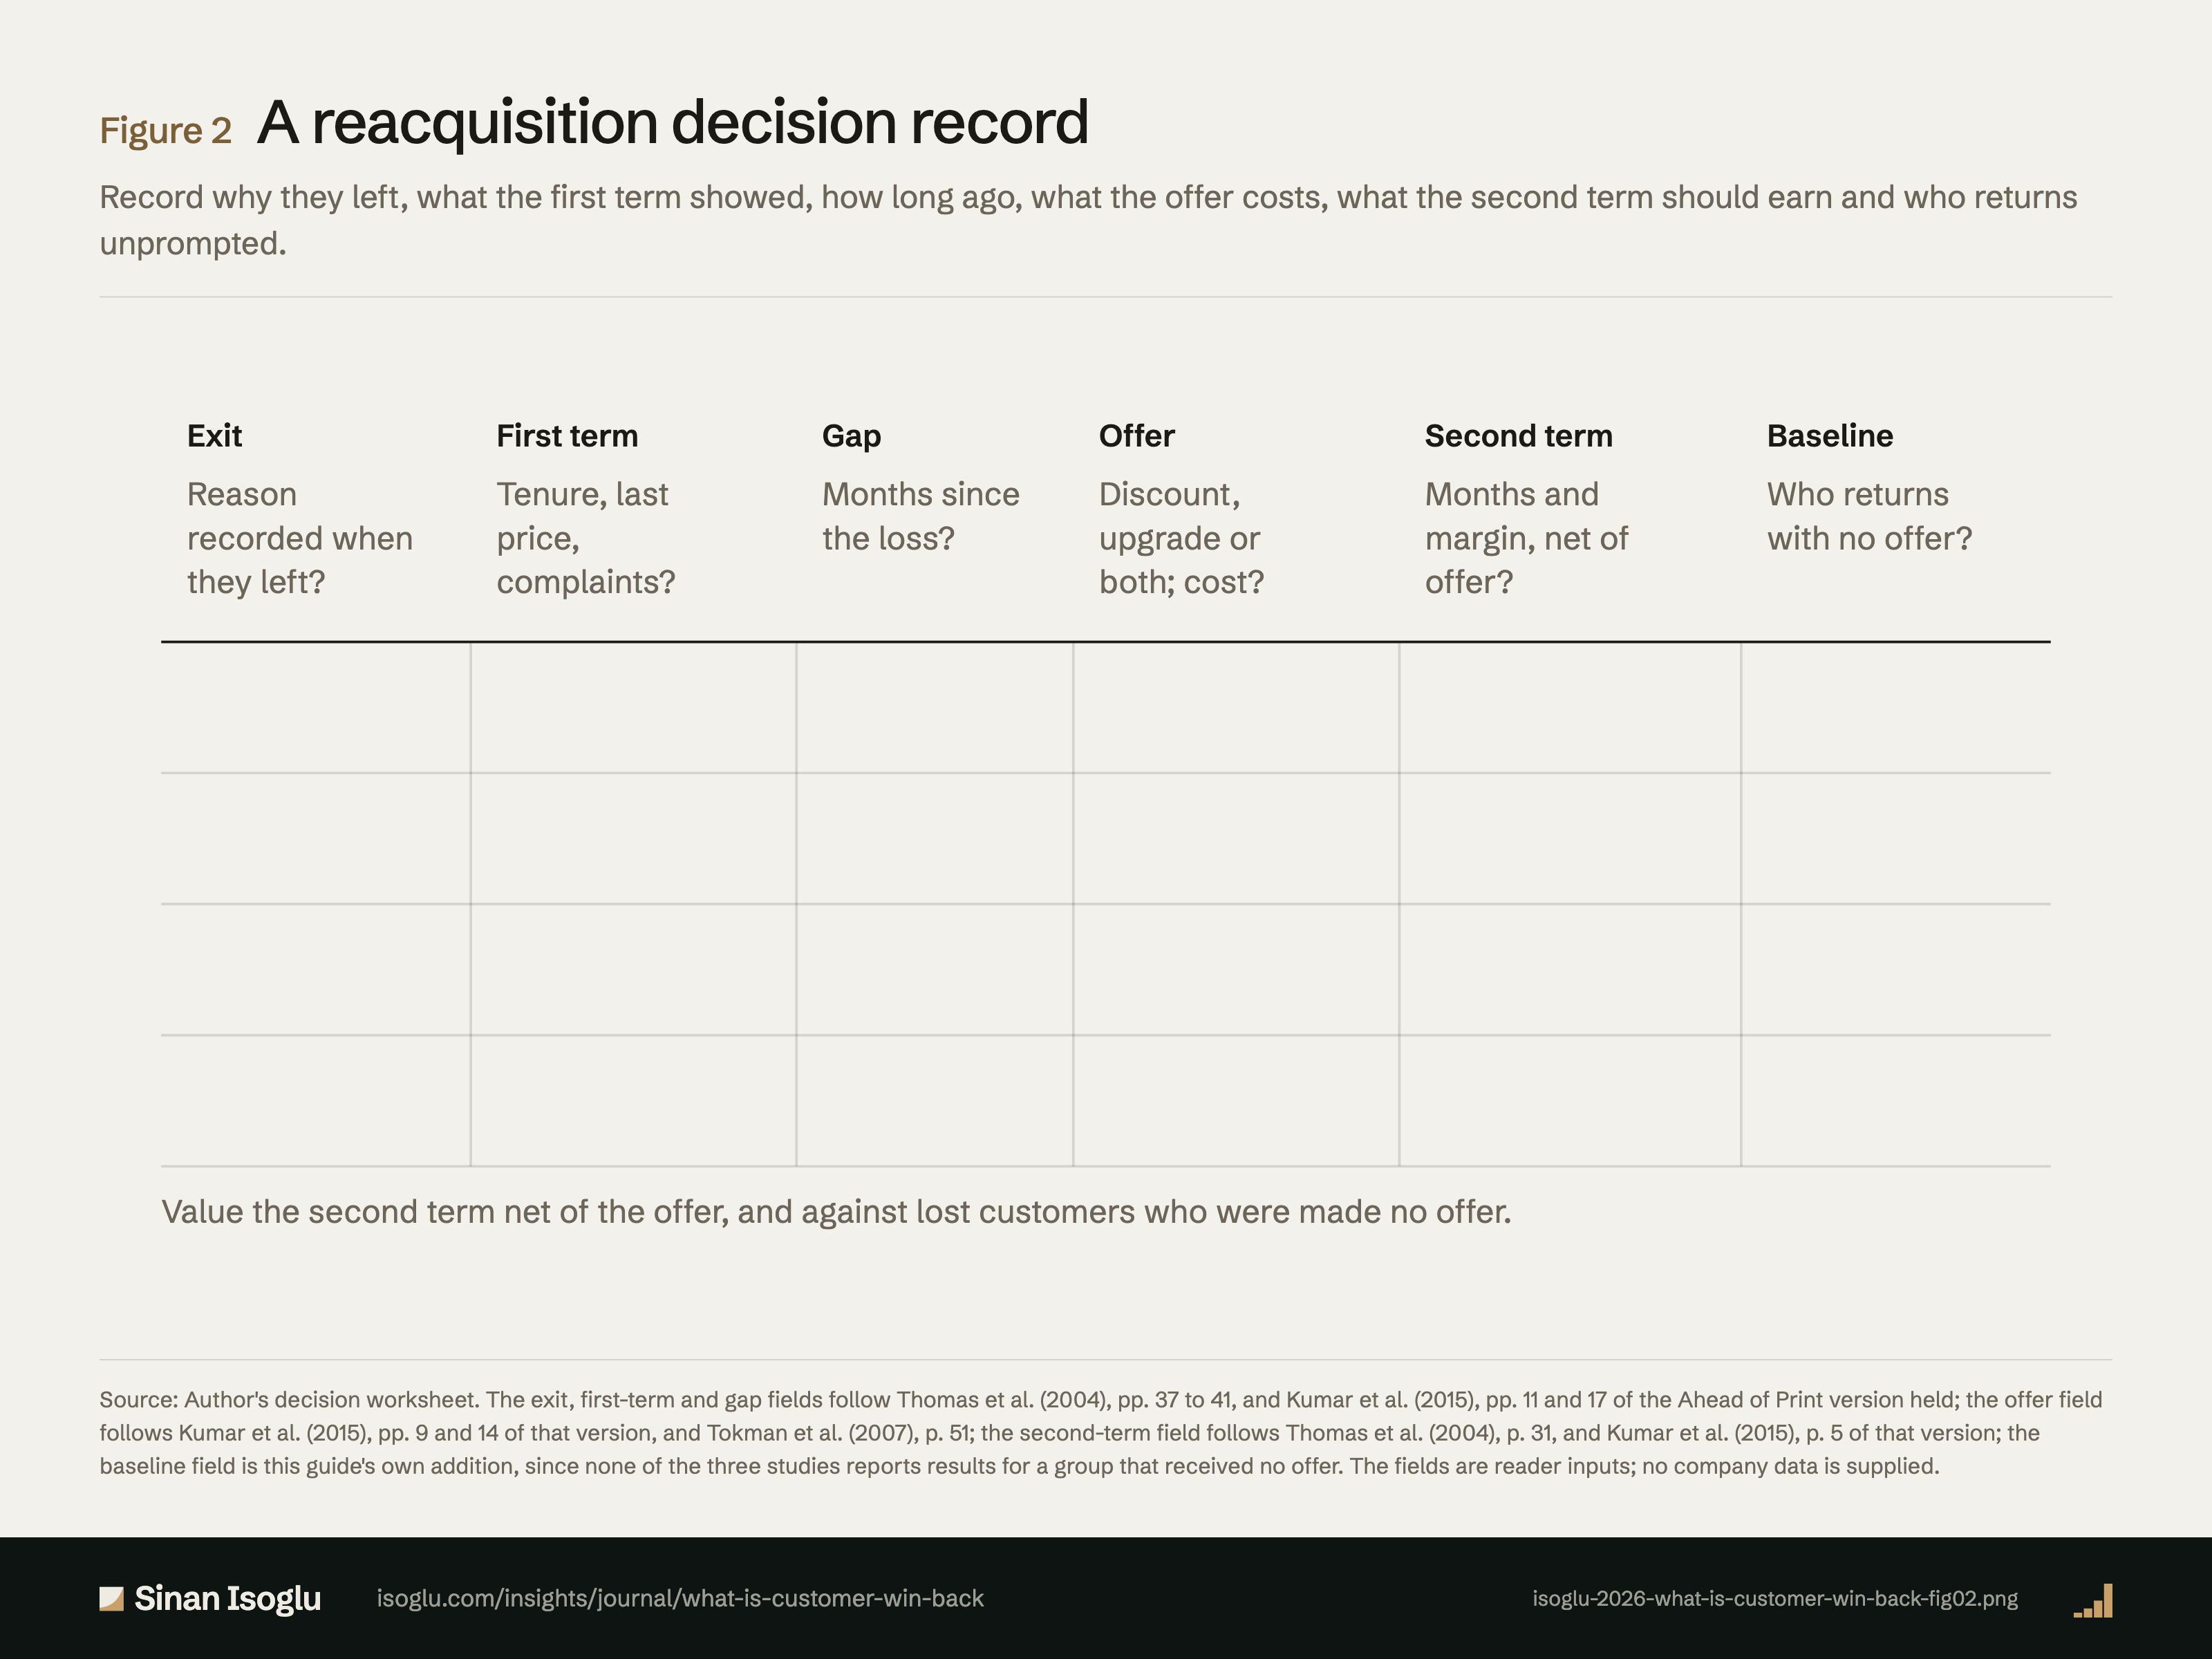
Abbildung 2Grafik
Ein Blatt für eine Rückgewinnungsentscheidung
Was ist Kundenrückgewinnung?
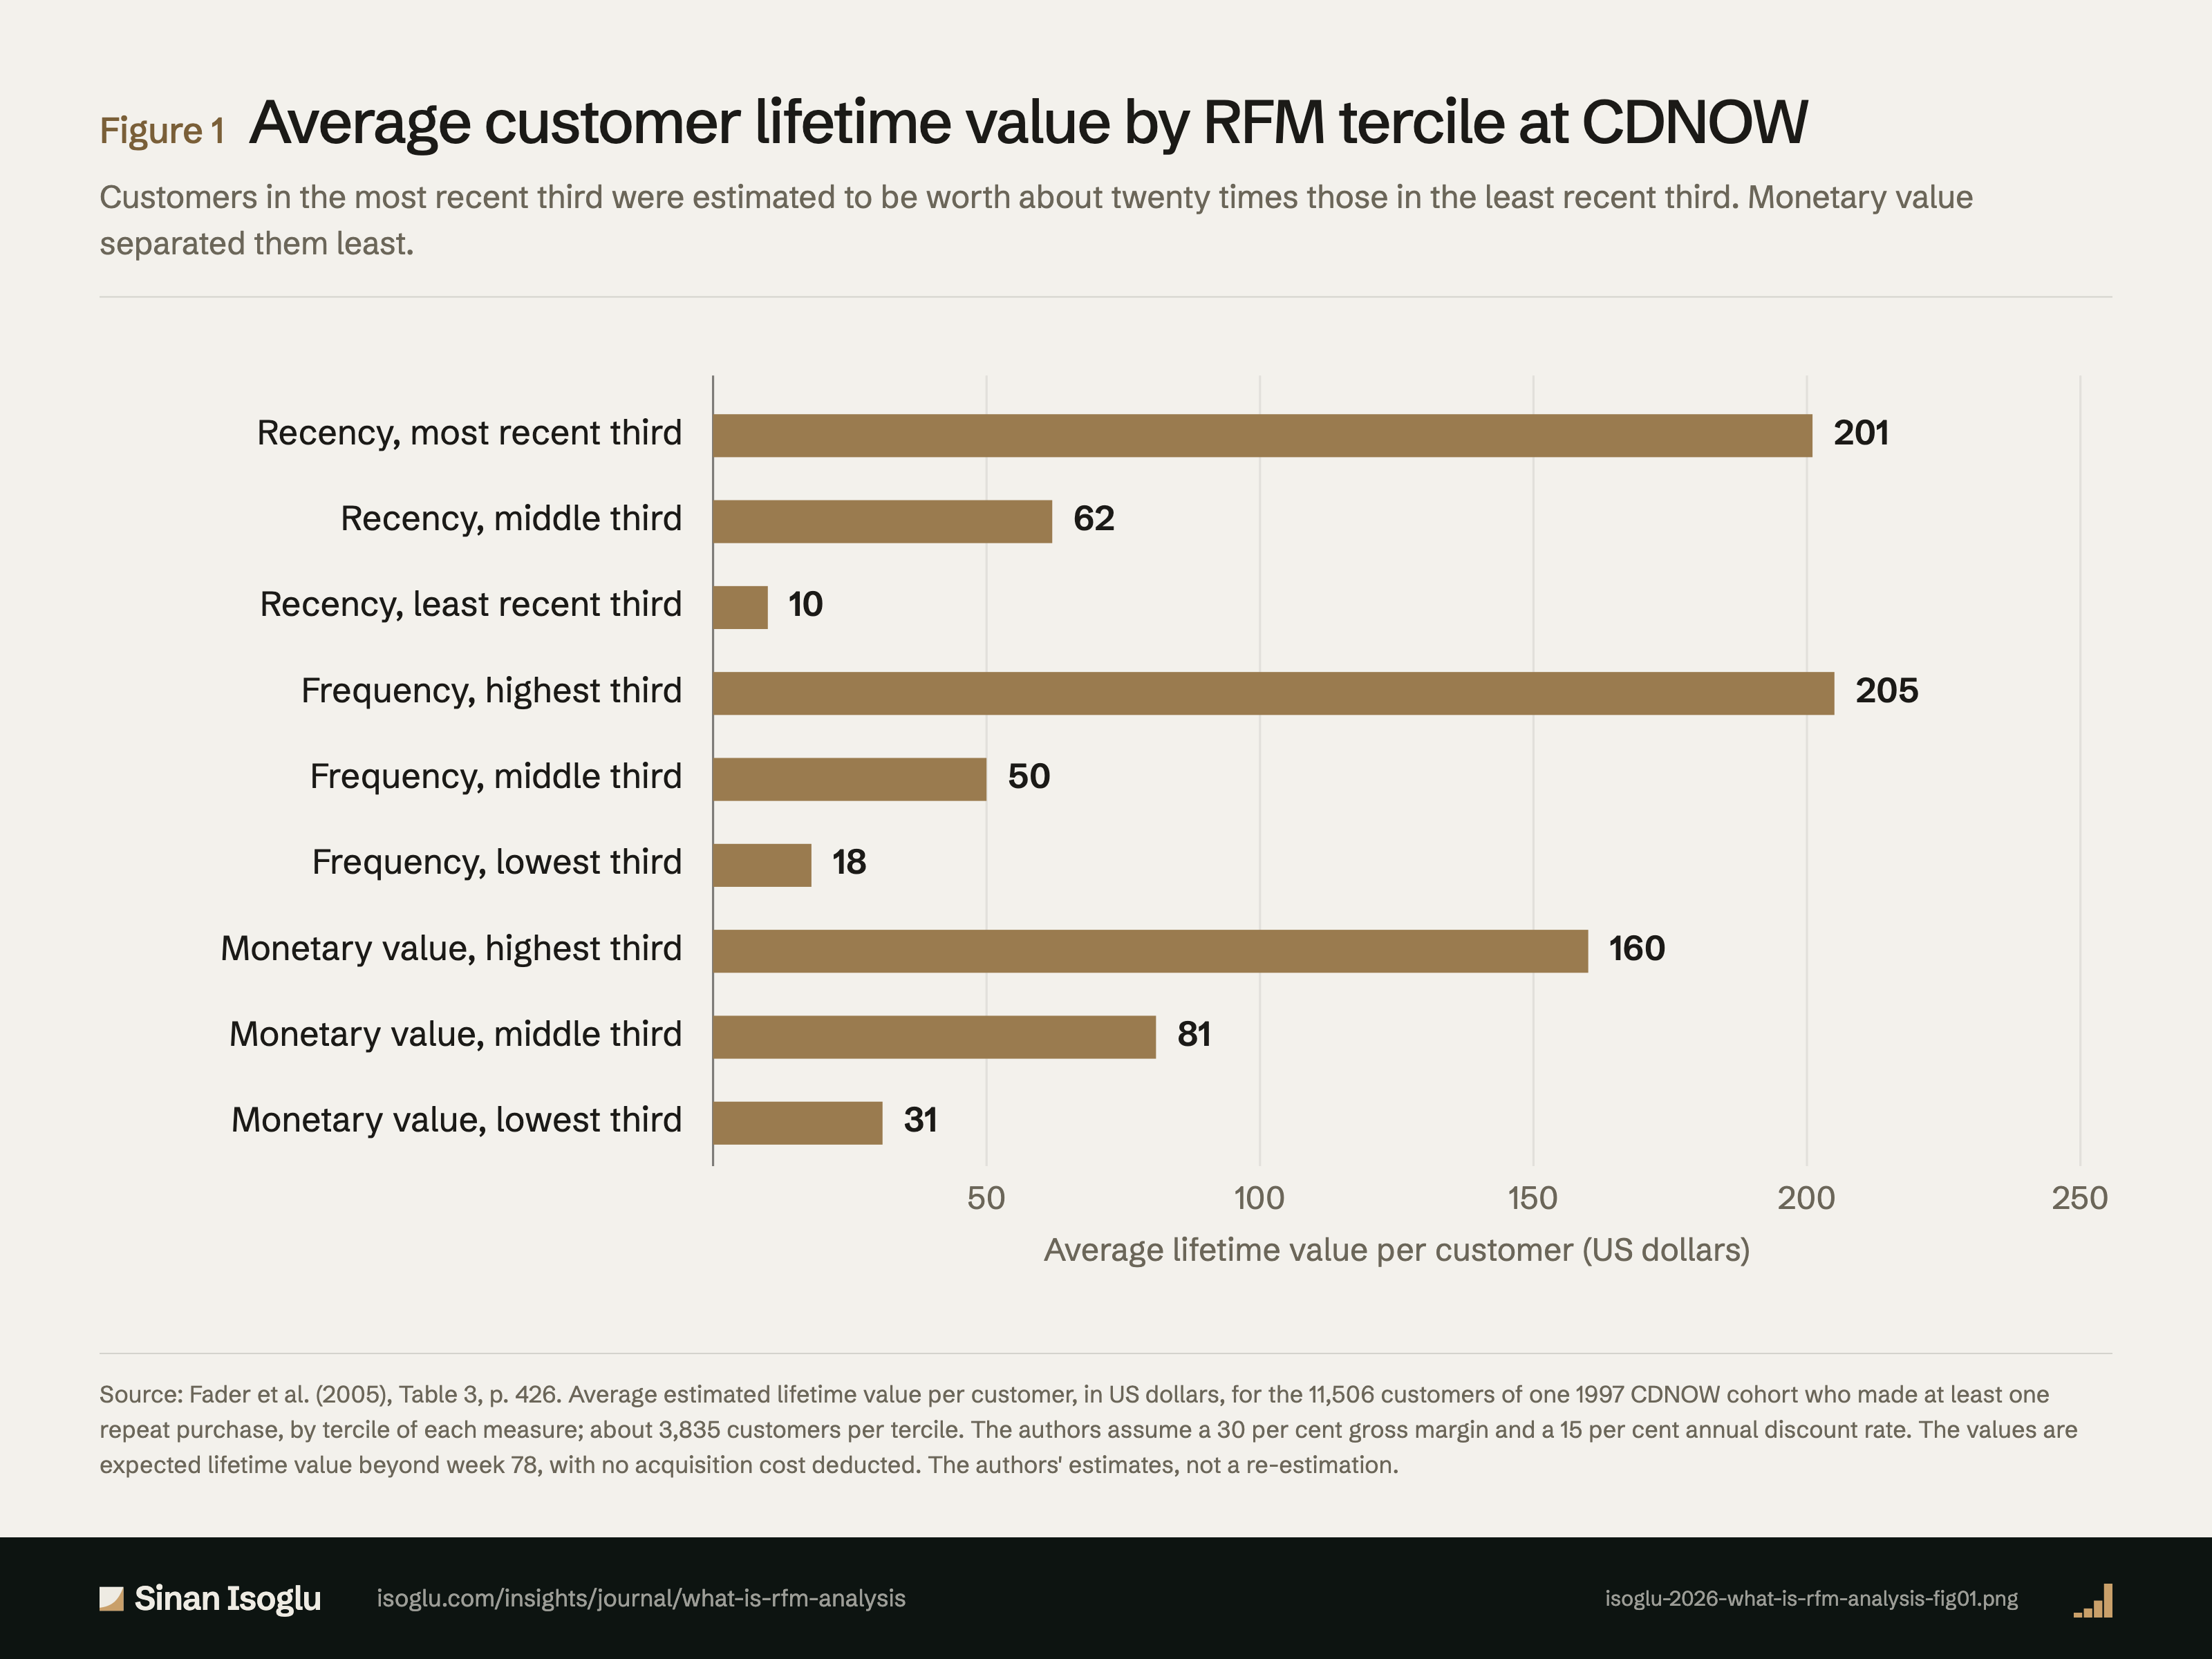
Abbildung 1Grafik
Durchschnittlicher Customer Lifetime Value je RFM-Drittel bei CDNOW
Was ist eine RFM-Analyse?
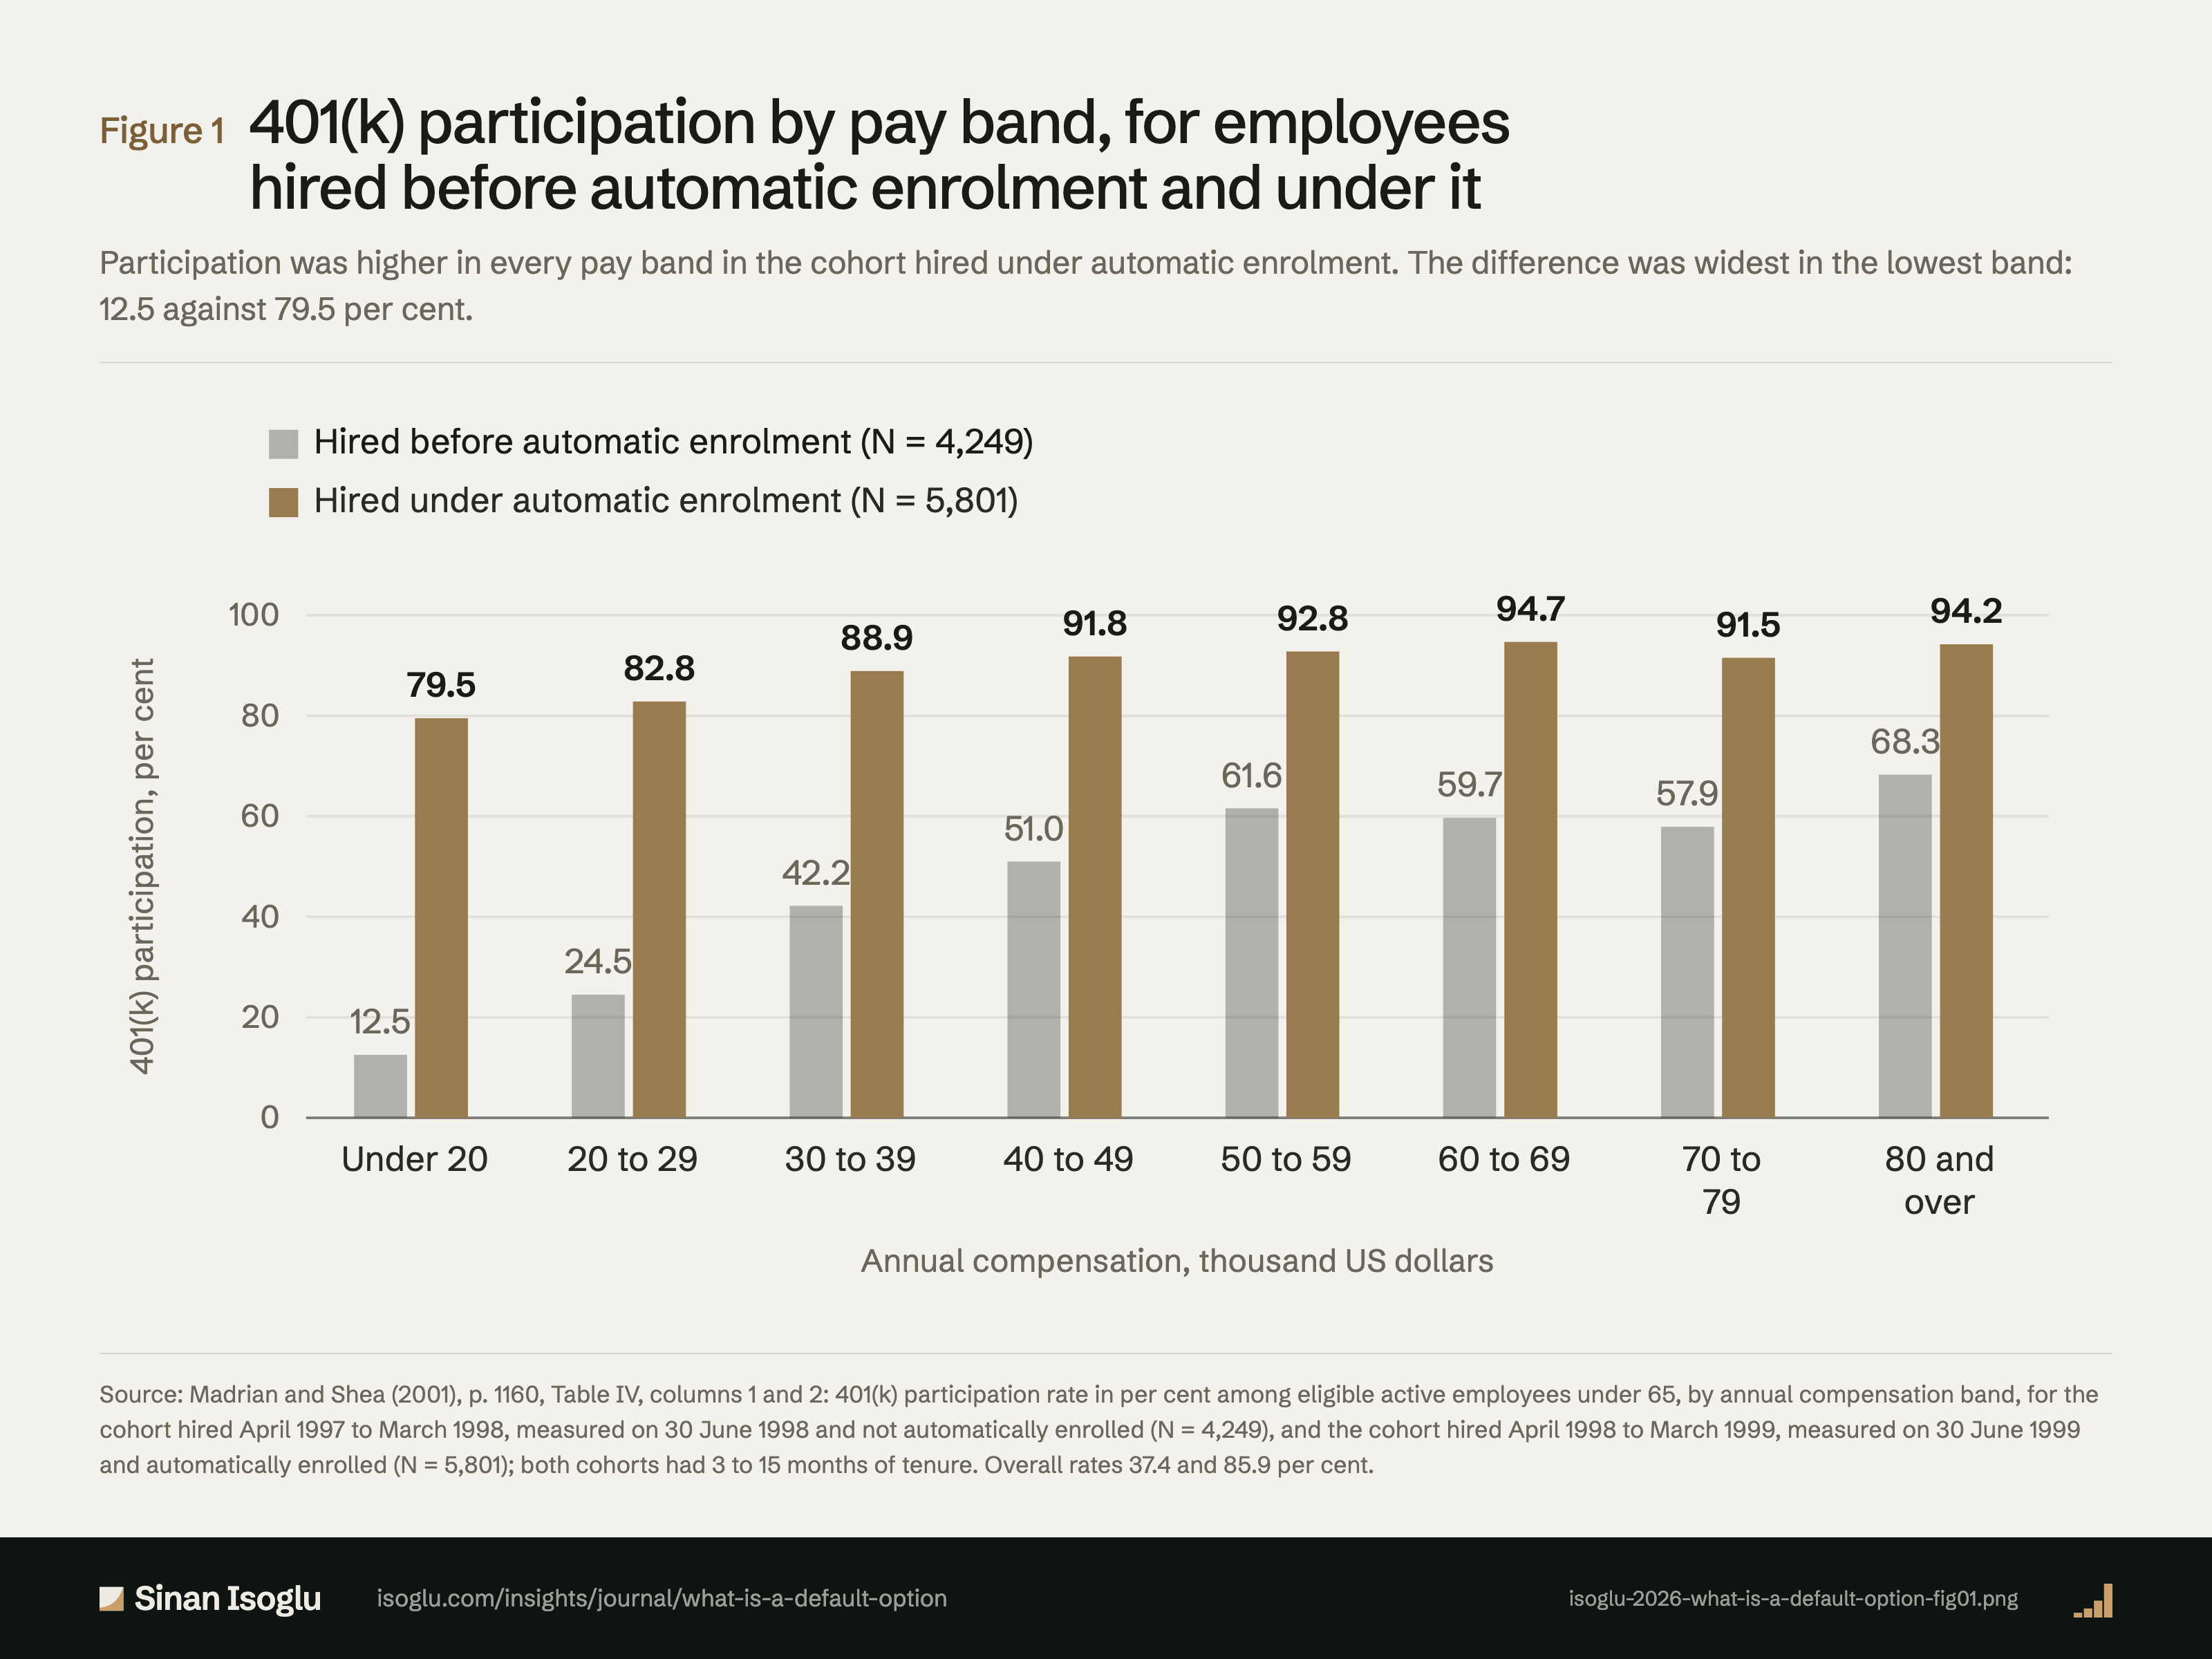
Abbildung 1Grafik
Teilnahme am 401(k)-Plan nach Vergütungsstufe, für vor und unter der automatischen Aufnahme Eingestellte
Was ist eine Voreinstellung?
Kontakt
Schicken Sie die Frage, an der Sie arbeiten.
Forschung, ein Gastvortrag oder eine Frage aus der Praxis.