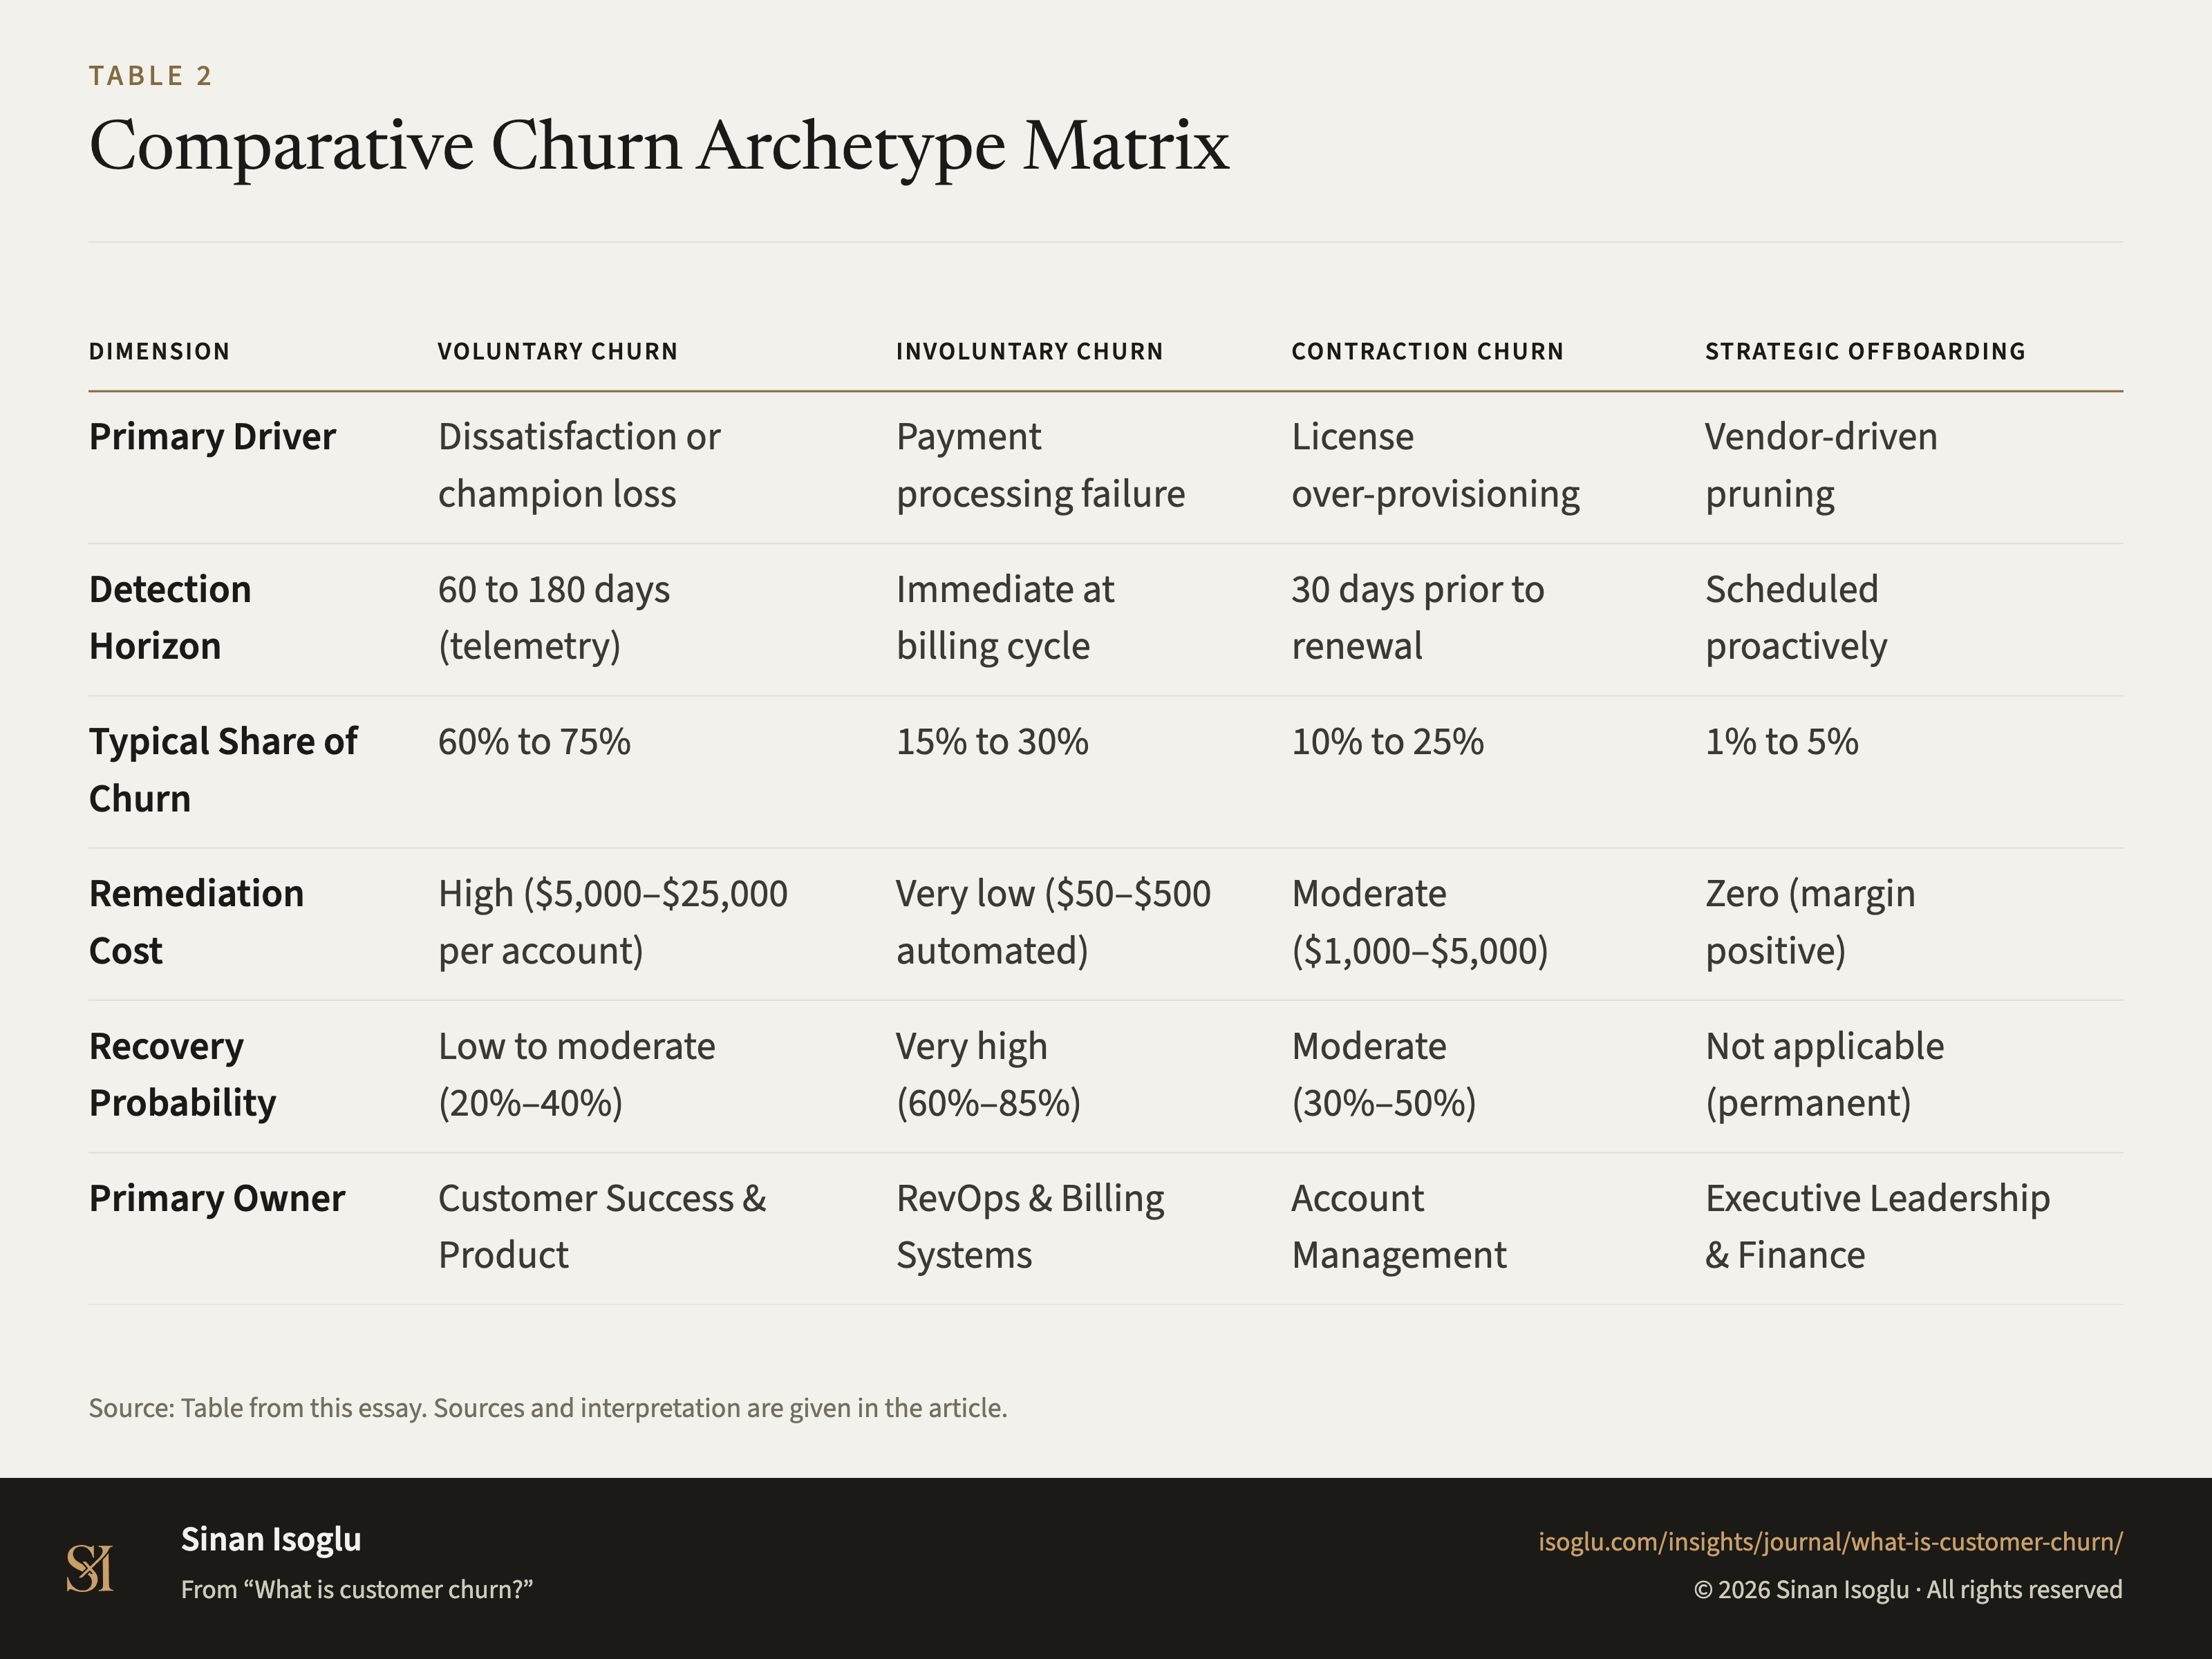
Table 1Comparative Churn Archetype Matrix
| Dimension | Voluntary Churn | Involuntary Churn | Contraction Churn | Strategic Offboarding |
|---|---|---|---|---|
| Primary Driver | Dissatisfaction or champion loss | Payment processing failure | License over-provisioning | Vendor-driven pruning |
| Detection Horizon | 60 to 180 days (telemetry) | Immediate at billing cycle | 30 days prior to renewal | Scheduled proactively |
| Typical Share of Churn | 60% to 75% | 15% to 30% | 10% to 25% | 1% to 5% |
| Remediation Cost | High (\$5,000–\$25,000 per account) | Very low (\$50–\$500 automated) | Moderate (\$1,000–\$5,000) | Zero (margin positive) |
| Recovery Probability | Low to moderate (20%–40%) | Very high (60%–85%) | Moderate (30%–50%) | Not applicable (permanent) |
| Primary Owner | Customer Success & Product | RevOps & Billing Systems | Account Management | Executive Leadership & Finance |
Swipe or scroll horizontally if the table is wider than your screen.
Source: Table from this essay. Sources and interpretation are given in the article.
PNG4:3, 1600 × 1200, with the title, the source line and the attribution set in the image isoglu-2026-what-is-customer-churn-fig03.png
From the essay
Growth that compounds
What is customer churn?
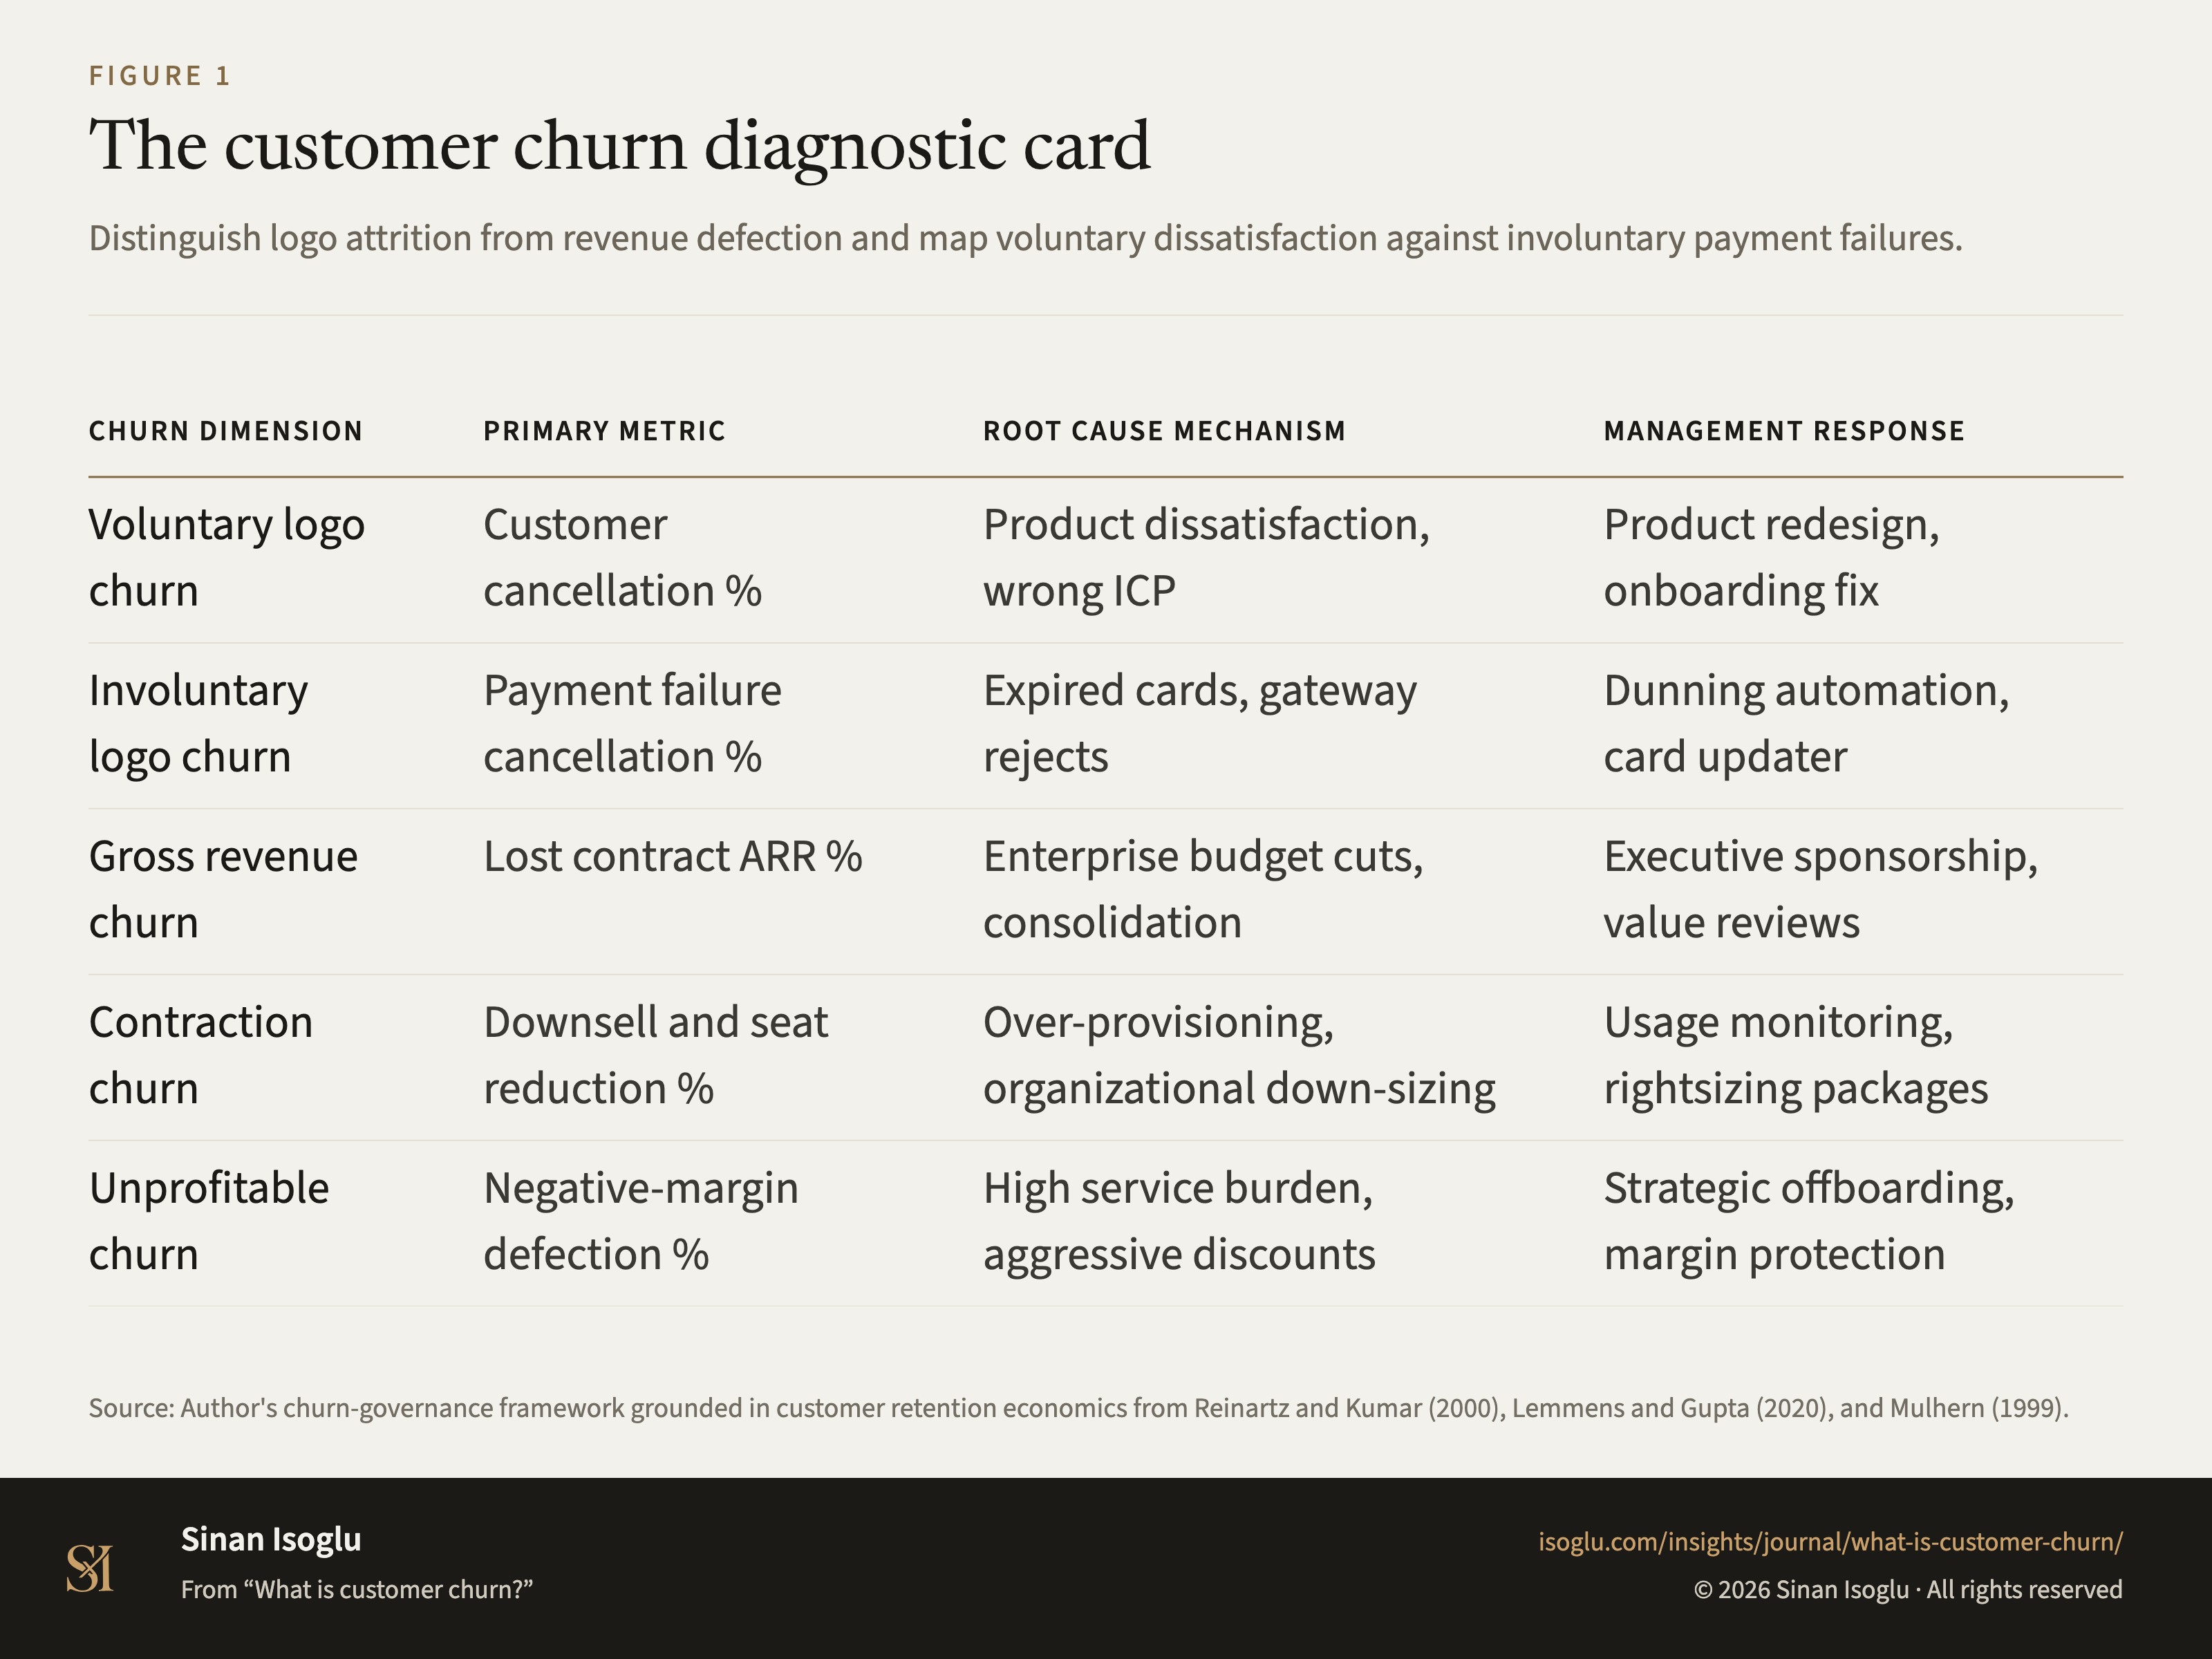
Customer churn measures account and revenue defection over a defined window. Separate logo churn from revenue churn and voluntary from involuntary loss.
Read the essayThis exhibit belongs to an essay: the numbers live here, the argument lives there.
Cite or embed
Contact
Bring the question you're working on.
Research, a guest lecture, or a commercial question.