Figure 1From “What is cohort analysis? A stable entry event before a retention curve”
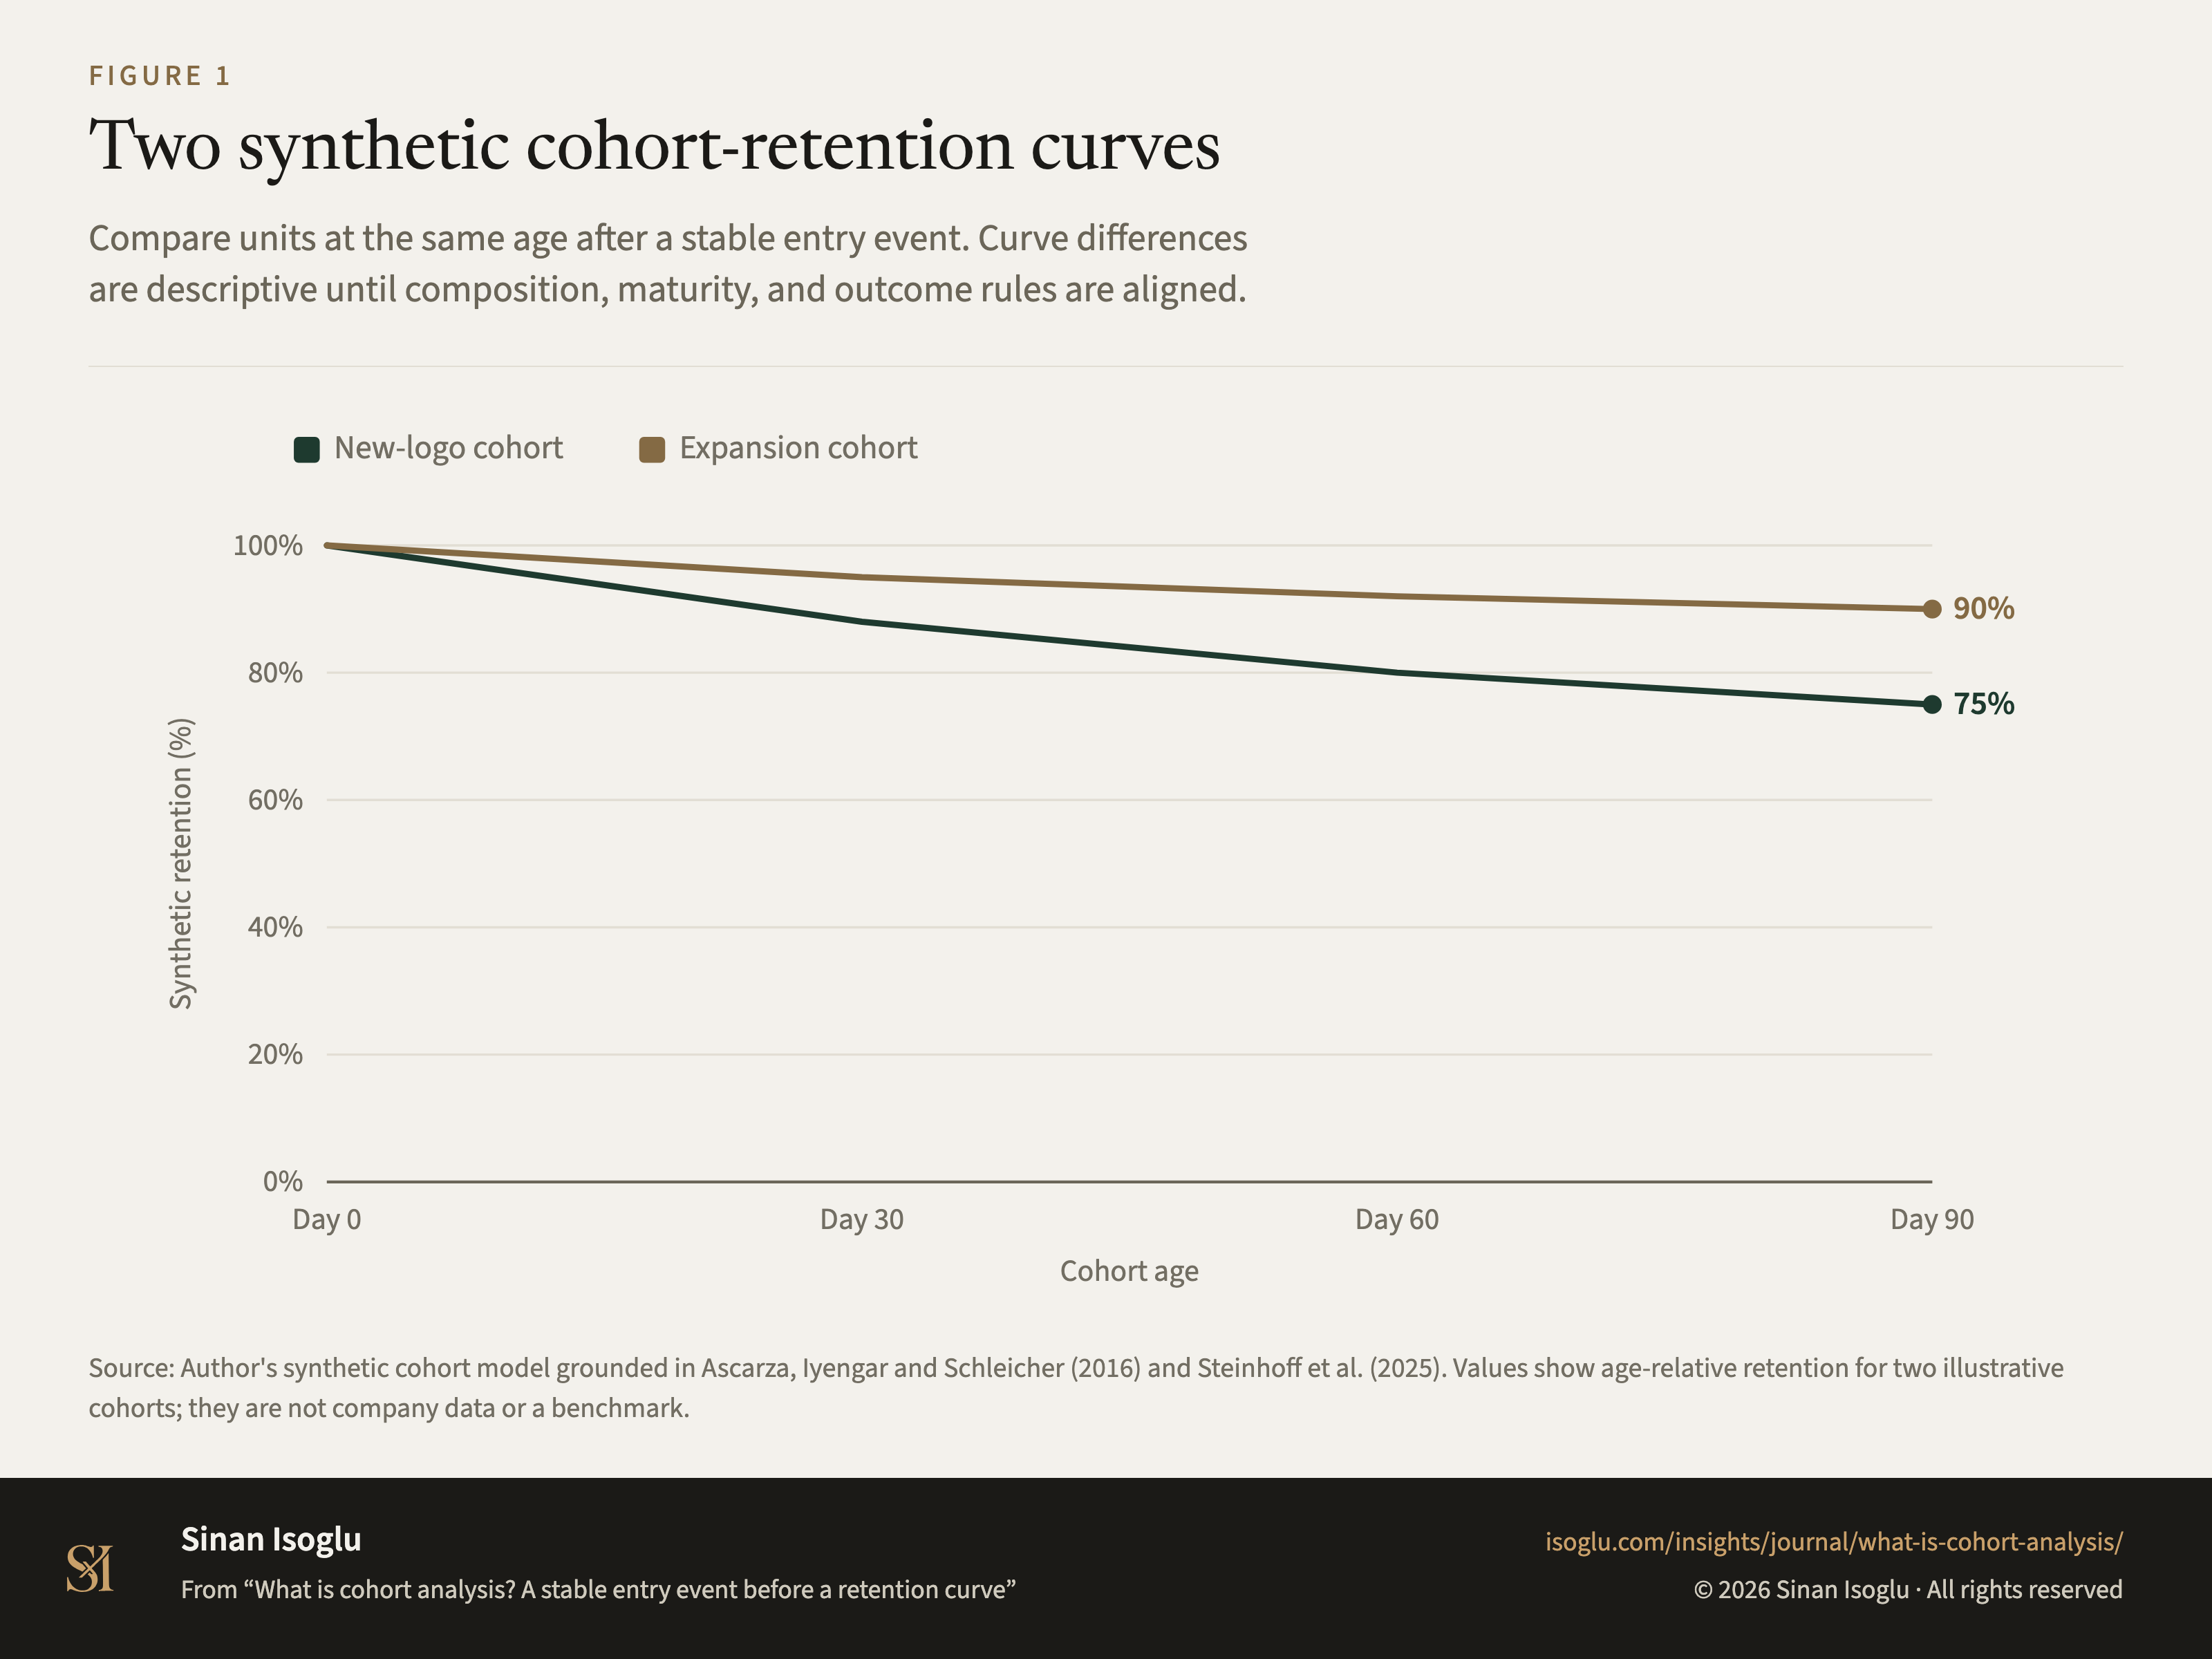
Two synthetic cohort-retention curves
Compare units at the same age after a stable entry event. Curve differences are descriptive until composition, maturity, and outcome rules are aligned.
Figure 1Two synthetic cohort-retention curves
Source: Author's synthetic cohort model grounded in Ascarza, Iyengar and Schleicher (2016) and Steinhoff et al. (2025). Values show age-relative retention for two illustrative cohorts; they are not company data or a benchmark.
Source and evidence
Each line names a claim related to this exhibit, its source, and how it was checked.
- B G02-OWN-C1 Cohort analysis groups units by a declared entry event and compares outcomes at the same relative ageAuthor framework grounded in AIS16-C1, AIS16-C2, and PV1R-C4
- B G02-OWN-C2 A cohort comparison keeps grain, entry event, composition, age, outcome, denominator, and maturity visibleAuthor record design
- B G02-OWN-C3 Retention at a declared age is units remaining at that age divided by eligible units at entryAuthor formula
Grades: A, verified against the printed page of the primary source · B, primary source, text layer only · C, authoritative secondary · D, reported.
From the essay
Growth that compounds
What is cohort analysis? A stable entry event before a retention curve
Cohort analysis aligns units by a declared entry event and age. Define the cohort, outcome, maturity rule, and denominator before reading the curve.
Read the essayThis exhibit belongs to an essay: the numbers live here, the argument lives there.
Cite or embed
Related exhibits
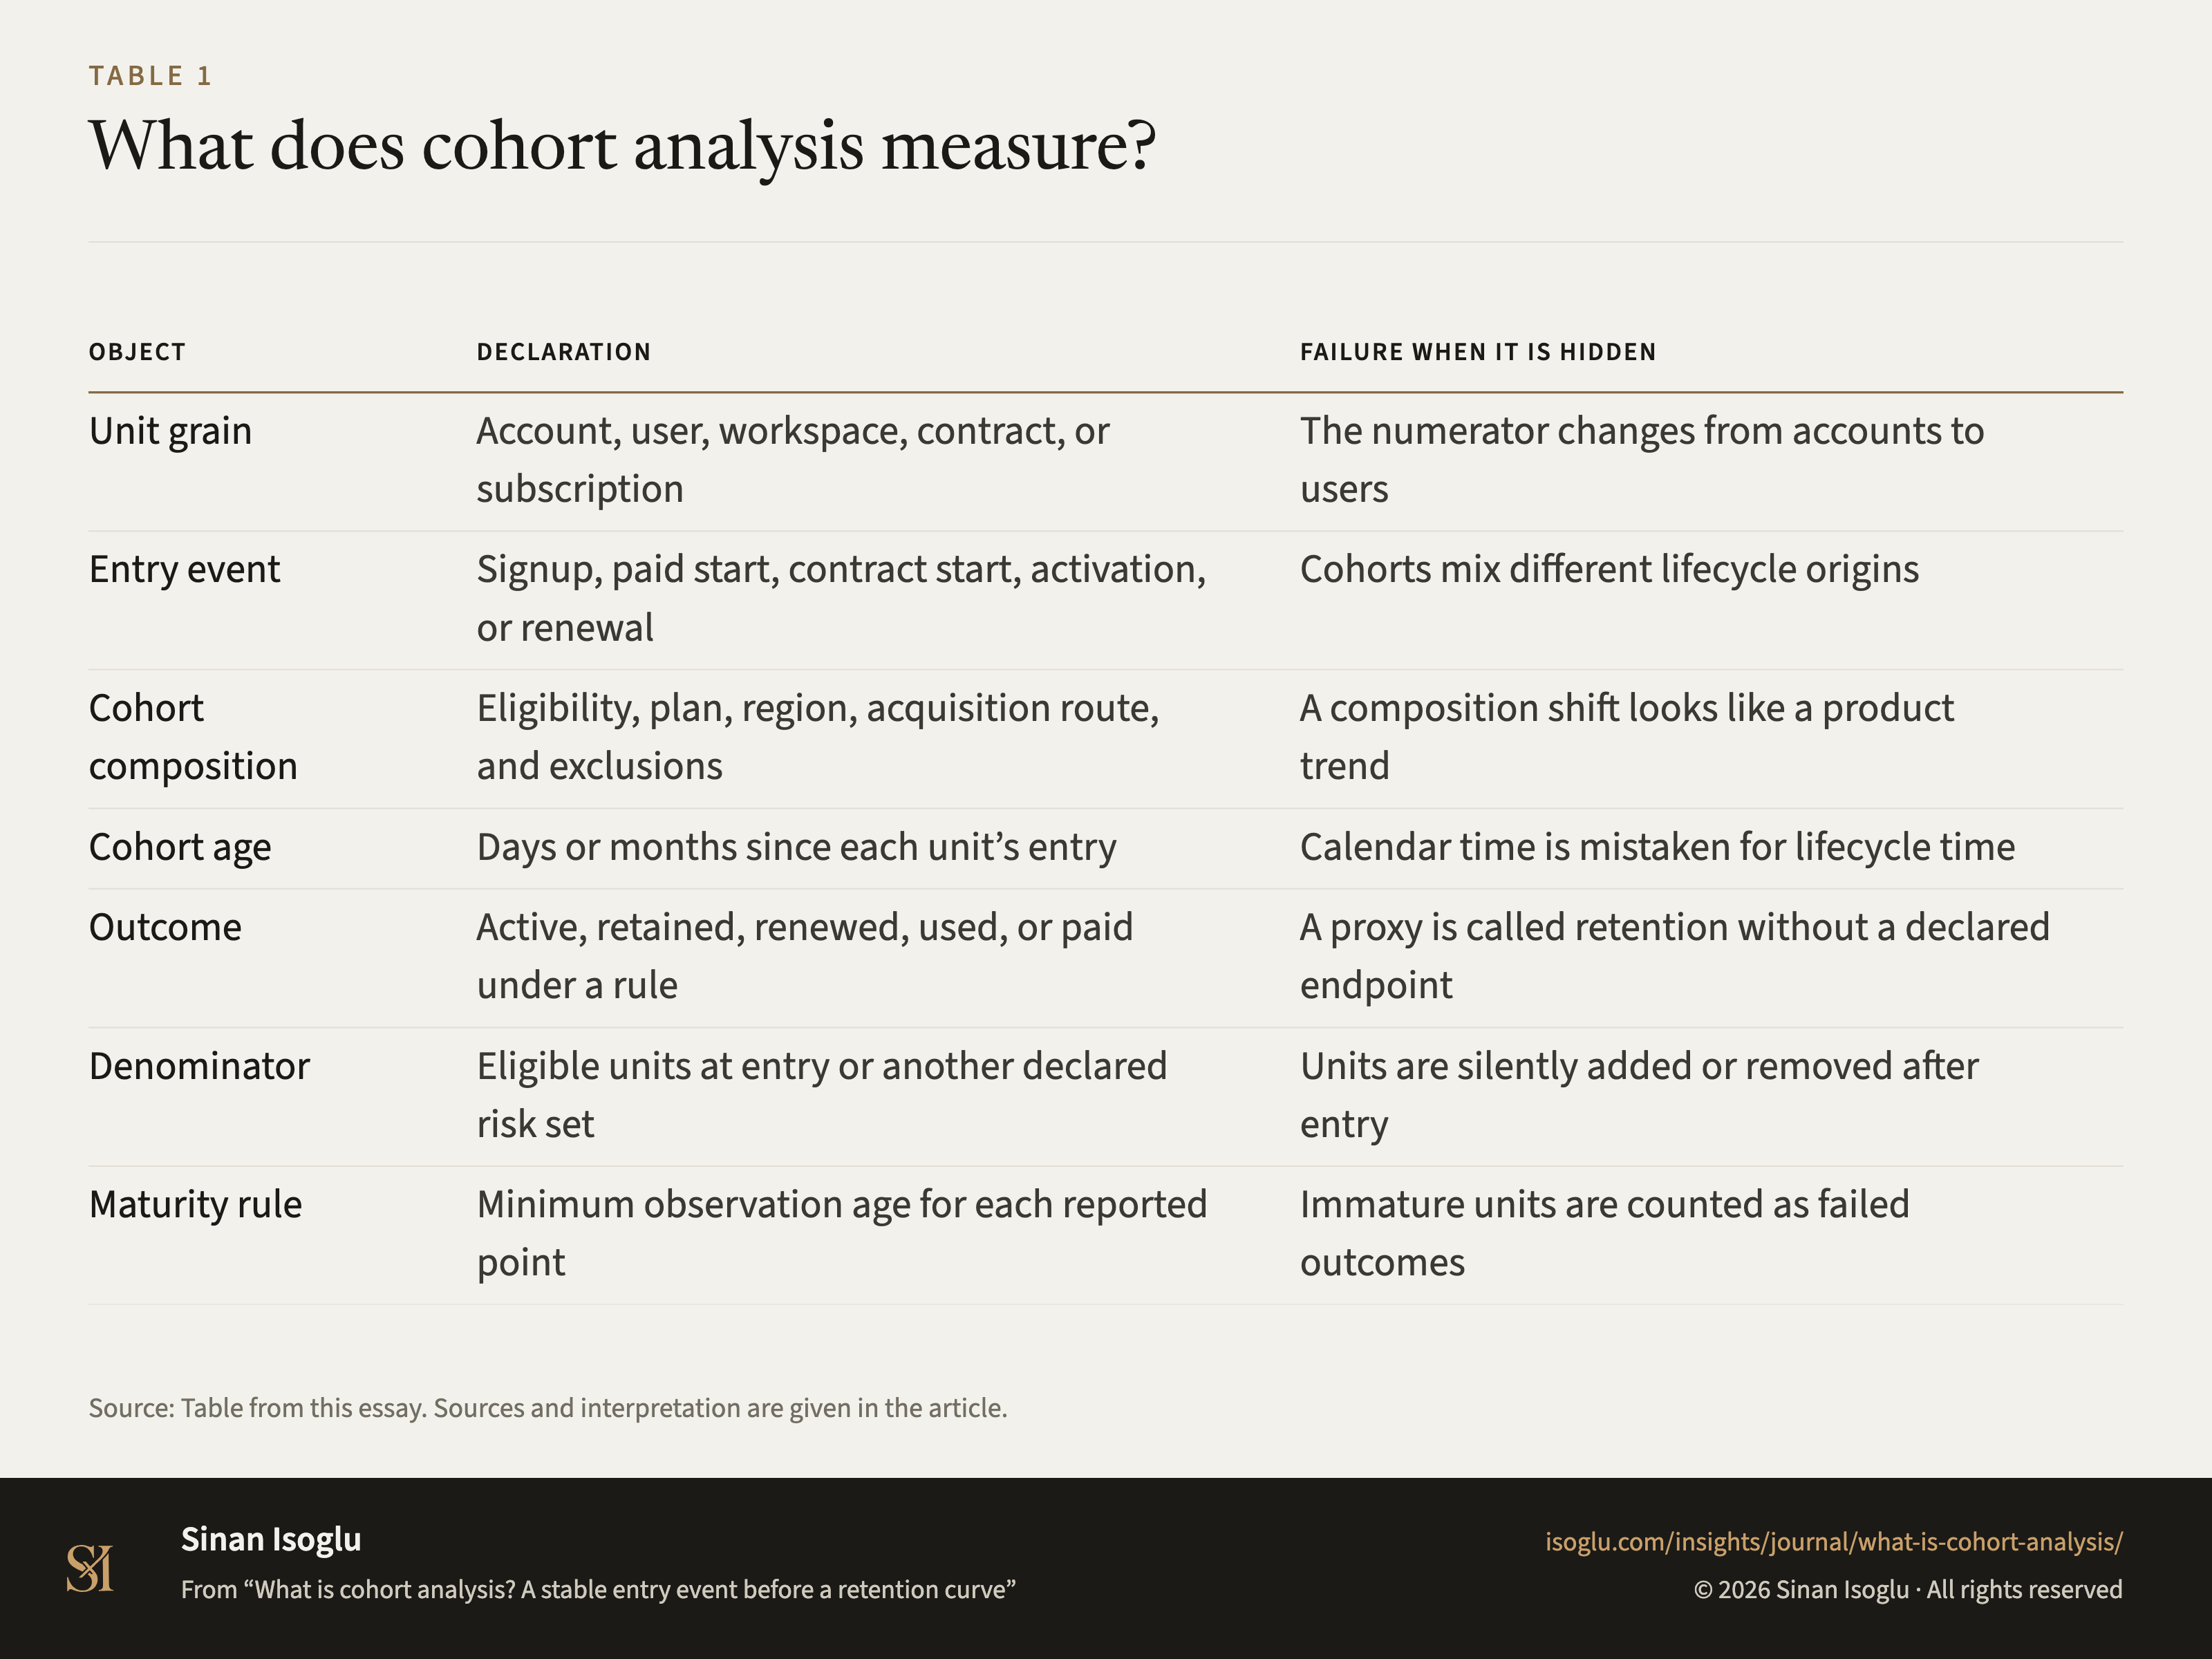
Table 1Table
What does cohort analysis measure?
What is cohort analysis? A stable entry event before a retention curve
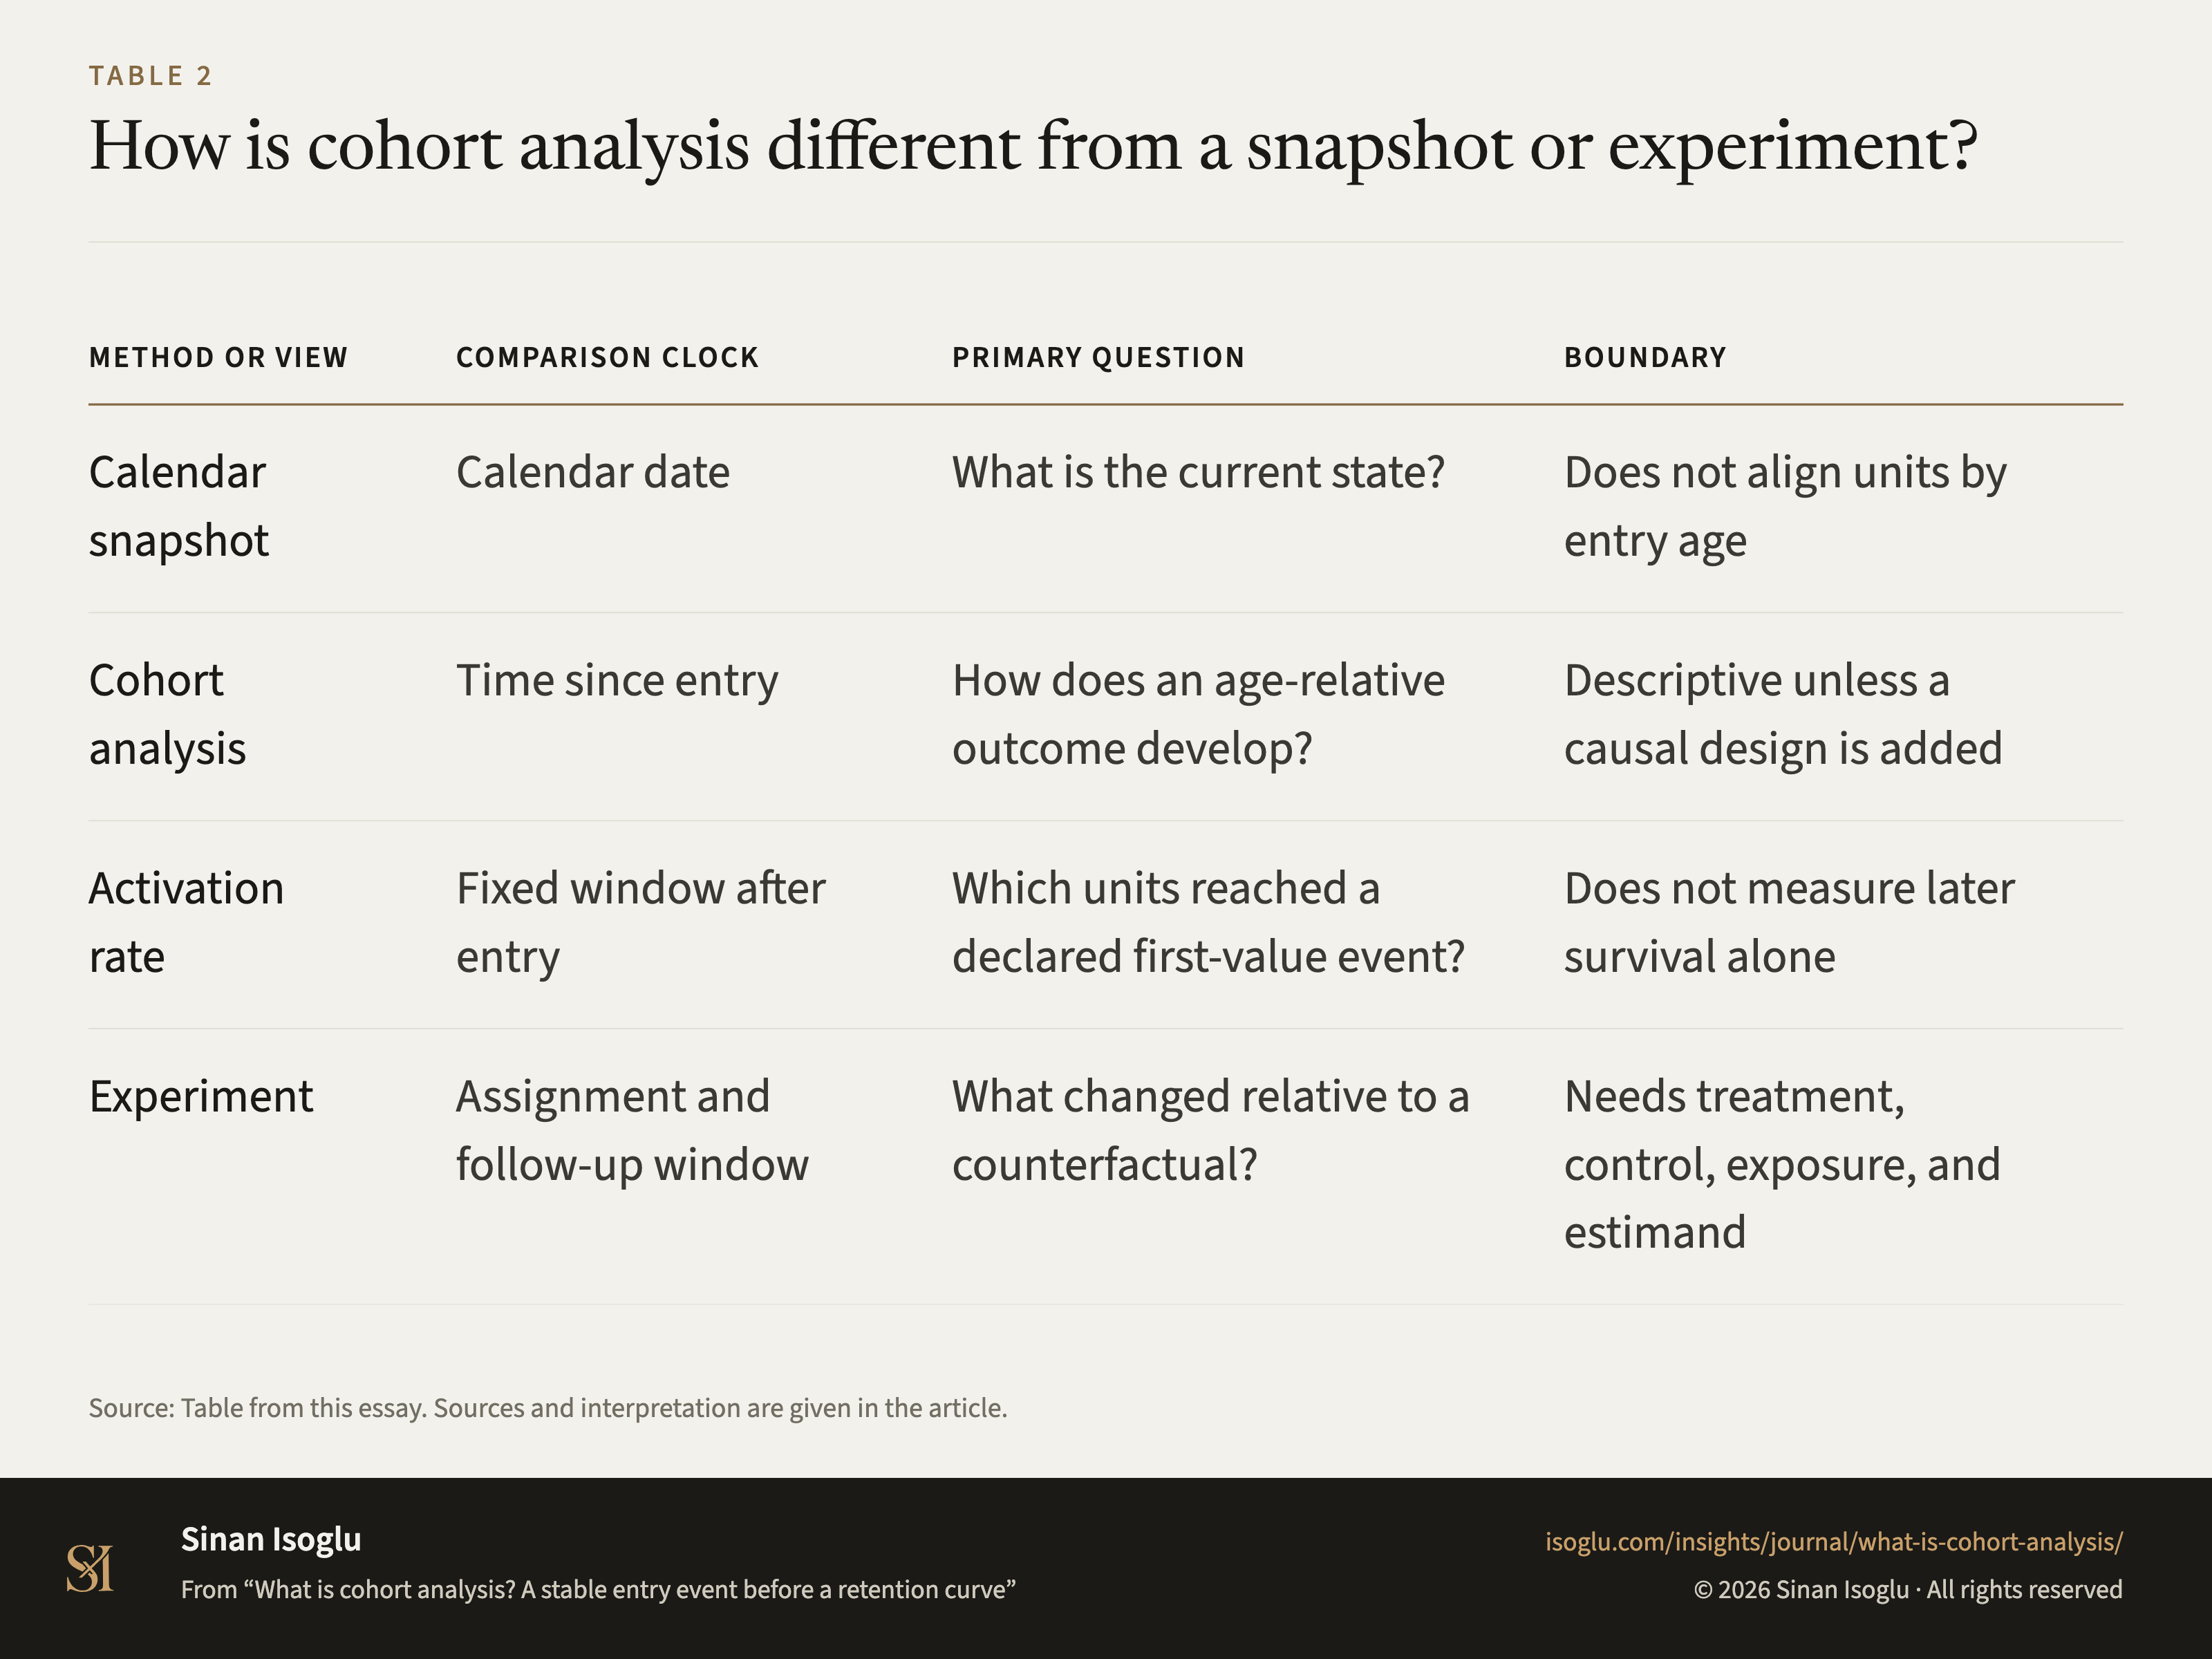
Table 2Table
How is cohort analysis different from a snapshot or experiment?
What is cohort analysis? A stable entry event before a retention curve
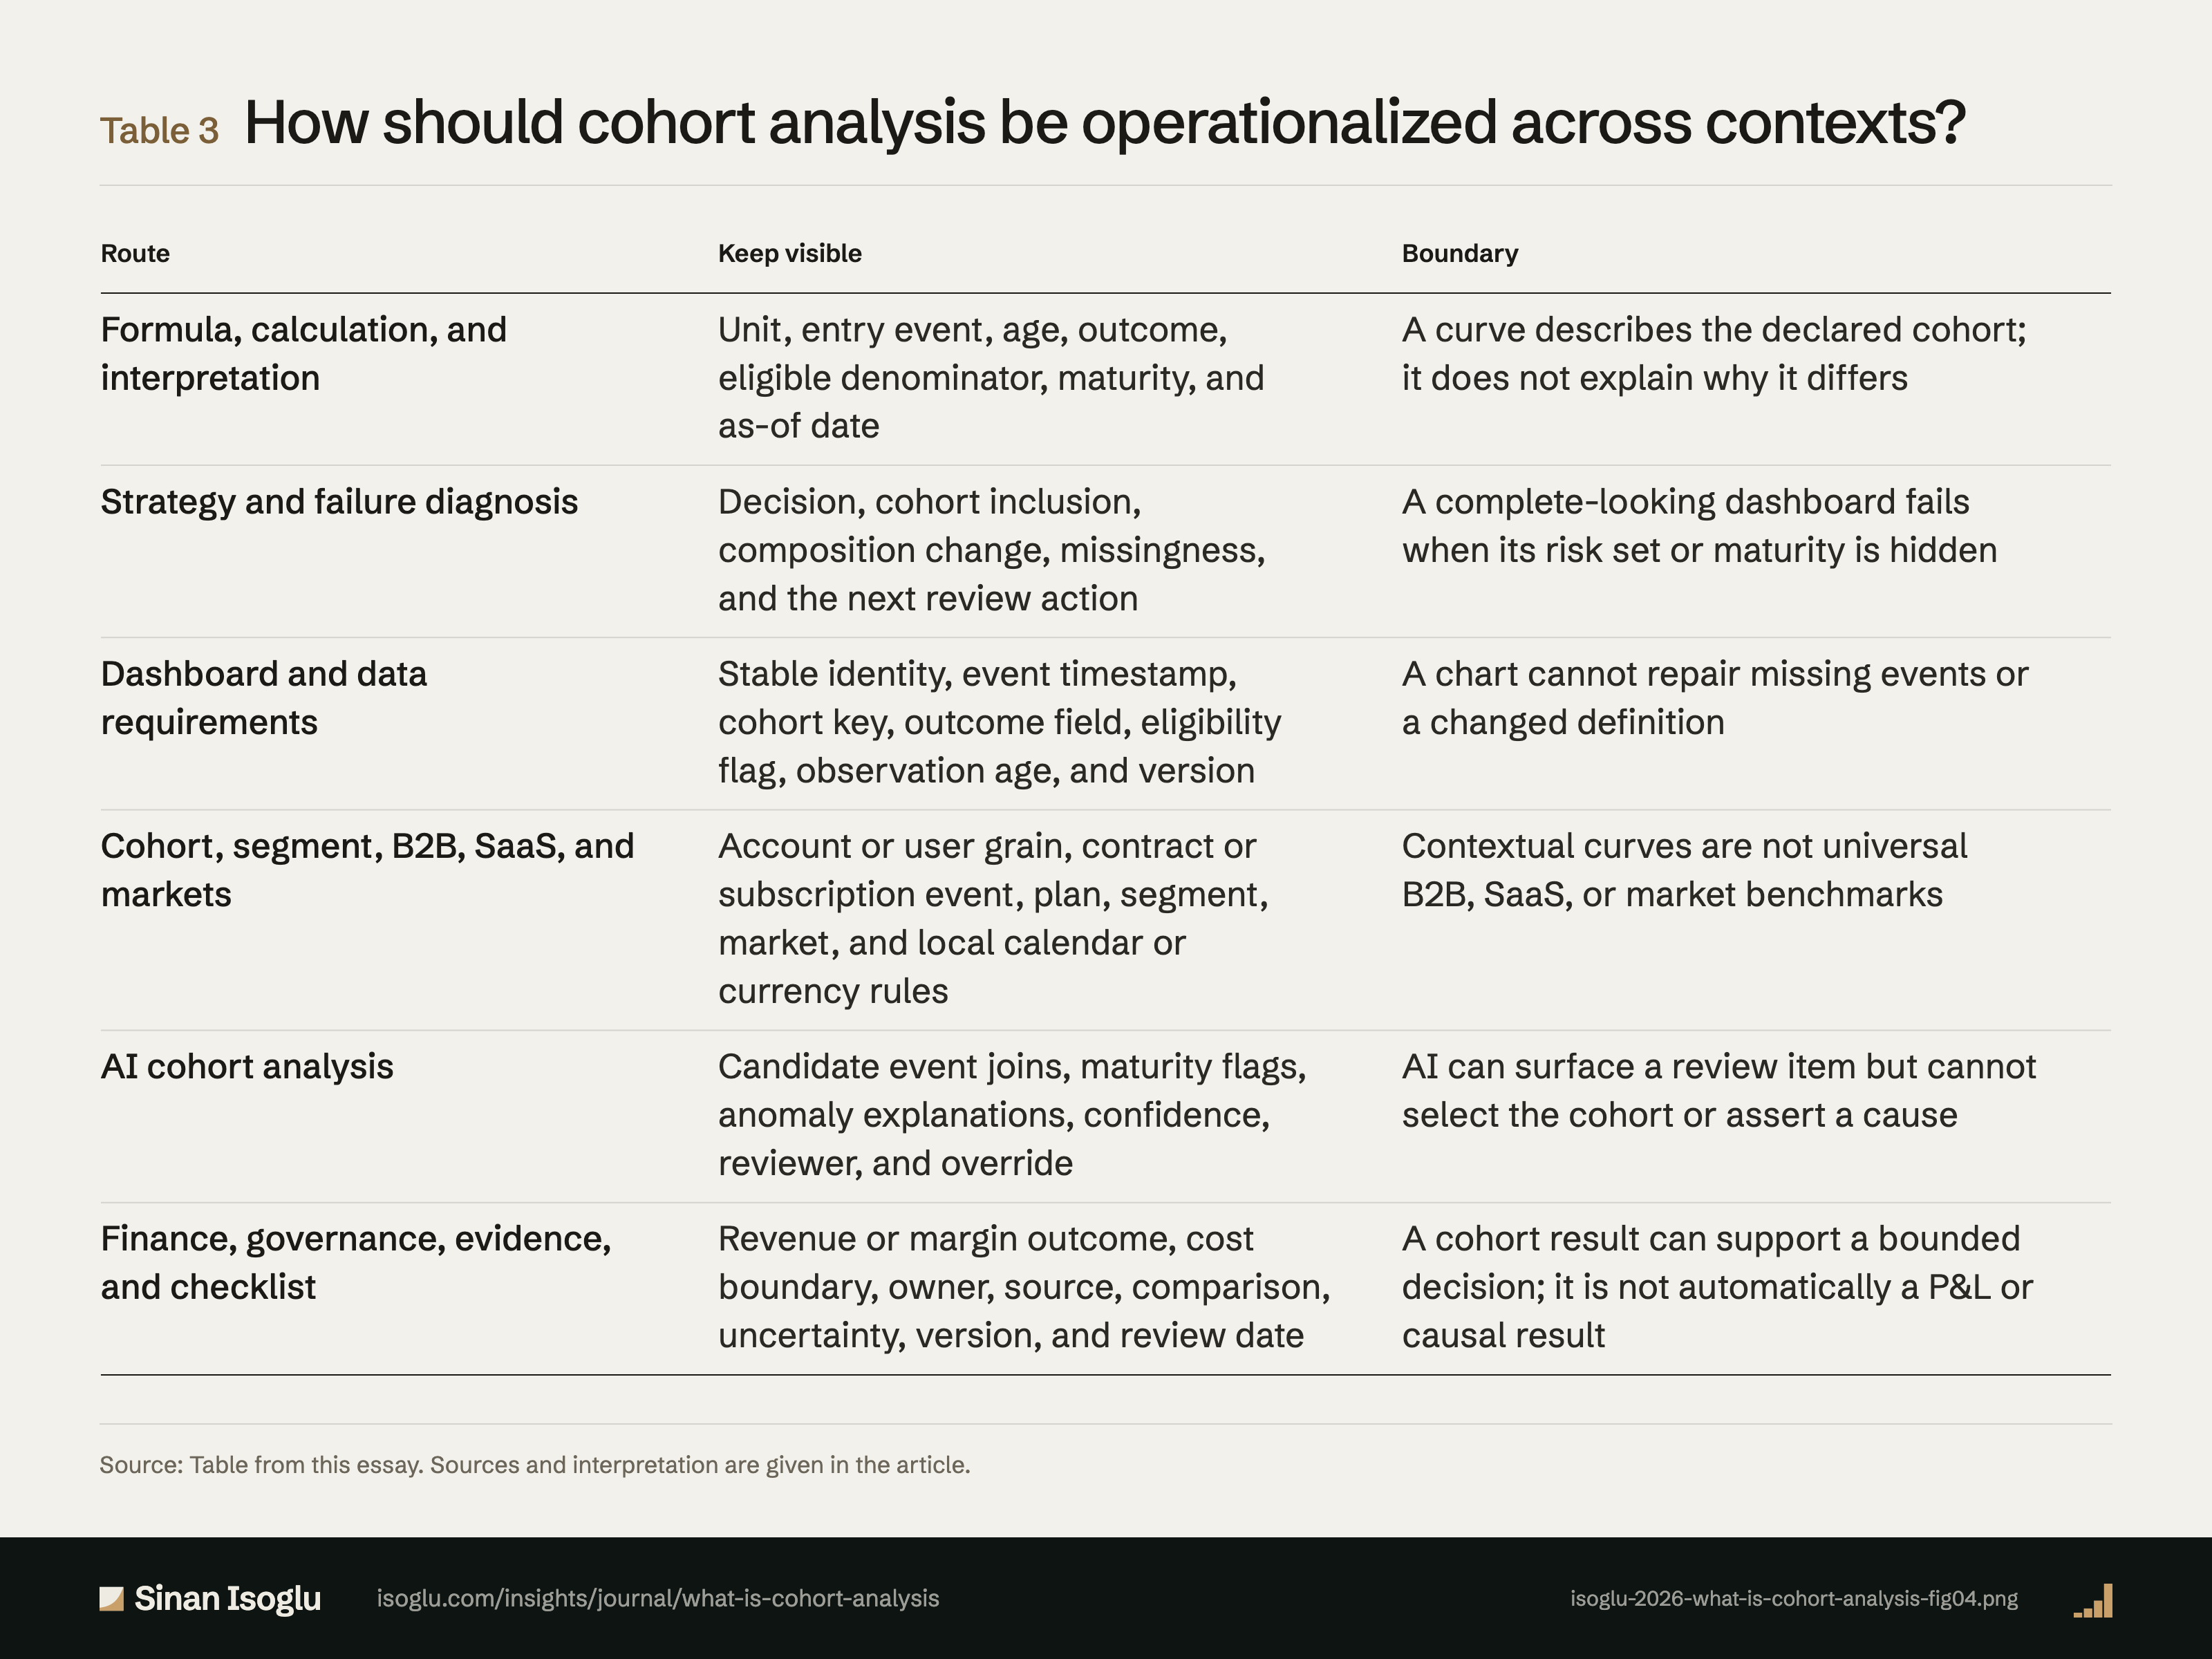
Table 3Table
How should cohort analysis be operationalized across contexts?
What is cohort analysis? A stable entry event before a retention curve
Contact
Bring the question you're working on.
Research, a guest lecture, or a commercial question.