Figure 1From “What is AI demand forecasting? A forecast is a system, not an oracle”
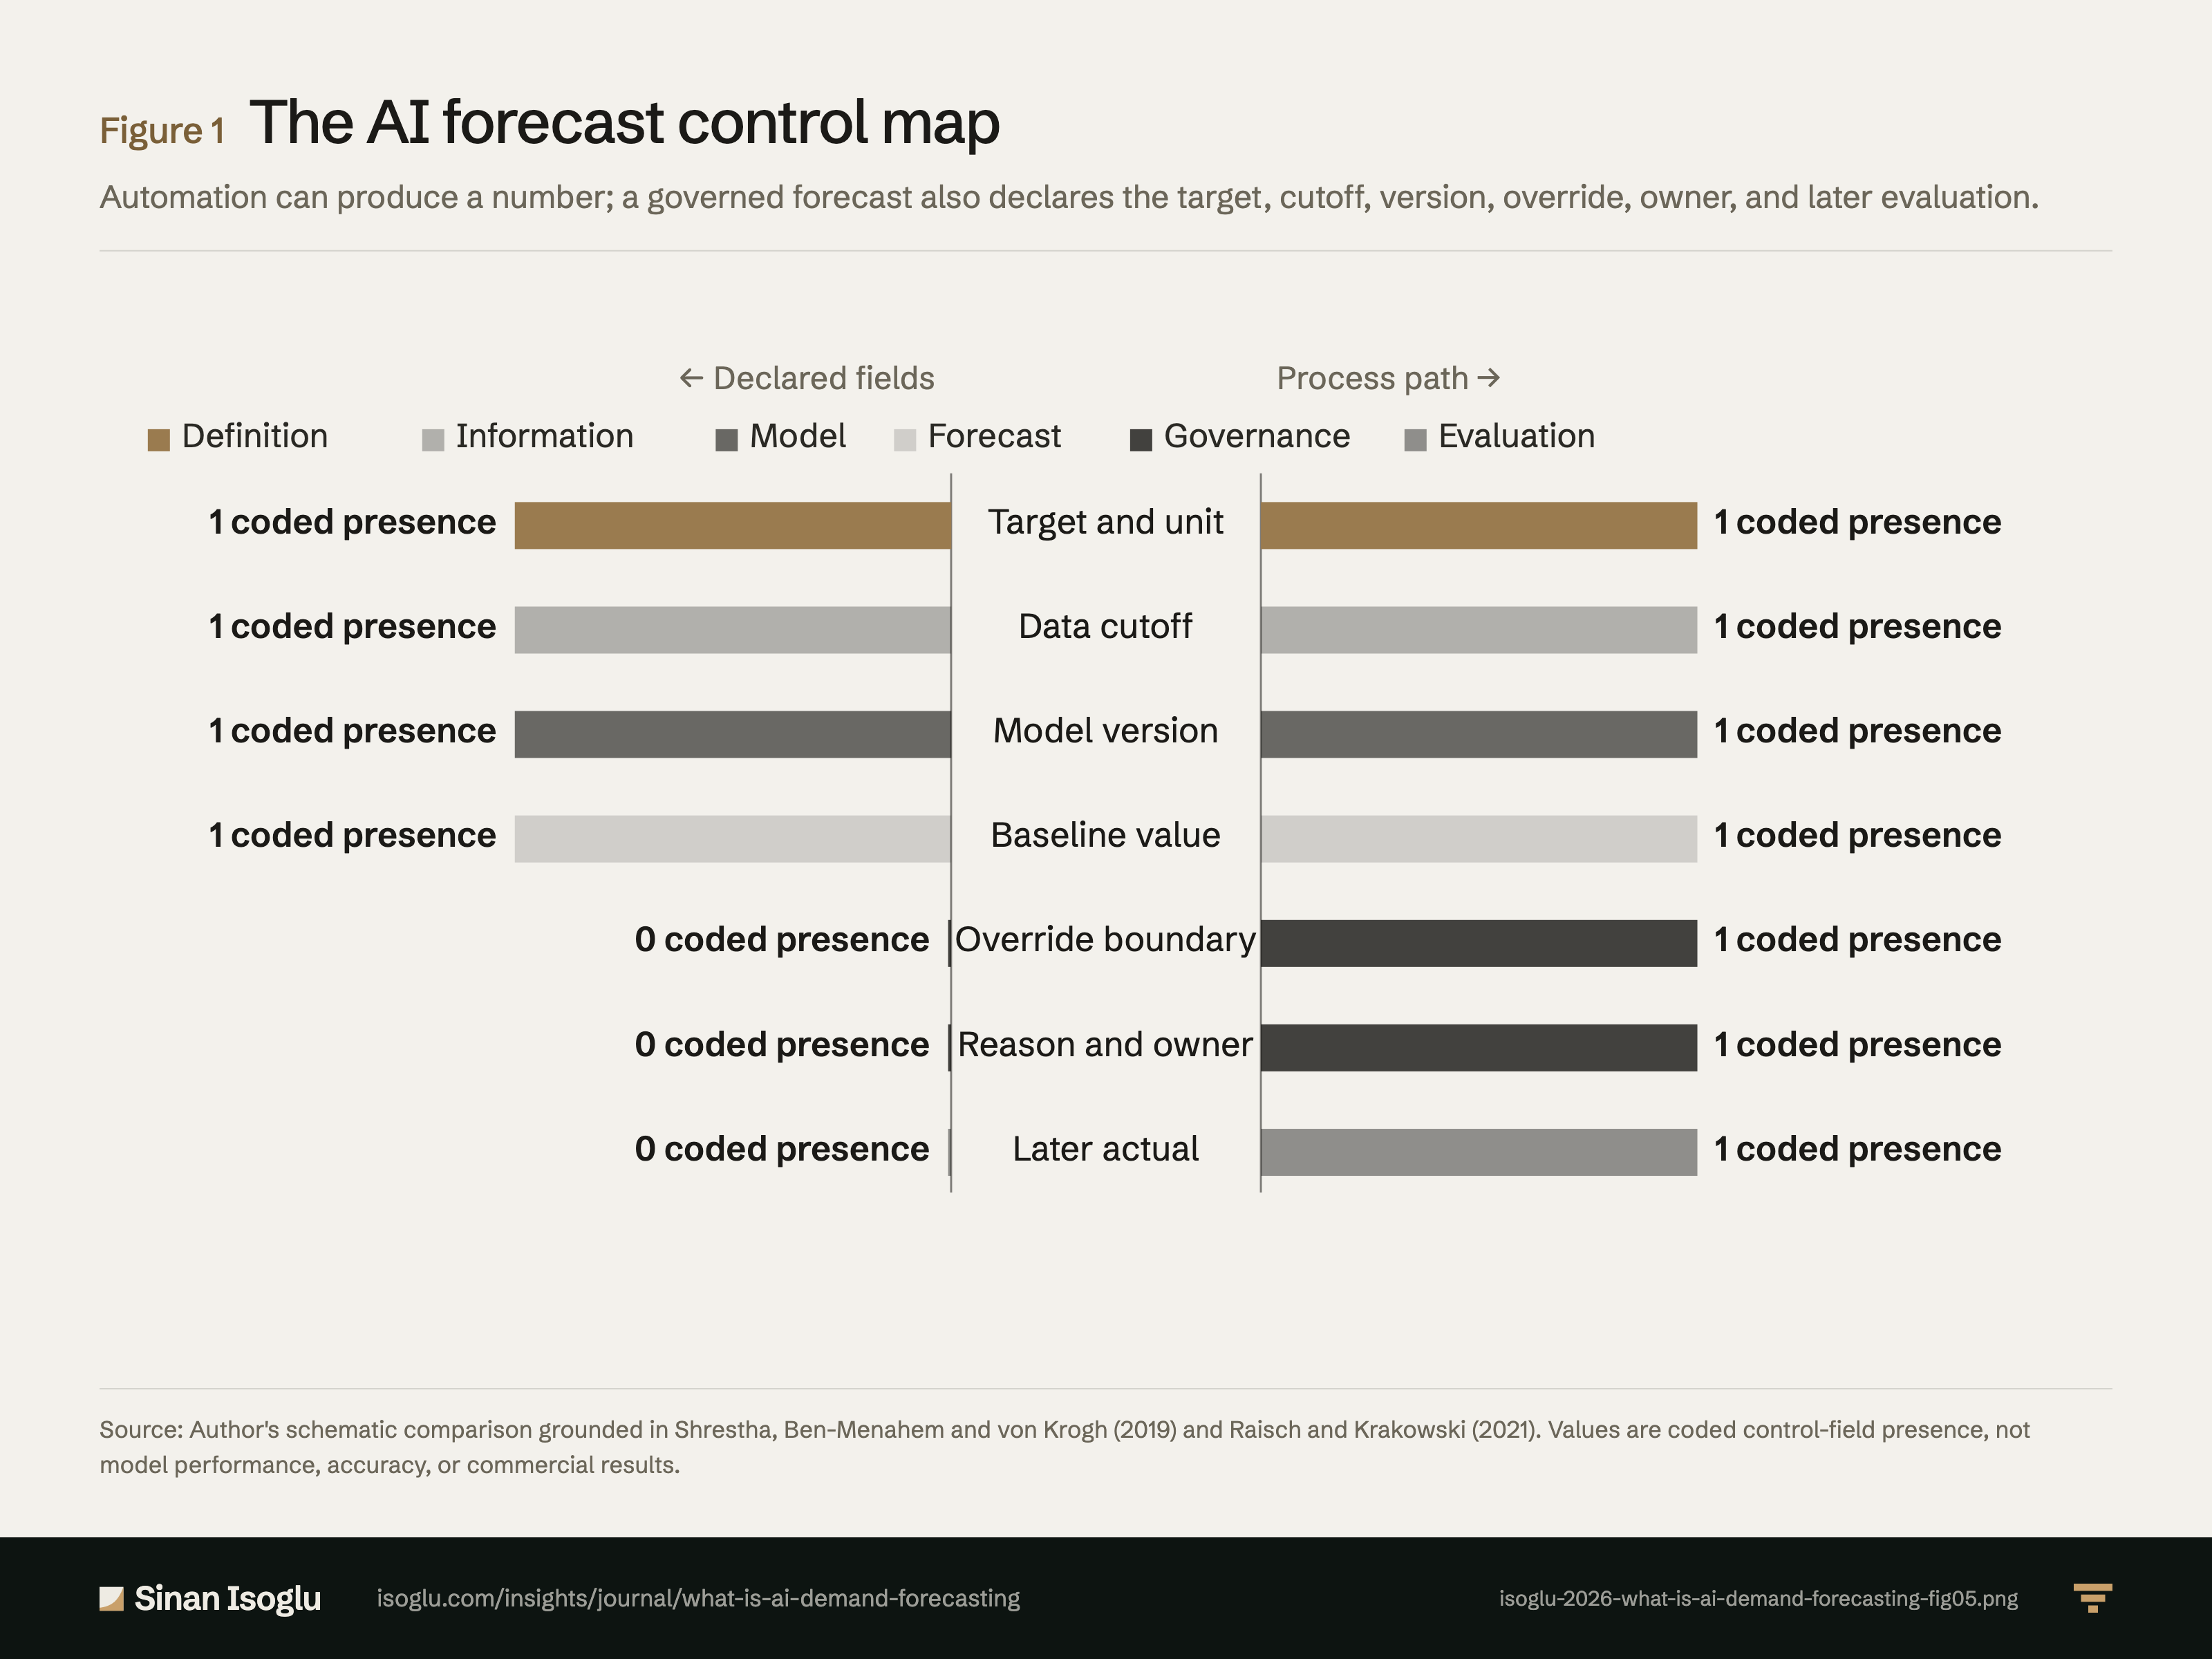
The AI forecast control map
Automation can produce a number; a governed forecast also declares the target, cutoff, version, override, owner, and later evaluation.
Figure 1The AI forecast control map
Source: Author's schematic comparison grounded in Shrestha, Ben-Menahem and von Krogh (2019) and Raisch and Krakowski (2021). Values are coded control-field presence, not model performance, accuracy, or commercial results.
Source and evidence
Each line names a claim related to this exhibit, its source, and how it was checked.
- A SBK19-C1 The five, named: "five key contingency factors specificity of the decision search space interpretability of the decisionmaking process and outcome size of the alternative set decision making speed and replicability"Shrestha, Ben-Menahem & von Krogh. (2019)
- A SBK19-C2 The factors are a comparison frame, not a ranking: the article "identifies the idiosyncrasies of human and ai based decision making along five key contingency factors", so different combinations imply different splits of the workShrestha, Ben-Menahem & von Krogh. (2019)
- A RAI21-C1 The two concepts, defined: "whereas automation implies that machines take over a human task, augmentation means that humans collaborate closely with machines to perform a task"Raisch & Krakowski. (2021)
- A RAI21-C3 "if organizations adopt a broader perspective comprising both automation and augmentation they could deal with the tension and achieve comp"lementarities. A conceptual paper in AMR, so this is argued, not measuredRaisch & Krakowski. (2021)
- B V11-OWN-C1 AI demand forecasting is a forecast process in which a model uses declared data and horizon to produce a demand estimate for a named unitAuthor framework grounded in SBK19-C1 and RAI21-C1
- B V11-OWN-C2 A demand-forecasting record should preserve baseline model, input snapshot, horizon, output, confidence or interval, override, reason, and later actualAuthor operating framework
- B V11-OWN-C3 Automation, augmentation, human judgment, forecast output, and realized demand are separate objectsAuthor taxonomy grounded in RAI21-C3
- B V11-OWN-C4 AI forecast quality must be compared against a declared baseline, loss function, segment, maturity window, and data cutoffAuthor evaluation framework
Grades: A, verified against the printed page of the primary source · B, primary source, text layer only · C, authoritative secondary · D, reported.
From the essay
Revenue operations & AI
What is AI demand forecasting? A forecast is a system, not an oracle
AI demand forecasting needs a target, horizon, information cutoff, override boundary, and later actual. Automation alone is not forecast governance.
Read the essayThis exhibit belongs to an essay: the numbers live here, the argument lives there.
Cite or embed
Related exhibits
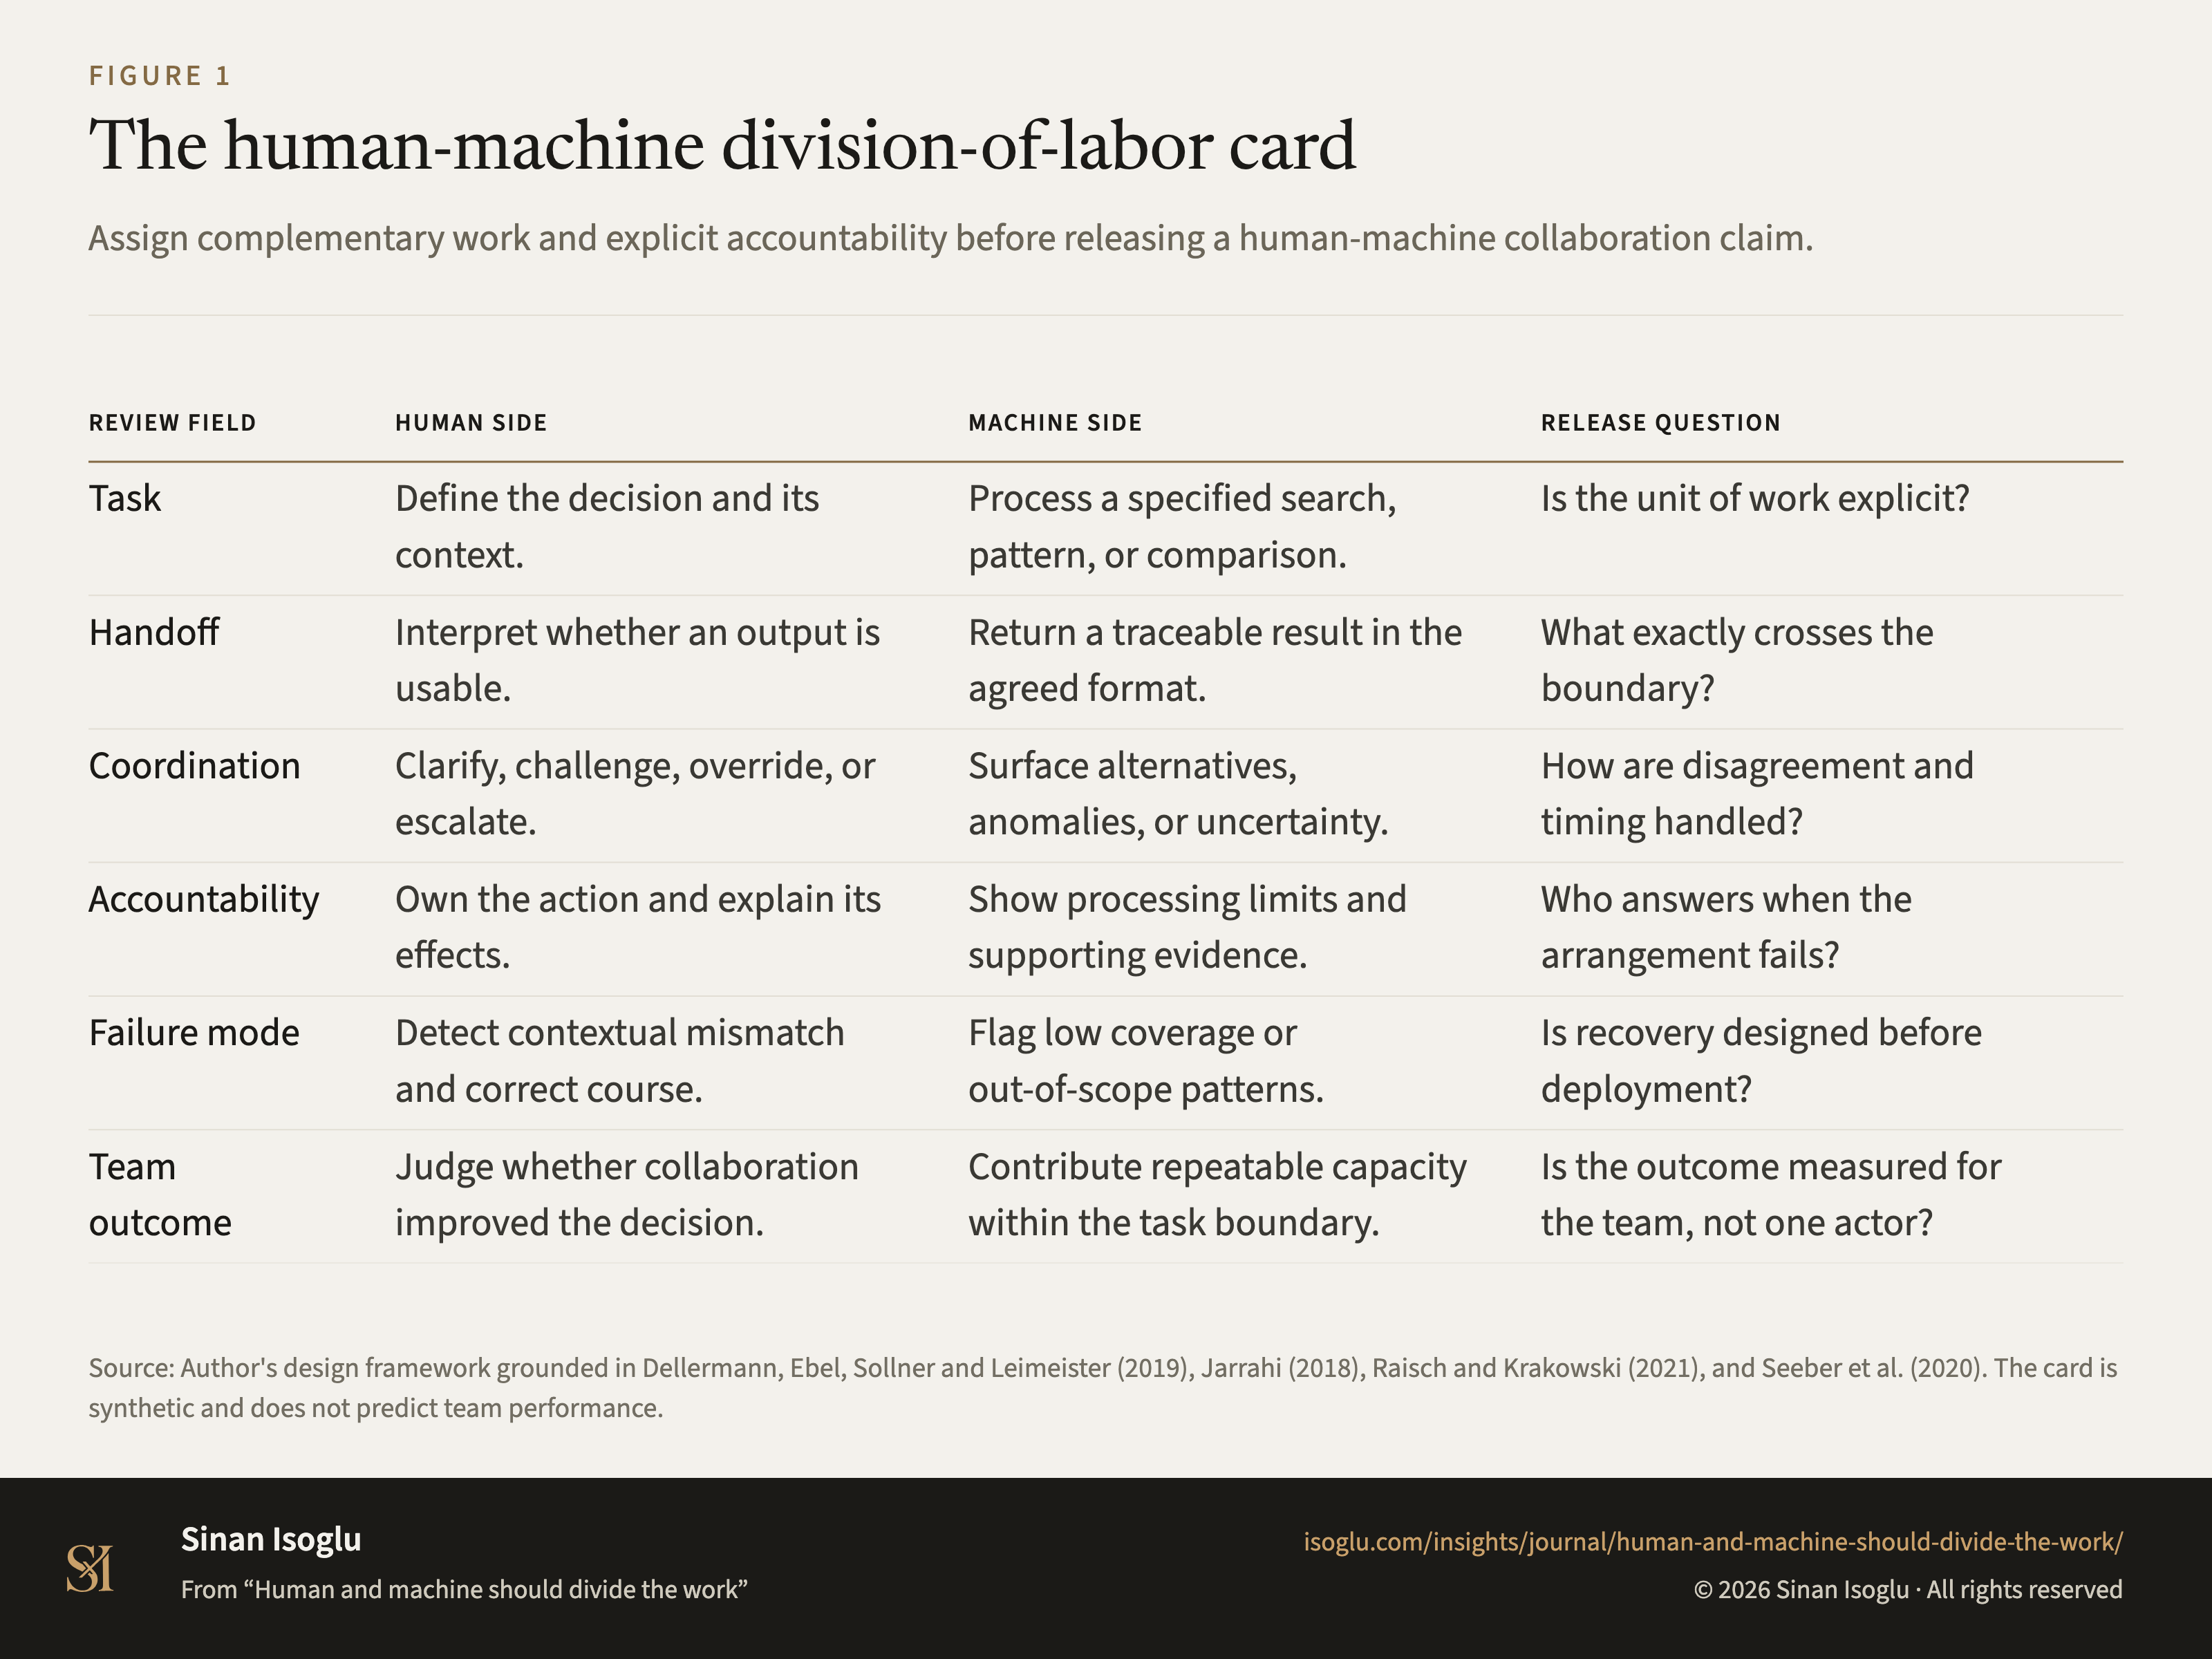
Figure 1Figure
The human-machine division-of-labor card
Human and machine should divide the work
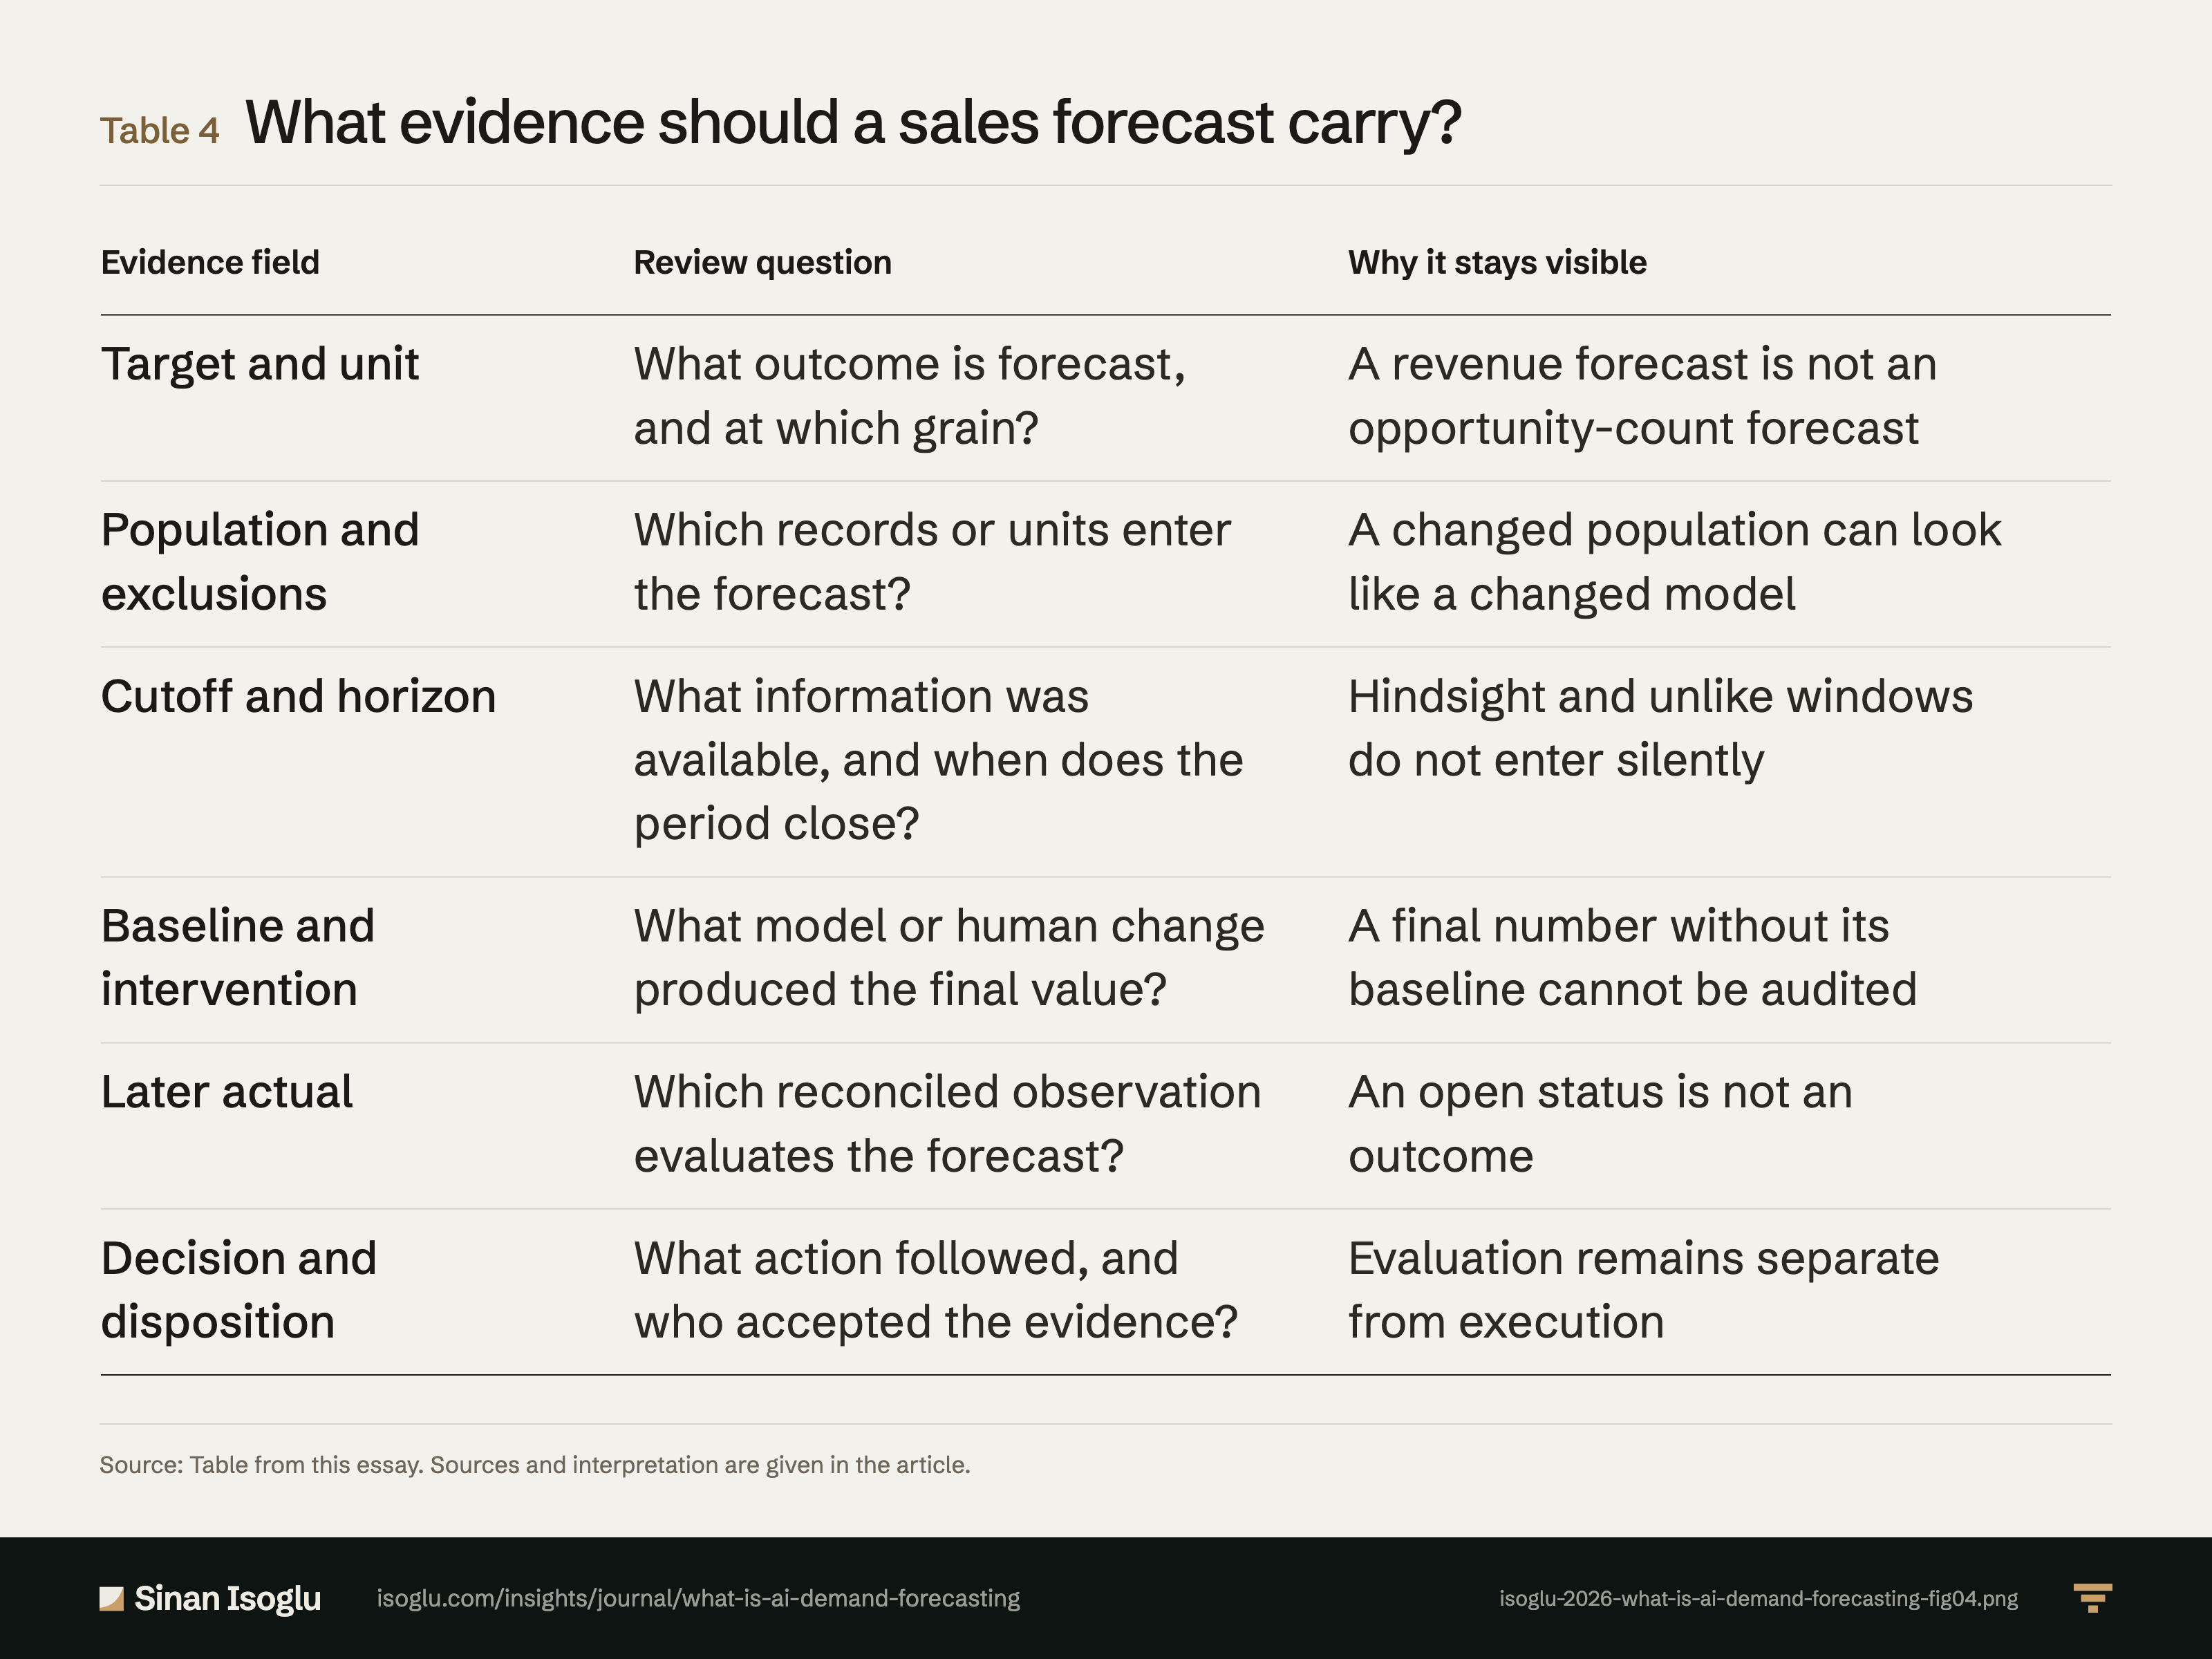
Table 4Table
What evidence should a sales forecast carry?
What is AI demand forecasting? A forecast is a system, not an oracle
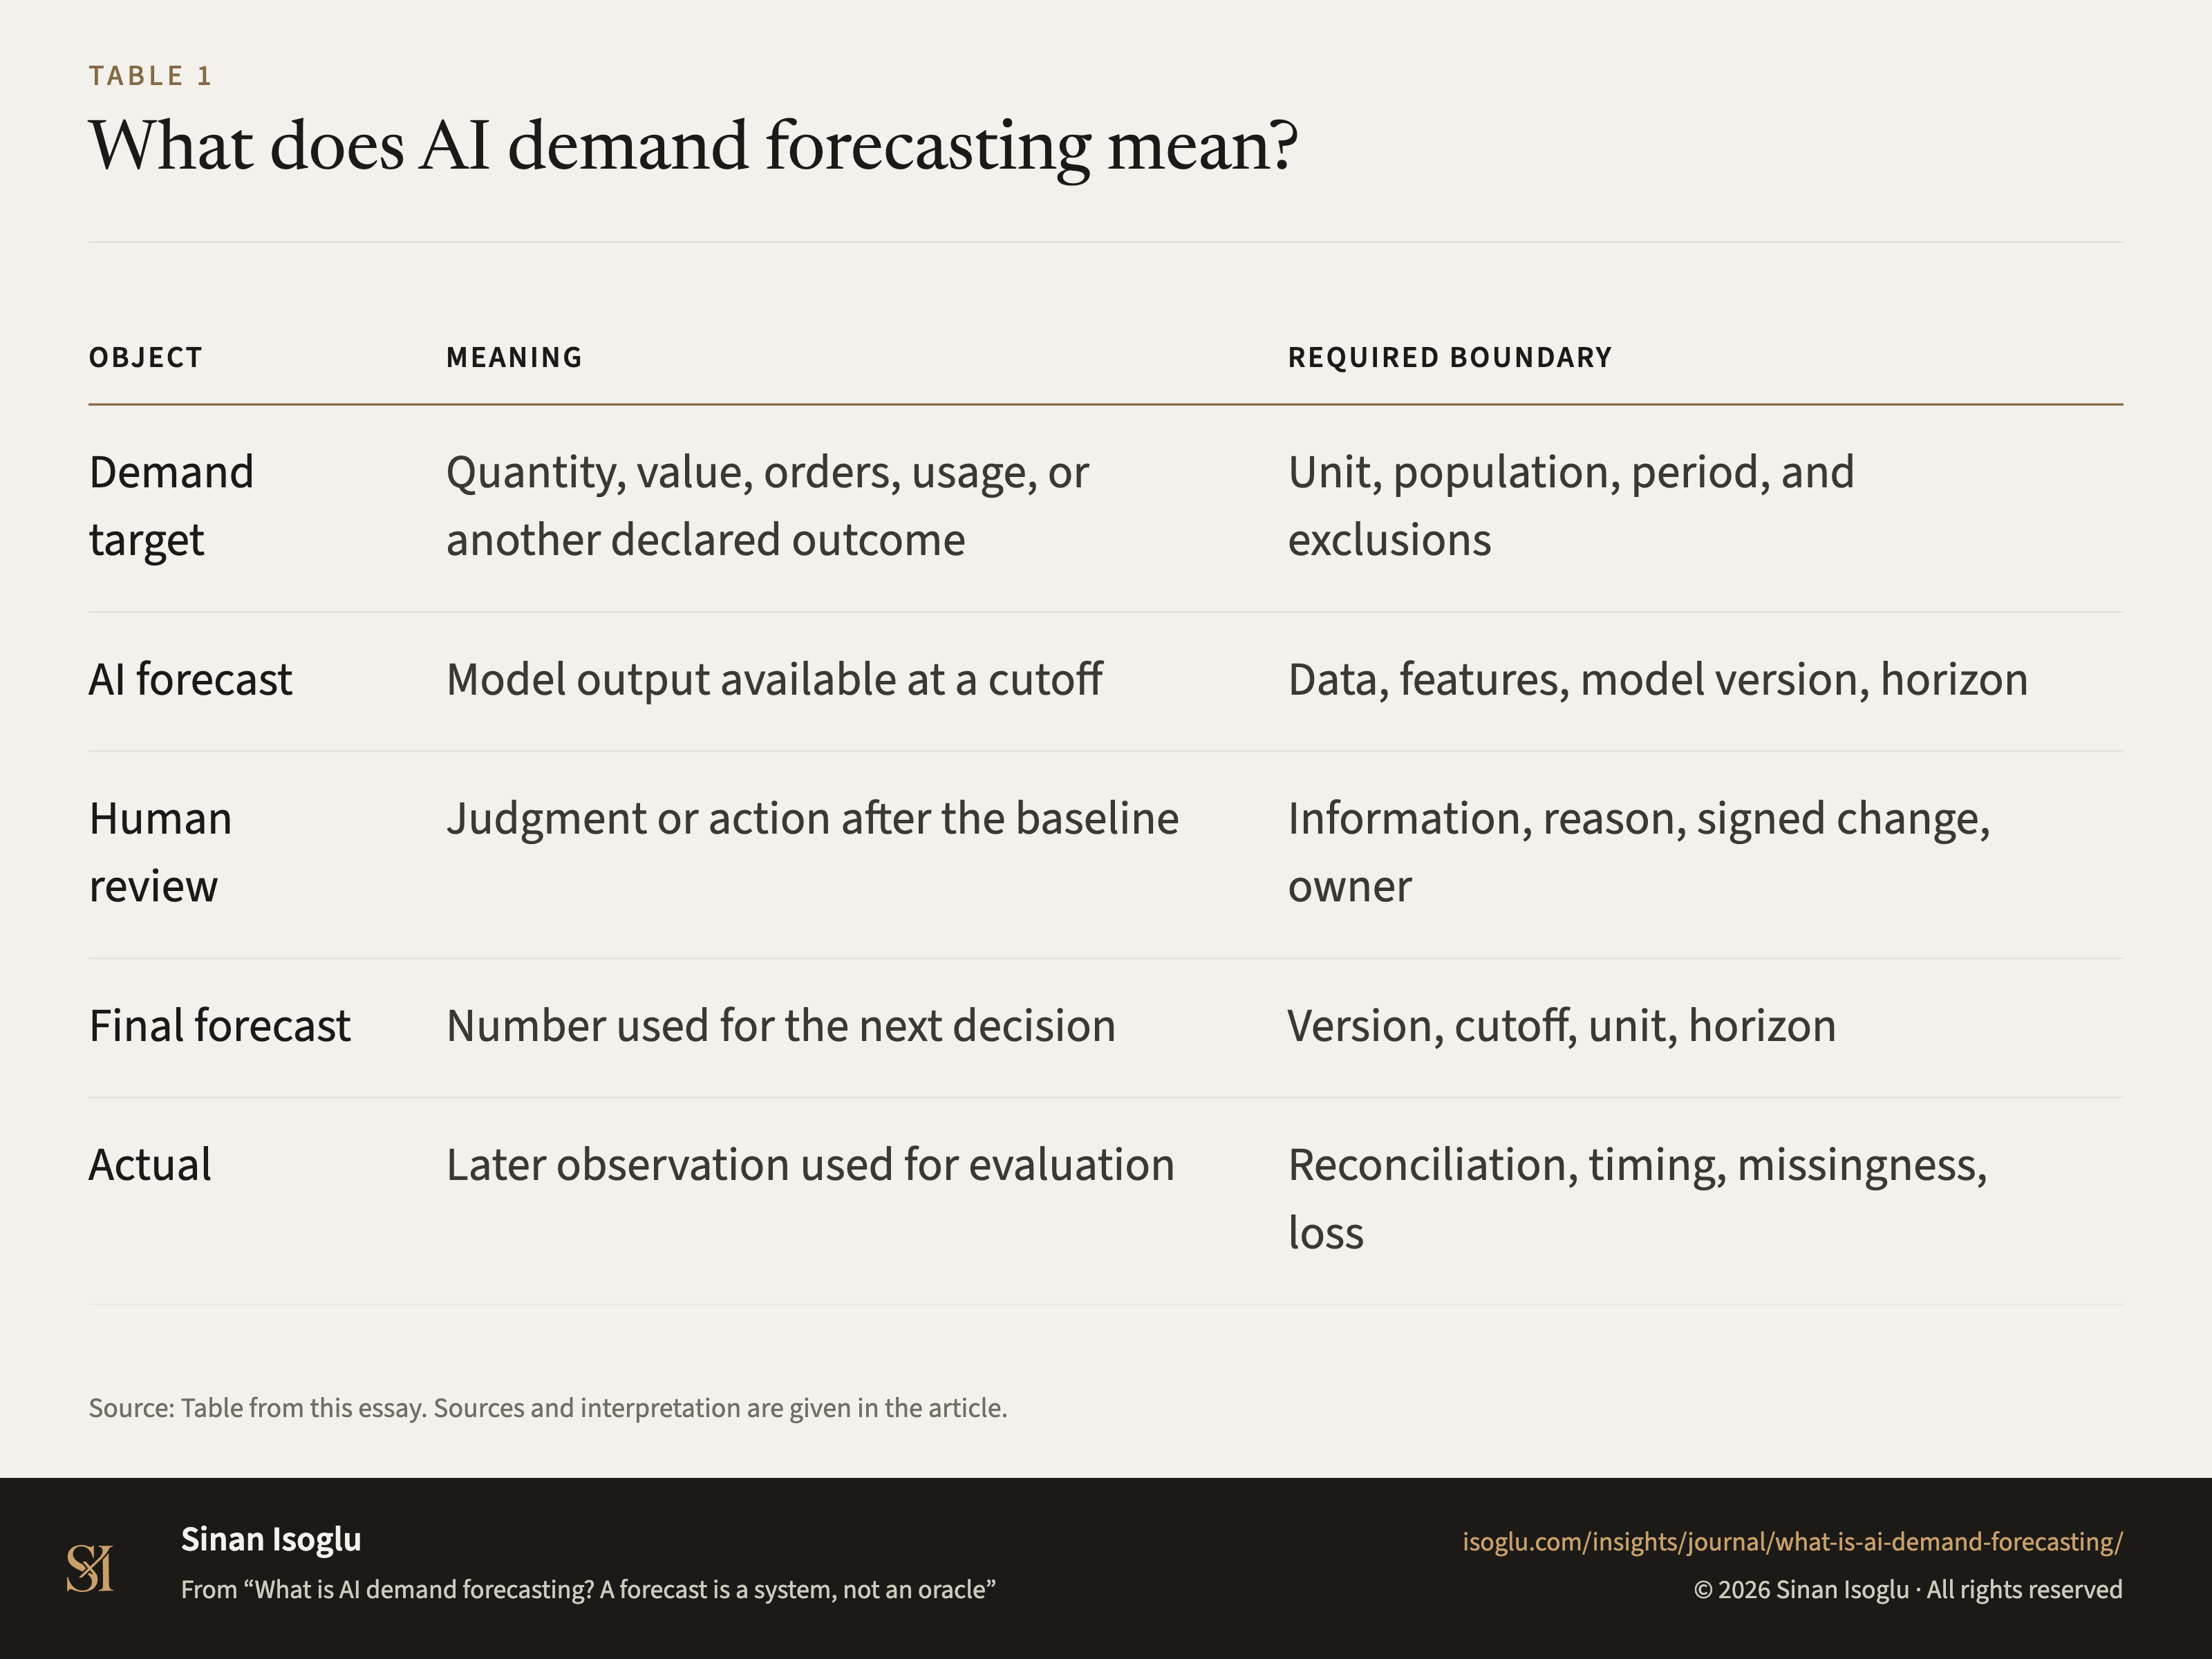
Table 1Table
What does AI demand forecasting mean?
What is AI demand forecasting? A forecast is a system, not an oracle
Contact
Bring the question you're working on.
Research, a guest lecture, or a commercial question.