Table 1From “What is a price promotion?”
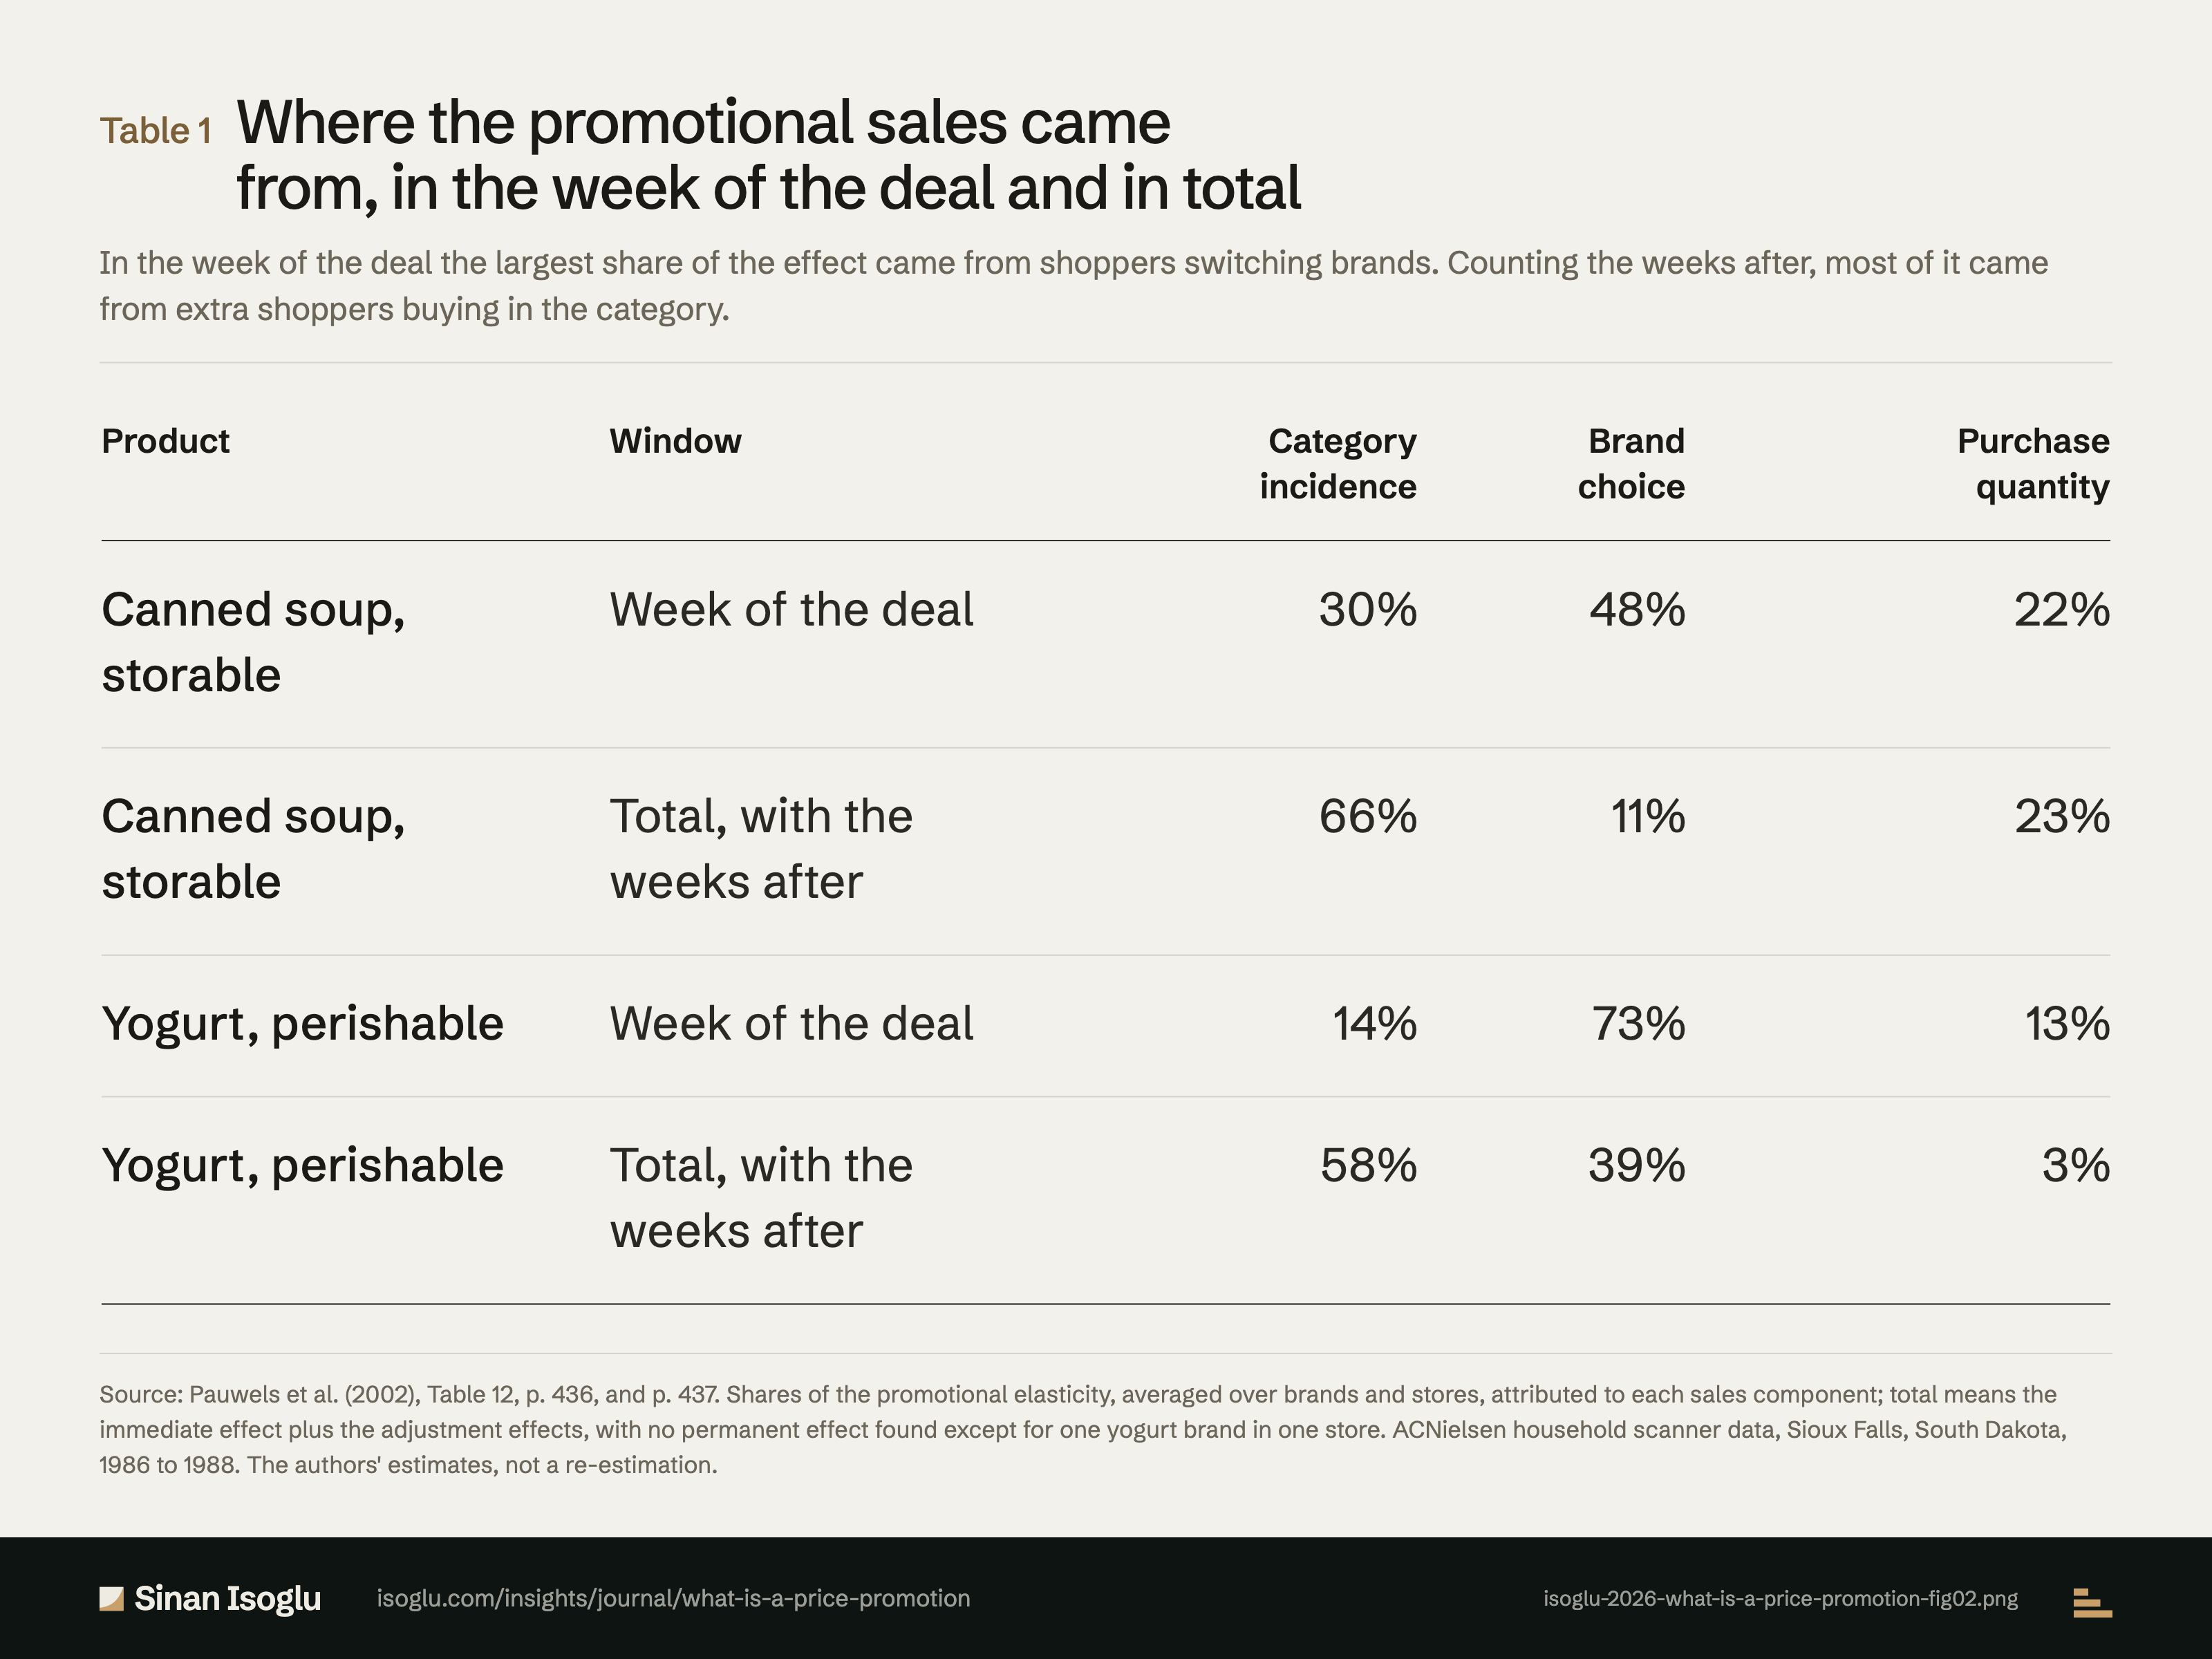
Where the promotional sales came from, in the week of the deal and in total
In the week of the deal the largest share of the effect came from shoppers switching brands. Counting the weeks after, most of it came from extra shoppers buying in the category.
Table 1Where the promotional sales came from, in the week of the deal and in total
| Product | Window | Category incidence | Brand choice | Purchase quantity |
|---|---|---|---|---|
| Canned soup, storable | Week of the deal | 30% | 48% | 22% |
| Canned soup, storable | Total, with the weeks after | 66% | 11% | 23% |
| Yogurt, perishable | Week of the deal | 14% | 73% | 13% |
| Yogurt, perishable | Total, with the weeks after | 58% | 39% | 3% |
Swipe or scroll horizontally if the table is wider than your screen.
Source: Pauwels et al. (2002), Table 12, p. 436, and p. 437. Shares of the promotional elasticity, averaged over brands and stores, attributed to each sales component; total means the immediate effect plus the adjustment effects, with no permanent effect found except for one yogurt brand in one store. ACNielsen household scanner data, Sioux Falls, South Dakota, 1986 to 1988. The authors' estimates, not a re-estimation.
Source and evidence
Each line names a claim related to this exhibit, its source, and how it was checked.
- A PHS02-C3 Brand sales are split into category incidence, brand choice and purchase quantity, measured for canned soup (storable, not impulse) and yogurt (perishable, impulse) in ACNielsen household scanner data from Sioux Falls, 1986 to 1988 (pp. 422, 426): "category incidence (the total number of panelists buying in the product category), brand choice (the share of these consumers buying the brand), and purchase quantity (the average quantity purchased by the brand's consumers)"; "a storable product that is not generally bought on impulse"; "a perishable product that is often bought on impulse"; "scanner data in the Sioux Falls, S. Dak., market for the period July 14, 1986, until September 5, 1988"pauwels-hanssens-siddarth-2002-long-term-promotions
- A PHS02-C4 Table 12: the immediate elasticity breakdown (incidence/choice/quantity) is 30/48/22 for soup and 14/73/13 for yogurt, the total breakdown 66/11/23 and 58/39/3; brand choice is the largest immediate component in both categories (a majority for yogurt, not for soup), total effects fall mainly on category incidence; one yogurt brand in one store showed a permanent effect (pp. 432, 436, 437): "Brand choice is the dominant factor in the immediate elasticity breakdown."; "Except for yogurt Brand 4 in Store 1."; "Price promotions have a larger immediate impact on selective demand (brand choice) than on primary demand (category incidence and purchase quantity)." (holds for yogurt and on average, not for the soup immediate row); "The relative magnitude of the total effects of a price shock are 66/11/23 for soup and 58/39/3 for yogurt."; "A comparison with the immediate breakdown of 30/48/22 for soup and 14/73/13 for yogurt"; "Although price promotions have a large immediate impact on brand choice, their total impact on brand choice is relatively low."pauwels-hanssens-siddarth-2002-long-term-promotions
Grades: A, verified against the printed page of the primary source · B, primary source, text layer only · C, authoritative secondary · D, reported.
From the essay
Pricing & revenue architecture
What is a price promotion?
A price promotion is a temporary price cut announced to buyers. It lifts sales at once, and buyers who see it often may buy the brand less without it.
Read the essayThis exhibit belongs to an essay: the numbers live here, the argument lives there.
Cite or embed
Contact
Bring the question you're working on.
Research, a guest lecture, or a commercial question.