Figure 1From “What drives salesperson performance?”
Average correlation of 18 driver categories with performance
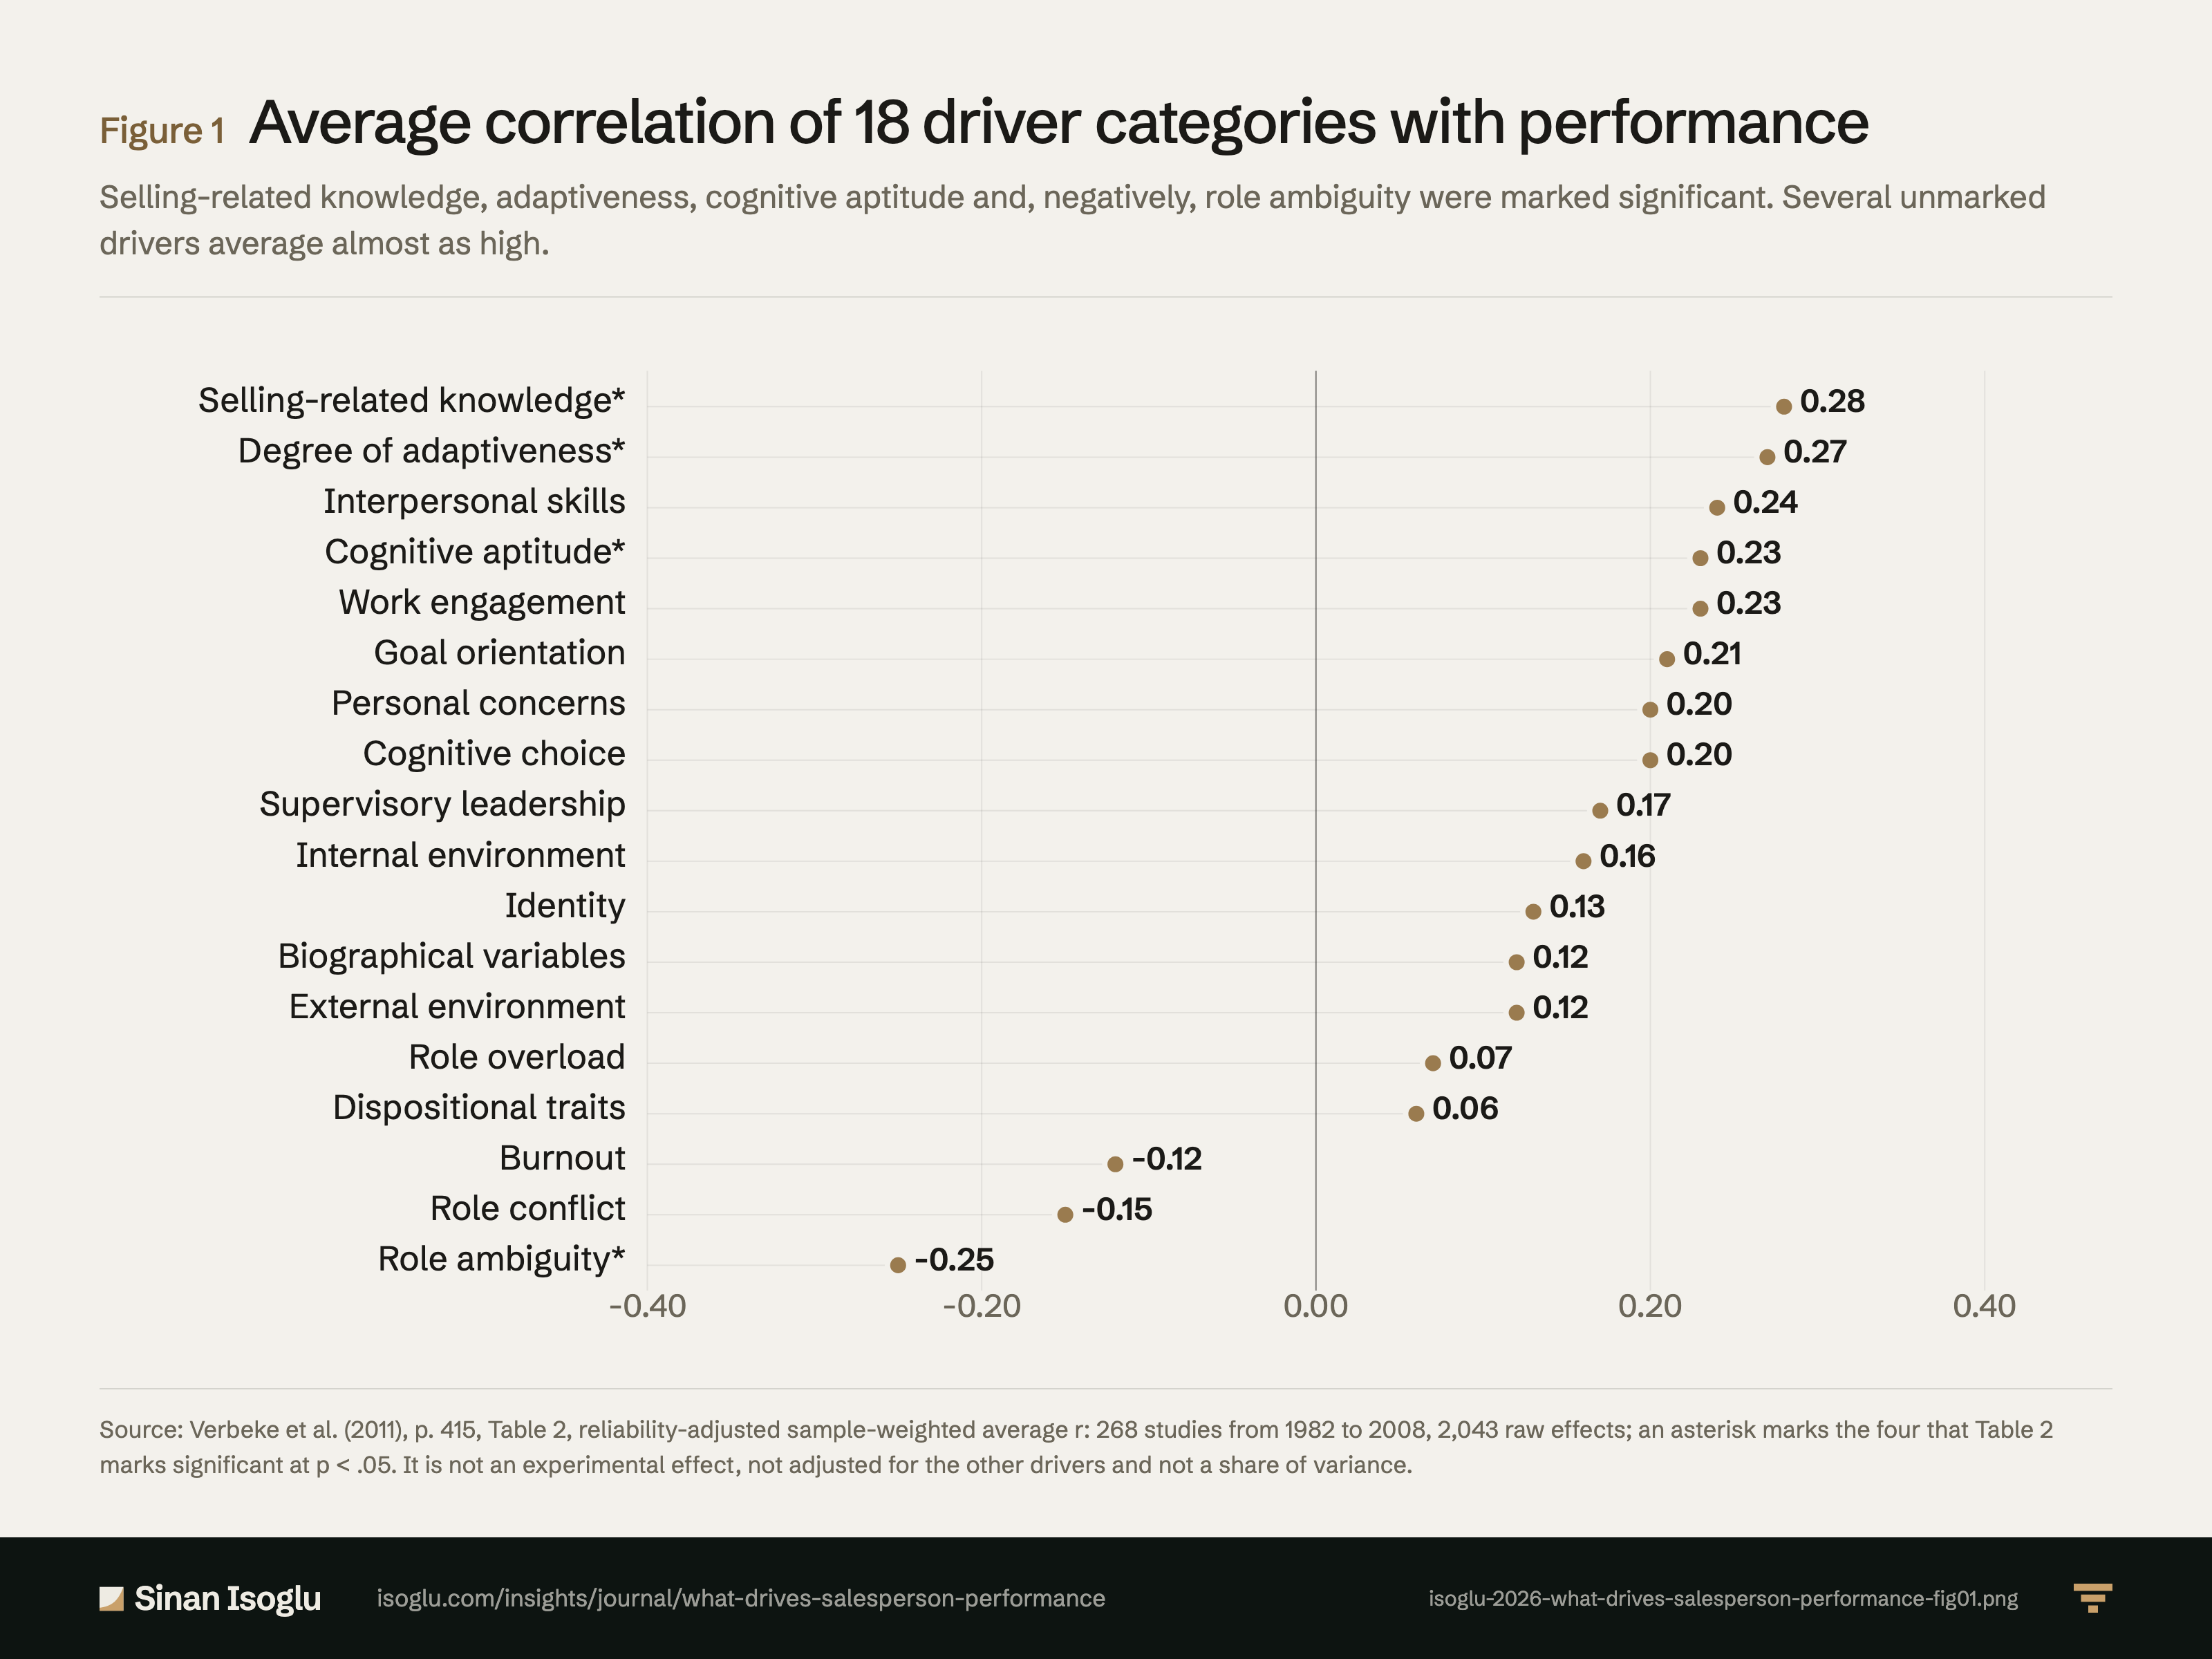
Selling-related knowledge, adaptiveness, cognitive aptitude and, negatively, role ambiguity were marked significant. Several unmarked drivers average almost as high.
Figure 1Average correlation of 18 driver categories with performance
Source: Verbeke et al. (2011), p. 415, Table 2, reliability-adjusted sample-weighted average r: 268 studies from 1982 to 2008, 2,043 raw effects; an asterisk marks the four that Table 2 marks significant at p < .05. It is not an experimental effect, not adjusted for the other drivers and not a share of variance.
Source and evidence
Each line names a claim related to this exhibit, its source, and how it was checked.
- A VDV11-C3 Bivariate ranking (Table 2, p. 415, reliability-adjusted sample-weighted average r): four of 18 sub-categories marked significant at p < .05, selling-related knowledge .28, degree of adaptiveness .27, role ambiguity −.25, cognitive aptitude .23; the others interpersonal .24, work engagement .23, goal orientation .21, personal concerns .20, cognitive choice .20, supervisory leadership .17, internal environment .16, identity .13, biographical .12, external environment .12, role overload .07, dispositional traits .06, burnout −.12, role conflict −.15; 95% intervals −.01 to .67 (knowledge), .00 to .59 (adaptiveness), −.57 to −.01 (role ambiguity); z-values 1.92 (knowledge) and 1.95 (adaptiveness) are below the 1.96 of a two-sided test at .05, so those two asterisks match a one-sided test, which the paper does not state (role ambiguity −1.99, cognitive aptitude 2.04); 12 raw effects for cognitive aptitude, 22 to 255 for the others, 2,043 in all against the 2,105 correlations the text reports; significant heterogeneity in all 18; Table 1 definitions of the leading sub-categories (pp. 409, 413, 414, 415, 418, 424): "For 4 out of 18 determinants, our bivariate data indicates significant antecedent-sales performance associations"; "significant variability across effect sizes exists for all 18 sub-categories"; "The depth and width of the knowledge base that salespeople need to size up sales situations, classify prospects, and select appropriate sales strategies for clients"; "The altering of sales behaviors during a customer interaction or across customer interactions based on perceived information about the nature of the selling situation"; "Perceived lack of information to perform the job adequately and uncertainty about the expectations of different role set members"; "Category that includes measures of a general factor of mental ability, verbal ability, and quantitative ability"; "it is the smallest sub-category with only 12 correlations"Verbeke, Dietz & Verwaal (2011) · Verbeke, Dietz & Verwaal. (2011)
Grades: A, verified against the printed page of the primary source · B, primary source, text layer only · C, authoritative secondary · D, reported.
From the essay
Revenue operations & AI
What drives salesperson performance?
A meta-analysis of 268 studies marked four of 18 driver categories as significant correlates of salesperson performance. A ranking, not a proven cause.
Read the essayThis exhibit belongs to an essay: the numbers live here, the argument lives there.
Cite or embed
Contact
Bring the question you're working on.
Research, a guest lecture, or a commercial question.