Figure 1From “What are sales enablement metrics? Measure behavior change before activity”
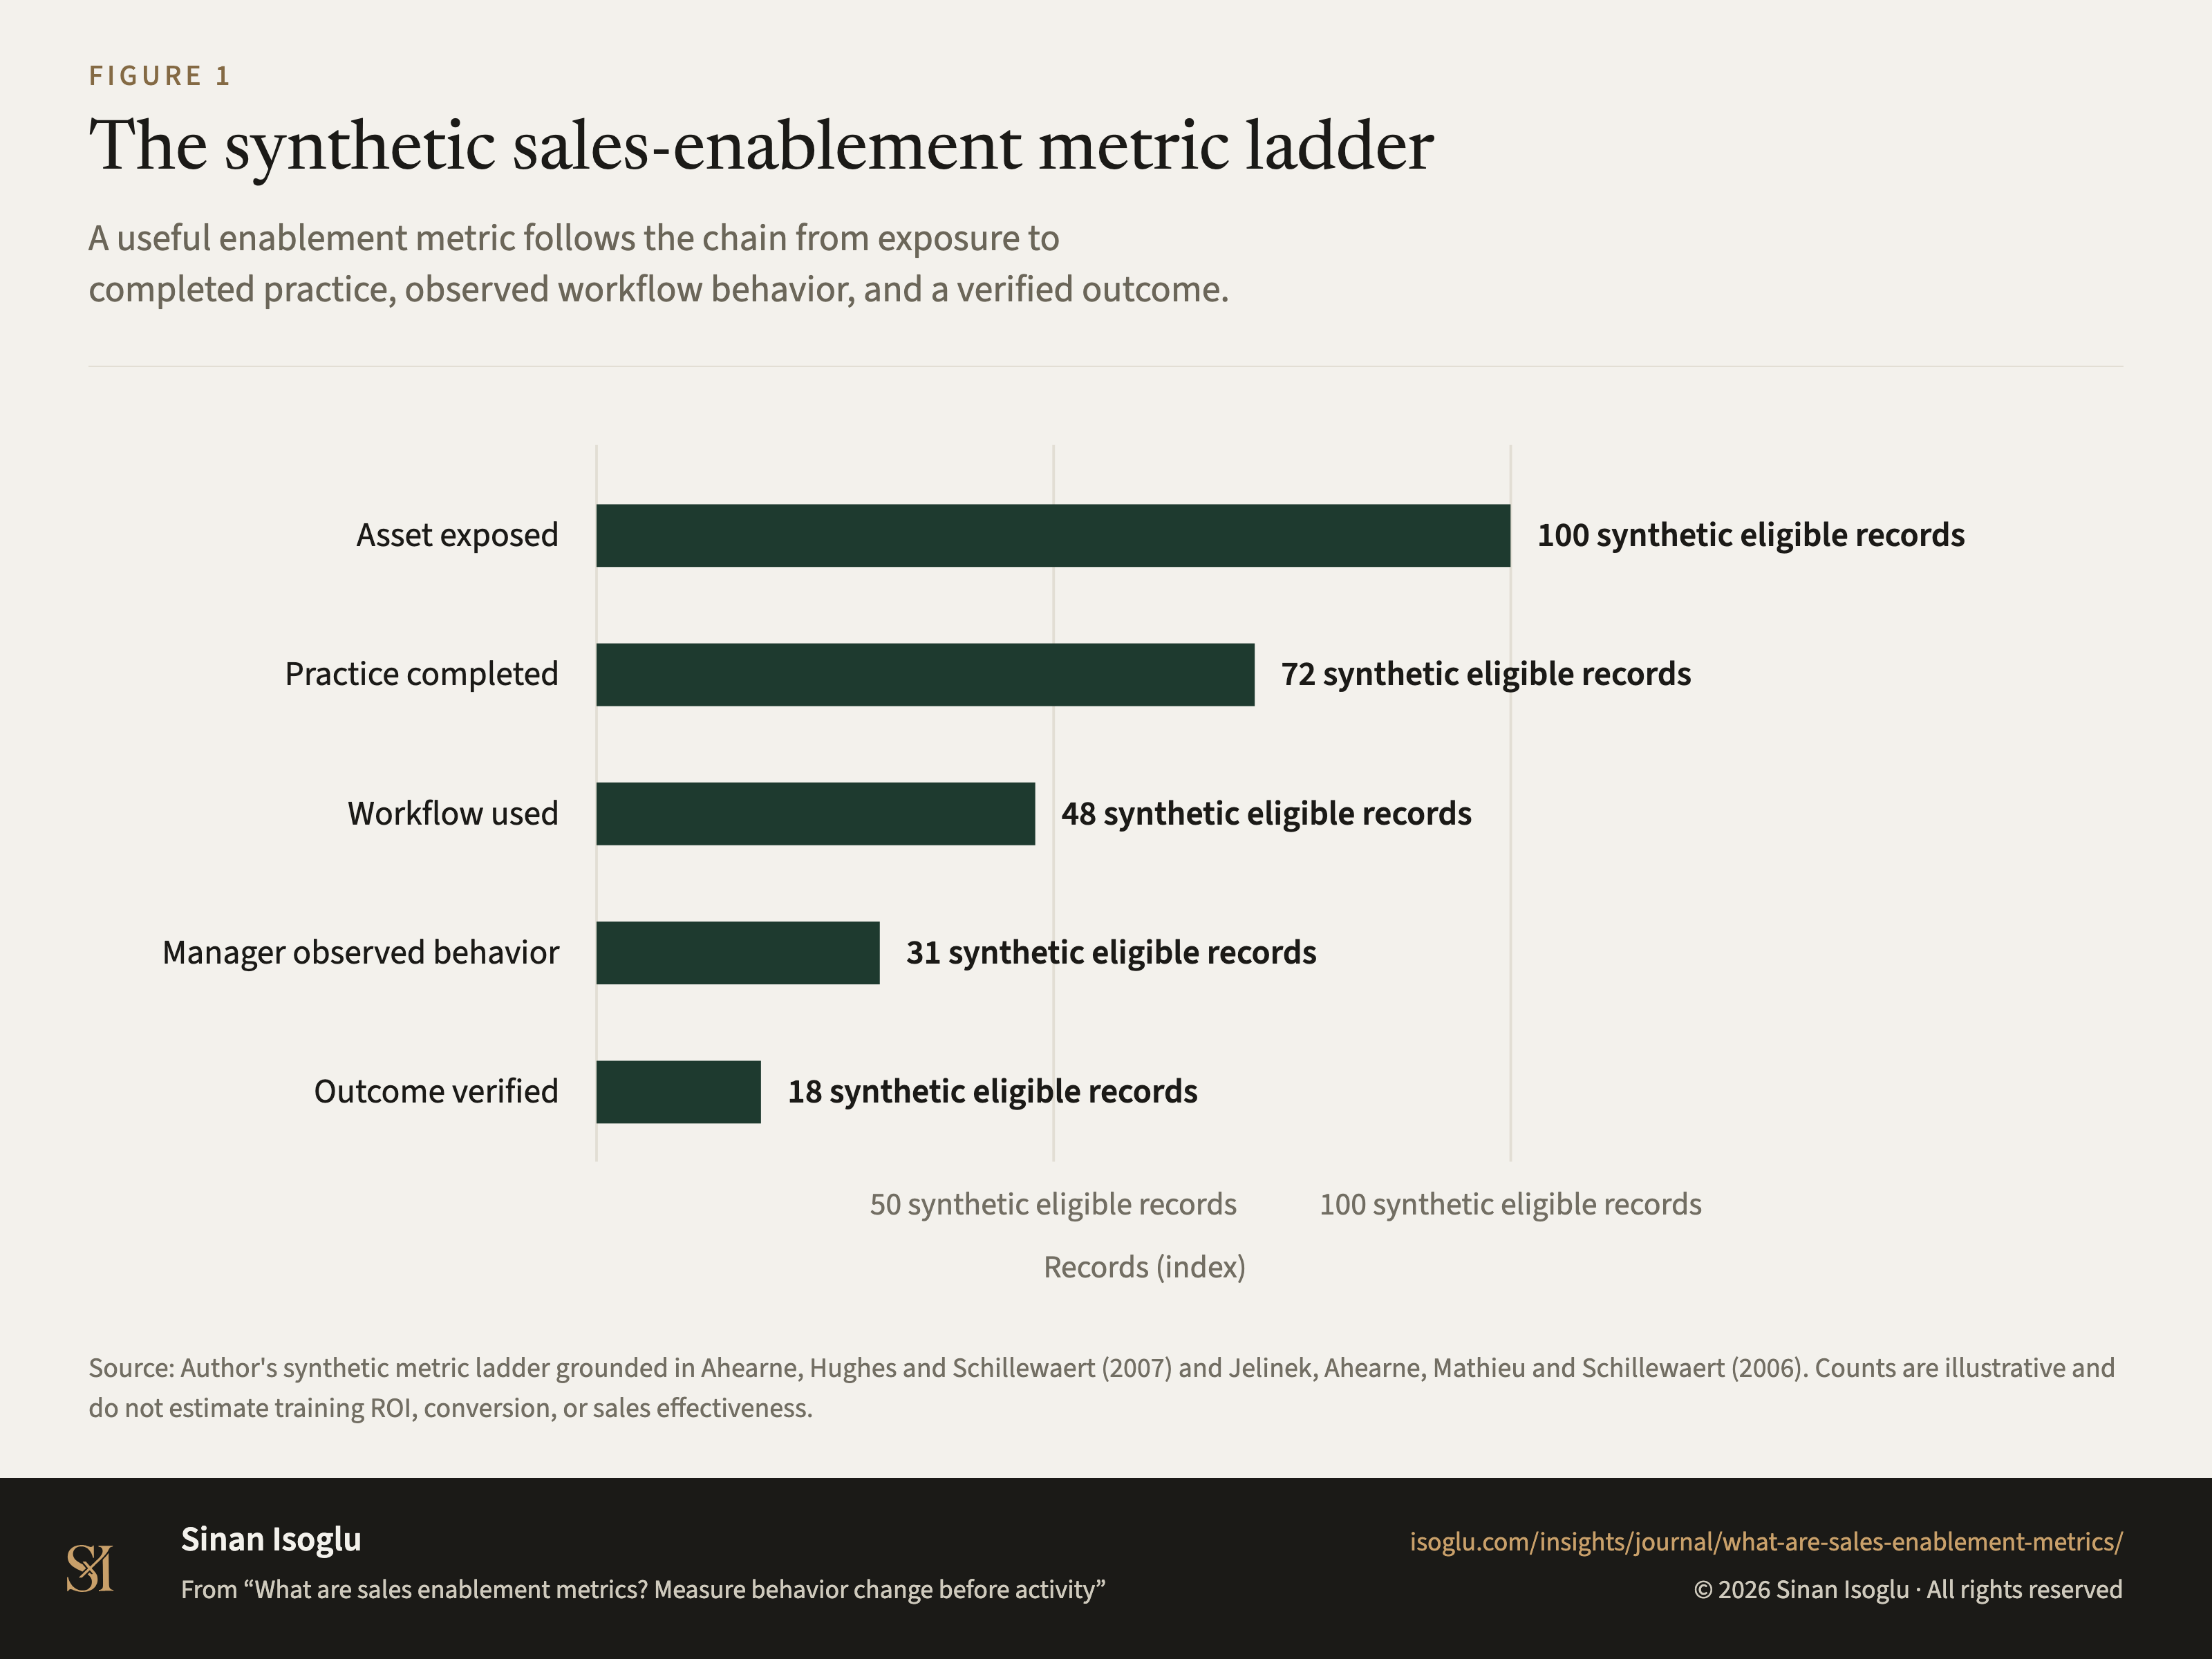
The synthetic sales-enablement metric ladder
A useful enablement metric follows the chain from exposure to completed practice, observed workflow behavior, and a verified outcome.
Figure 1The synthetic sales-enablement metric ladder
Source: Author's synthetic metric ladder grounded in Ahearne, Hughes and Schillewaert (2007) and Jelinek, Ahearne, Mathieu and Schillewaert (2006). Counts are illustrative and do not estimate training ROI, conversion, or sales effectiveness.
Source and evidence
Each line names a claim related to this exhibit, its source, and how it was checked.
- A AHS07-C1 Two companies, positive effect: "using data collected from two companies we show that despite uncertain results and the frequent resistance among salespeople to it interventions it acceptance indeed has a positive effect on sales performance"Ahearne, Hughes & Schillewaert. (2007)
- A AHS07-C2 The proposed mechanism, in their words: "salespeople using it expand their knowledge and in turn gain improved targeting abilities enhanced presentation skills and increased call productivity"Ahearne, Hughes & Schillewaert. (2007)
- A AHS07-C3 Acceptance is the variable, not provision: "it acceptance indeed has a positive effect on sales performance", and the incentive to accept follows from what acceptance buys the salespersonAhearne, Hughes & Schillewaert. (2007)
- A JAMS06-C1 The design is in the title: "a longitudinal examination of individual organizational and contextual factors on sales technology adoption and job performance"Jelinek, Ahearne, Mathieu & Schillewaert. (2006)
- A JAMS06-C2 Adoption is modelled as shaped by those three families of factors: "individual organizational and contextual factors on sales technology adoption"Jelinek, Ahearne, Mathieu & Schillewaert. (2006)
- B V12-OWN-C1 Sales-enablement metrics measure a declared behavior, capability, output, or commercial outcome after an enablement interventionAuthor framework grounded in AHS07-C1 and JAMS06-C1
- B V12-OWN-C2 Activity, adoption, knowledge, behavior change, opportunity outcome, and revenue outcome are different enablement objectsAuthor taxonomy
- B V12-OWN-C4 Training completion or content usage does not by itself establish behavior change, seller productivity, or revenue impactAuthor negative boundary grounded in AHS07-C2 and AHS07-C3
Grades: A, verified against the printed page of the primary source · B, primary source, text layer only · C, authoritative secondary · D, reported.
From the essay
Revenue operations & AI
What are sales enablement metrics? Measure behavior change before activity
Sales enablement metrics should follow adoption into behavior and outcome. Count content and training only after the decision path is declared.
Read the essayThis exhibit belongs to an essay: the numbers live here, the argument lives there.
Cite or embed
Related exhibits
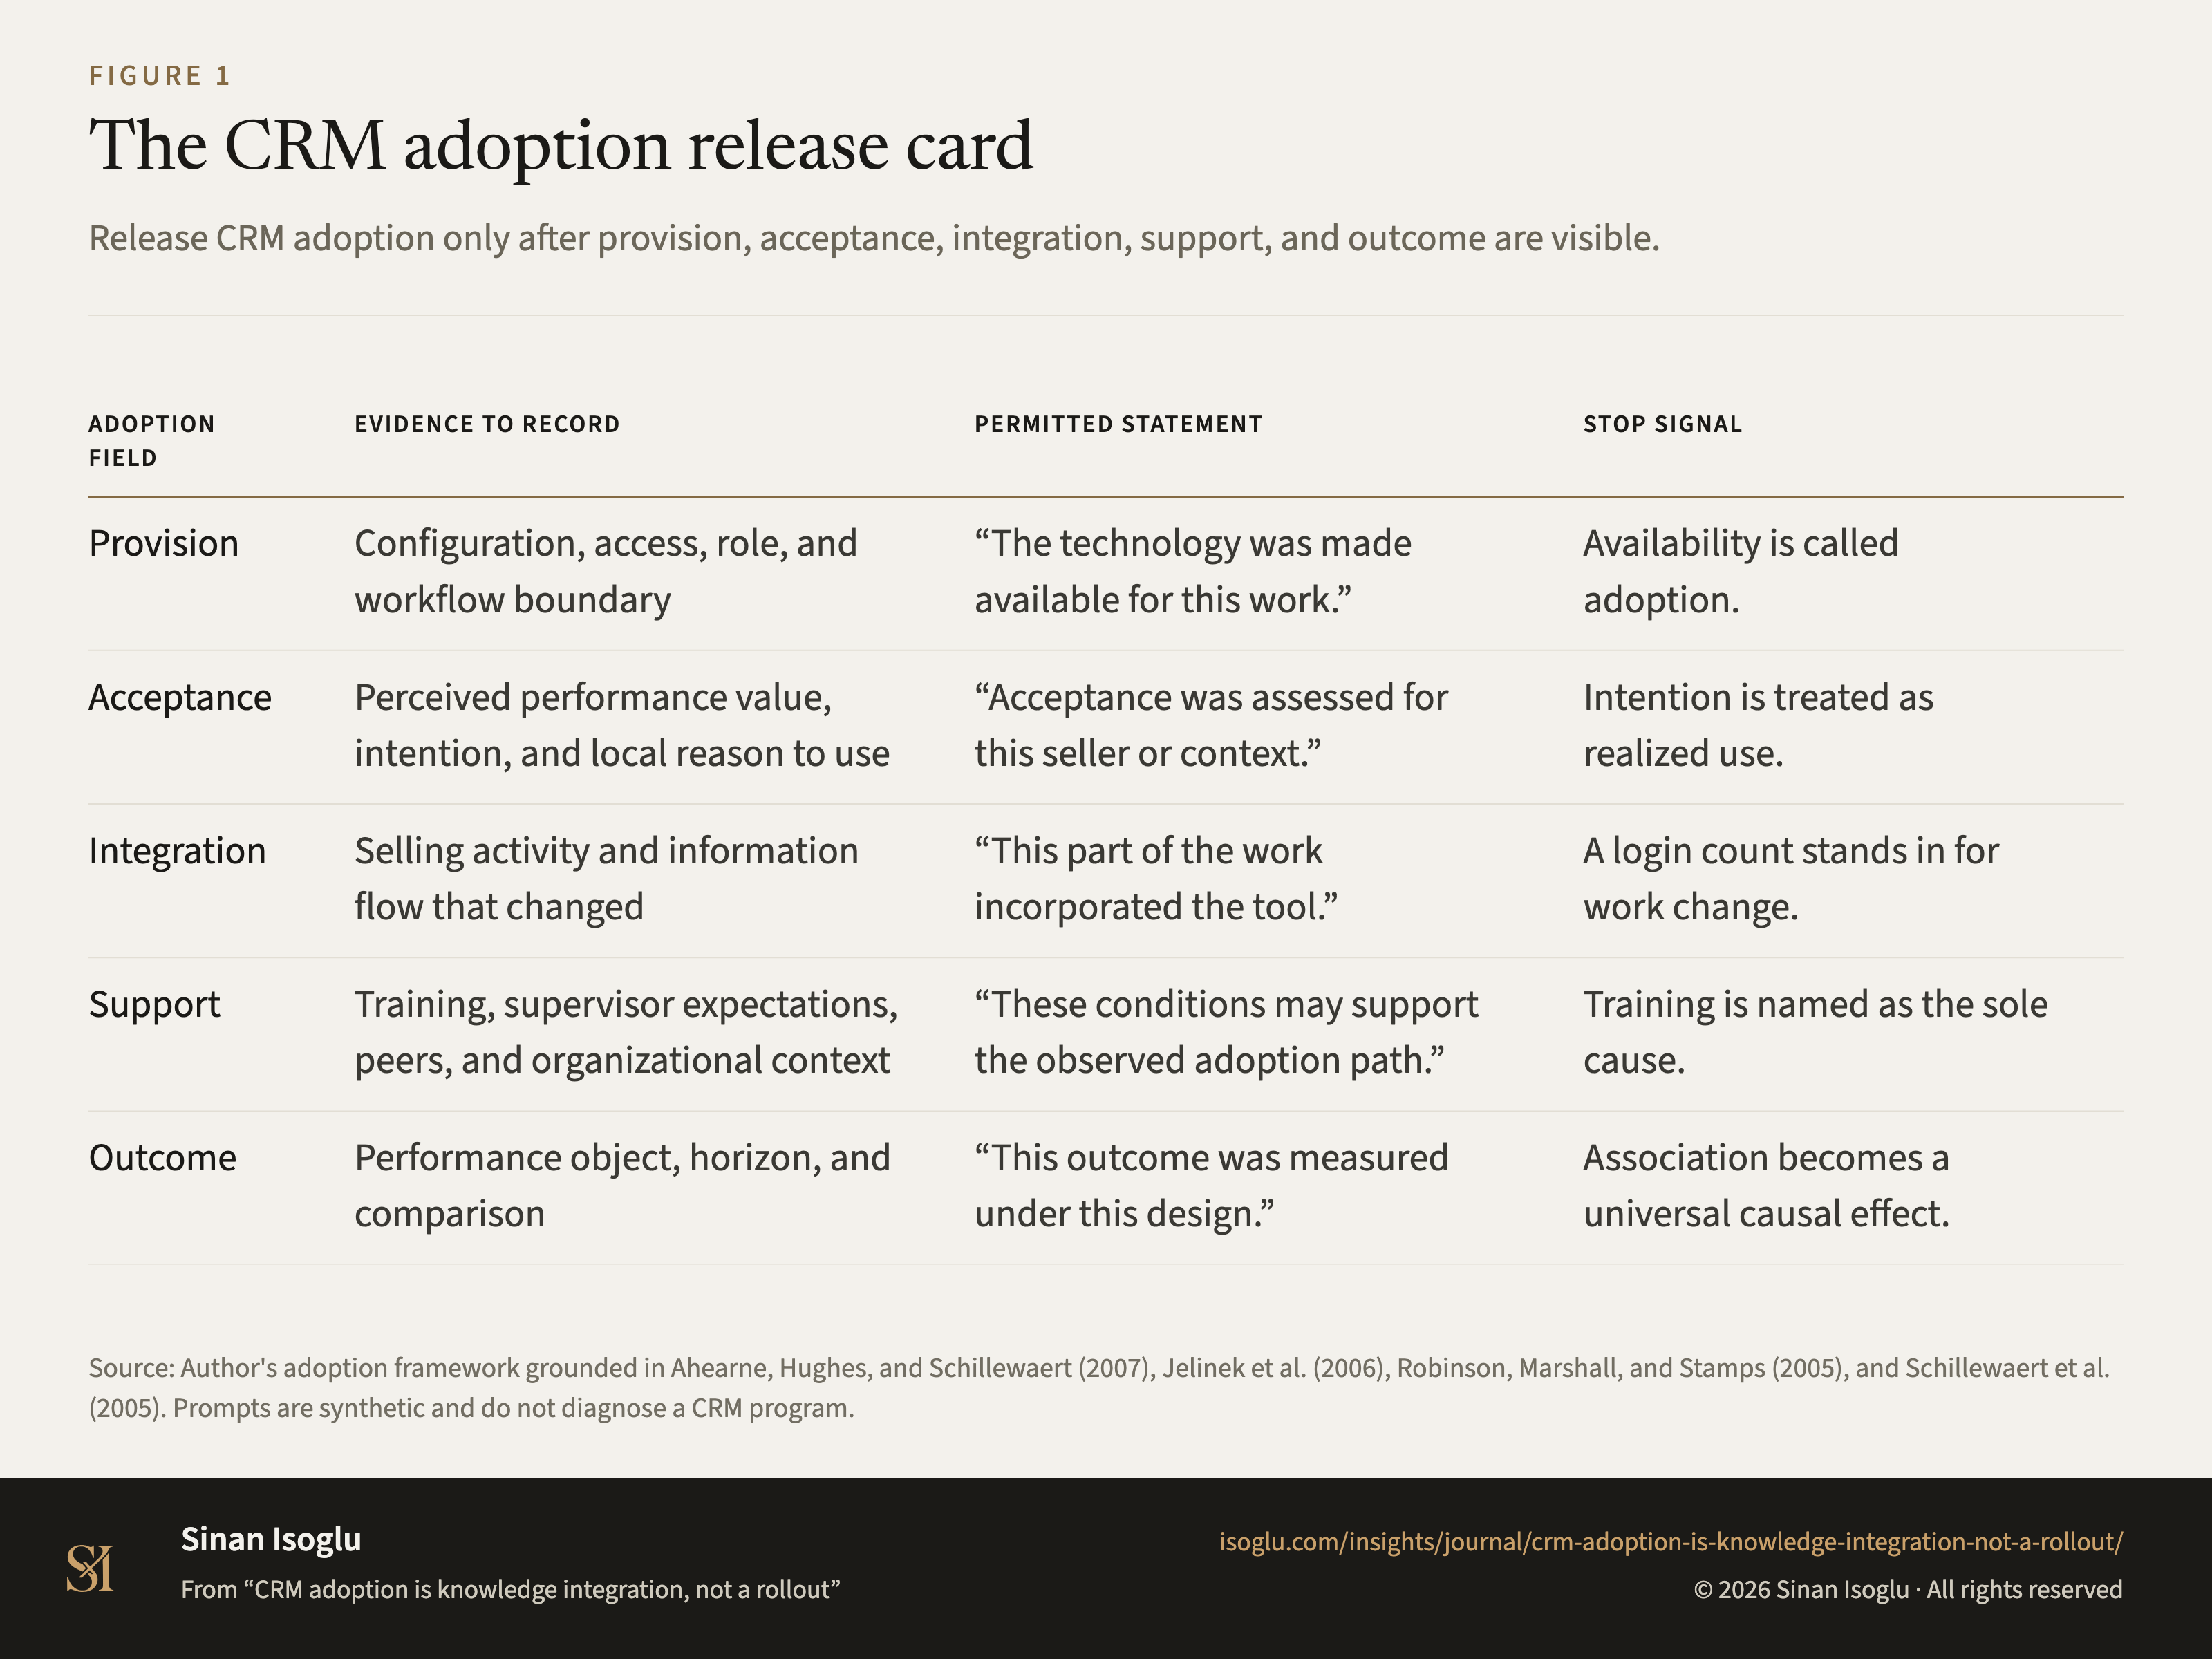
Figure 1Figure
The CRM adoption release card
CRM adoption is knowledge integration, not a rollout
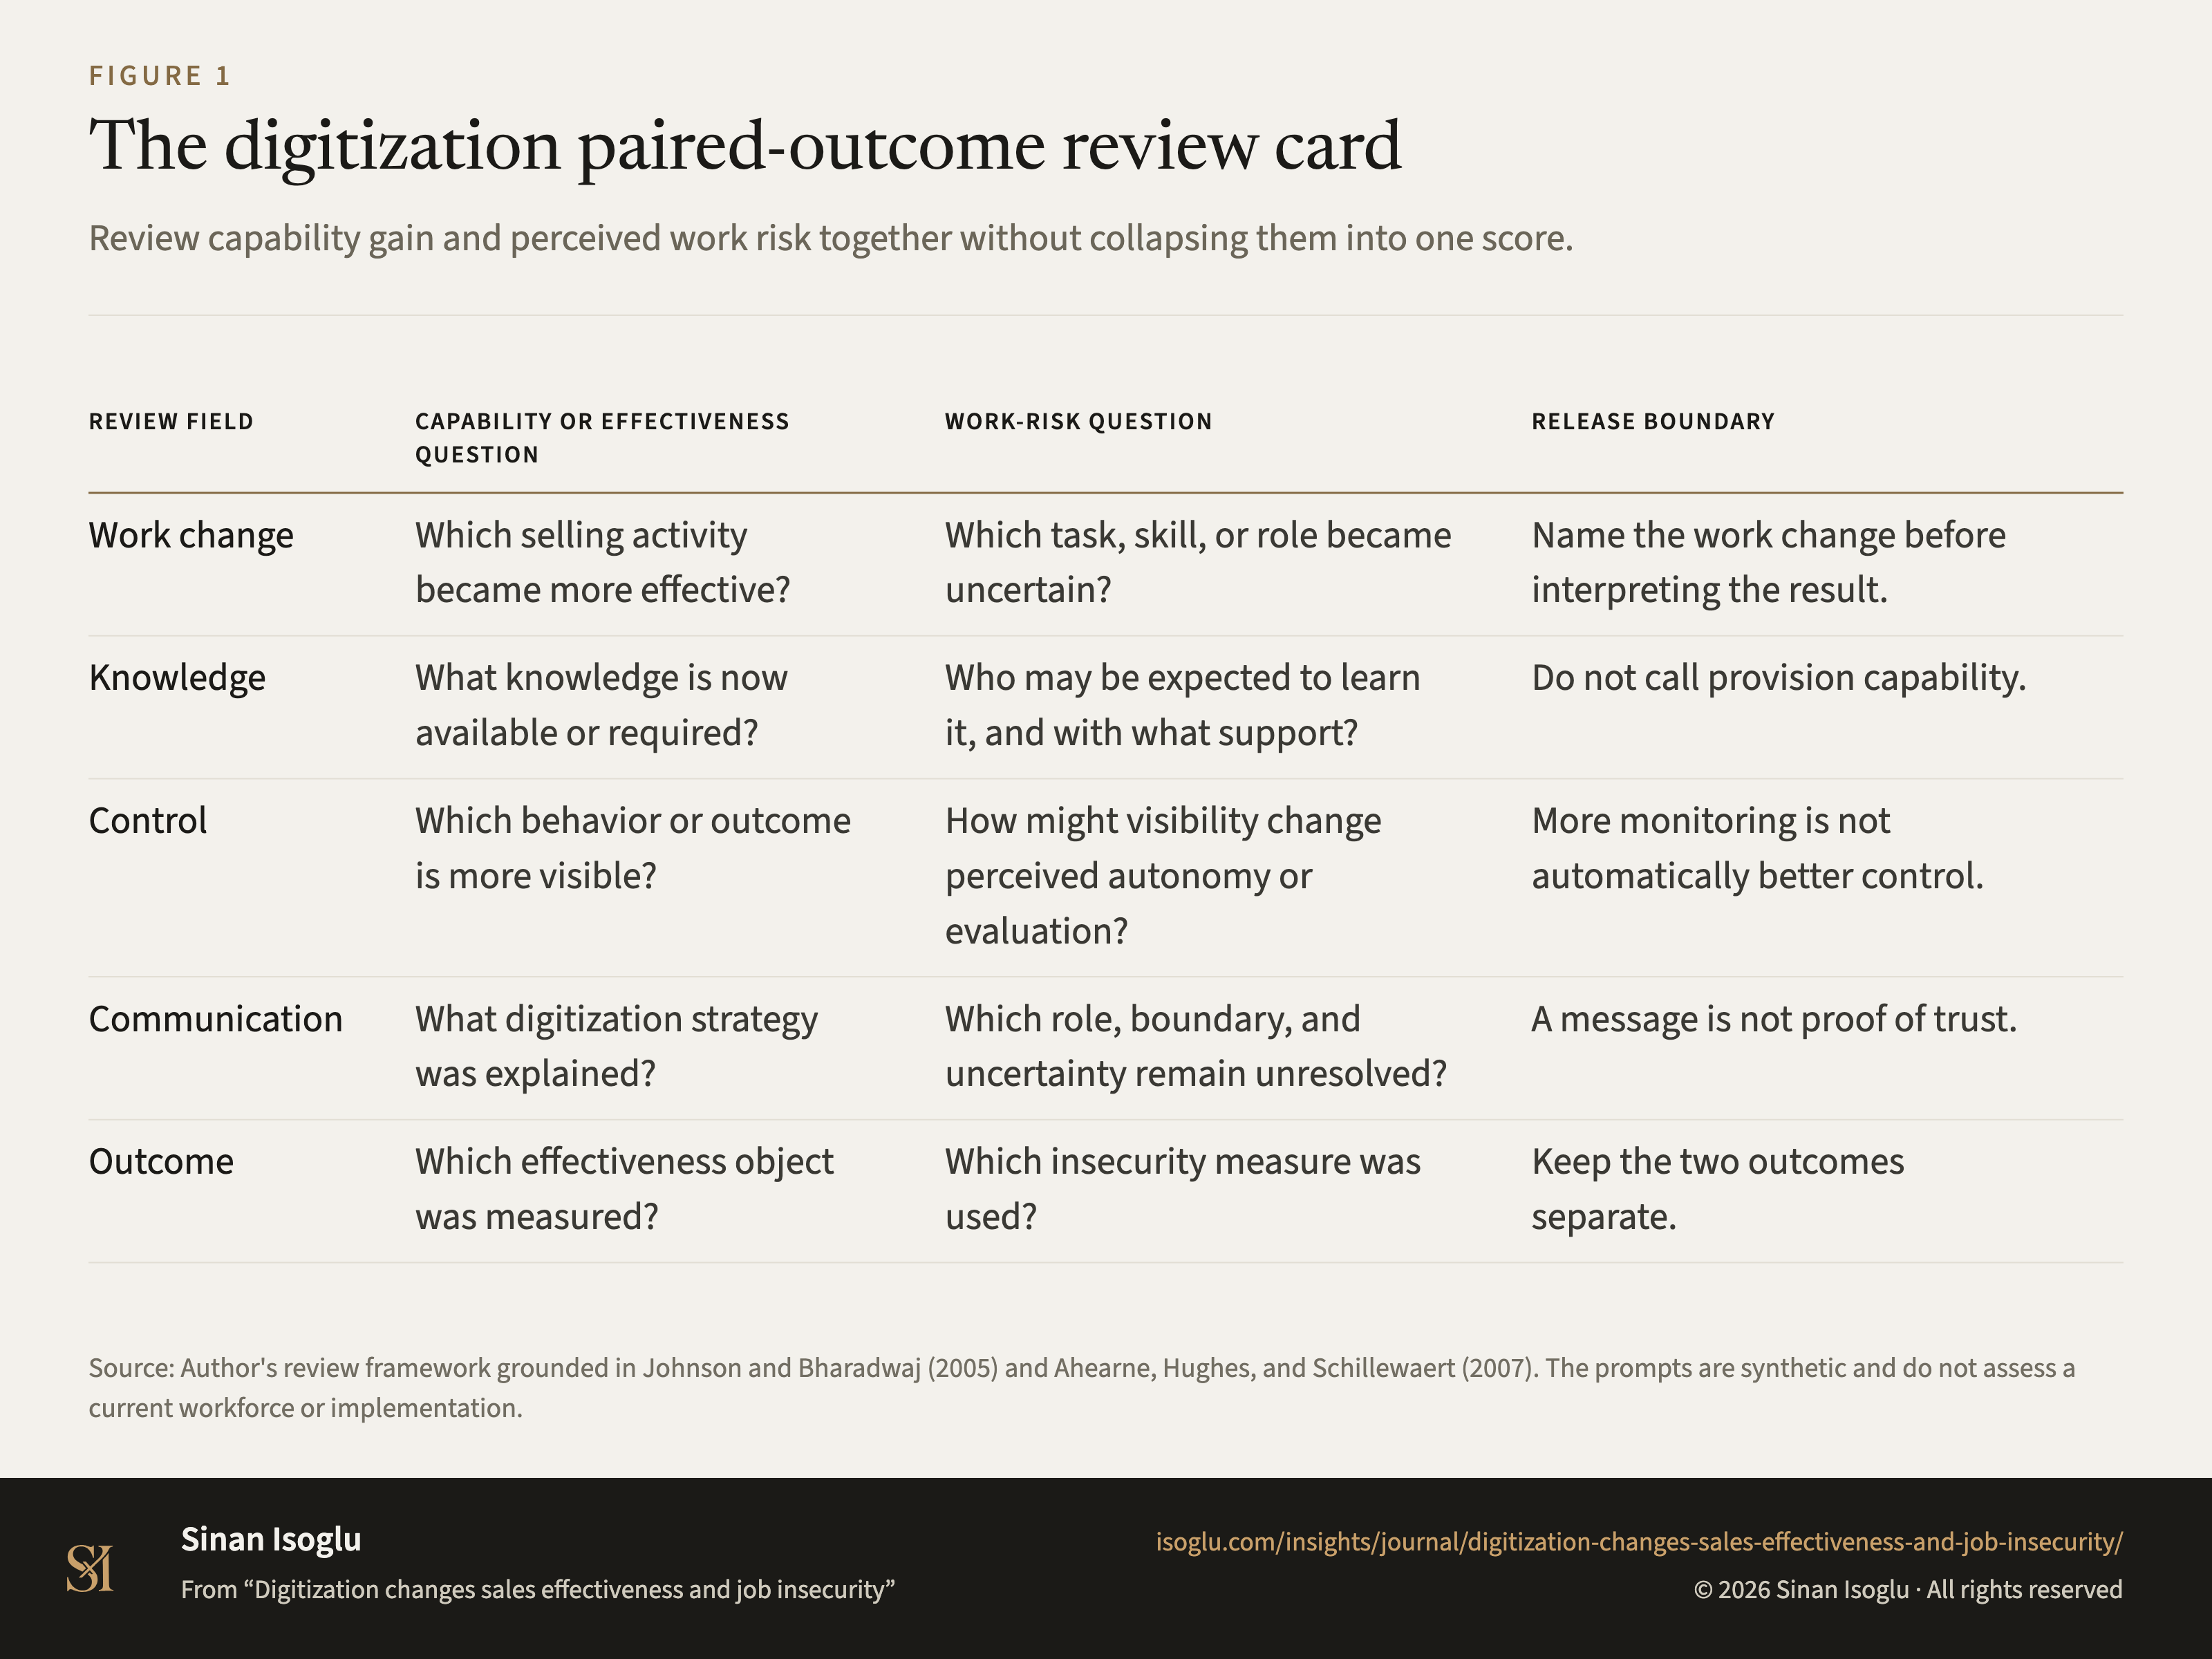
Figure 1Figure
The digitization paired-outcome review card
Digitization changes sales effectiveness and job insecurity
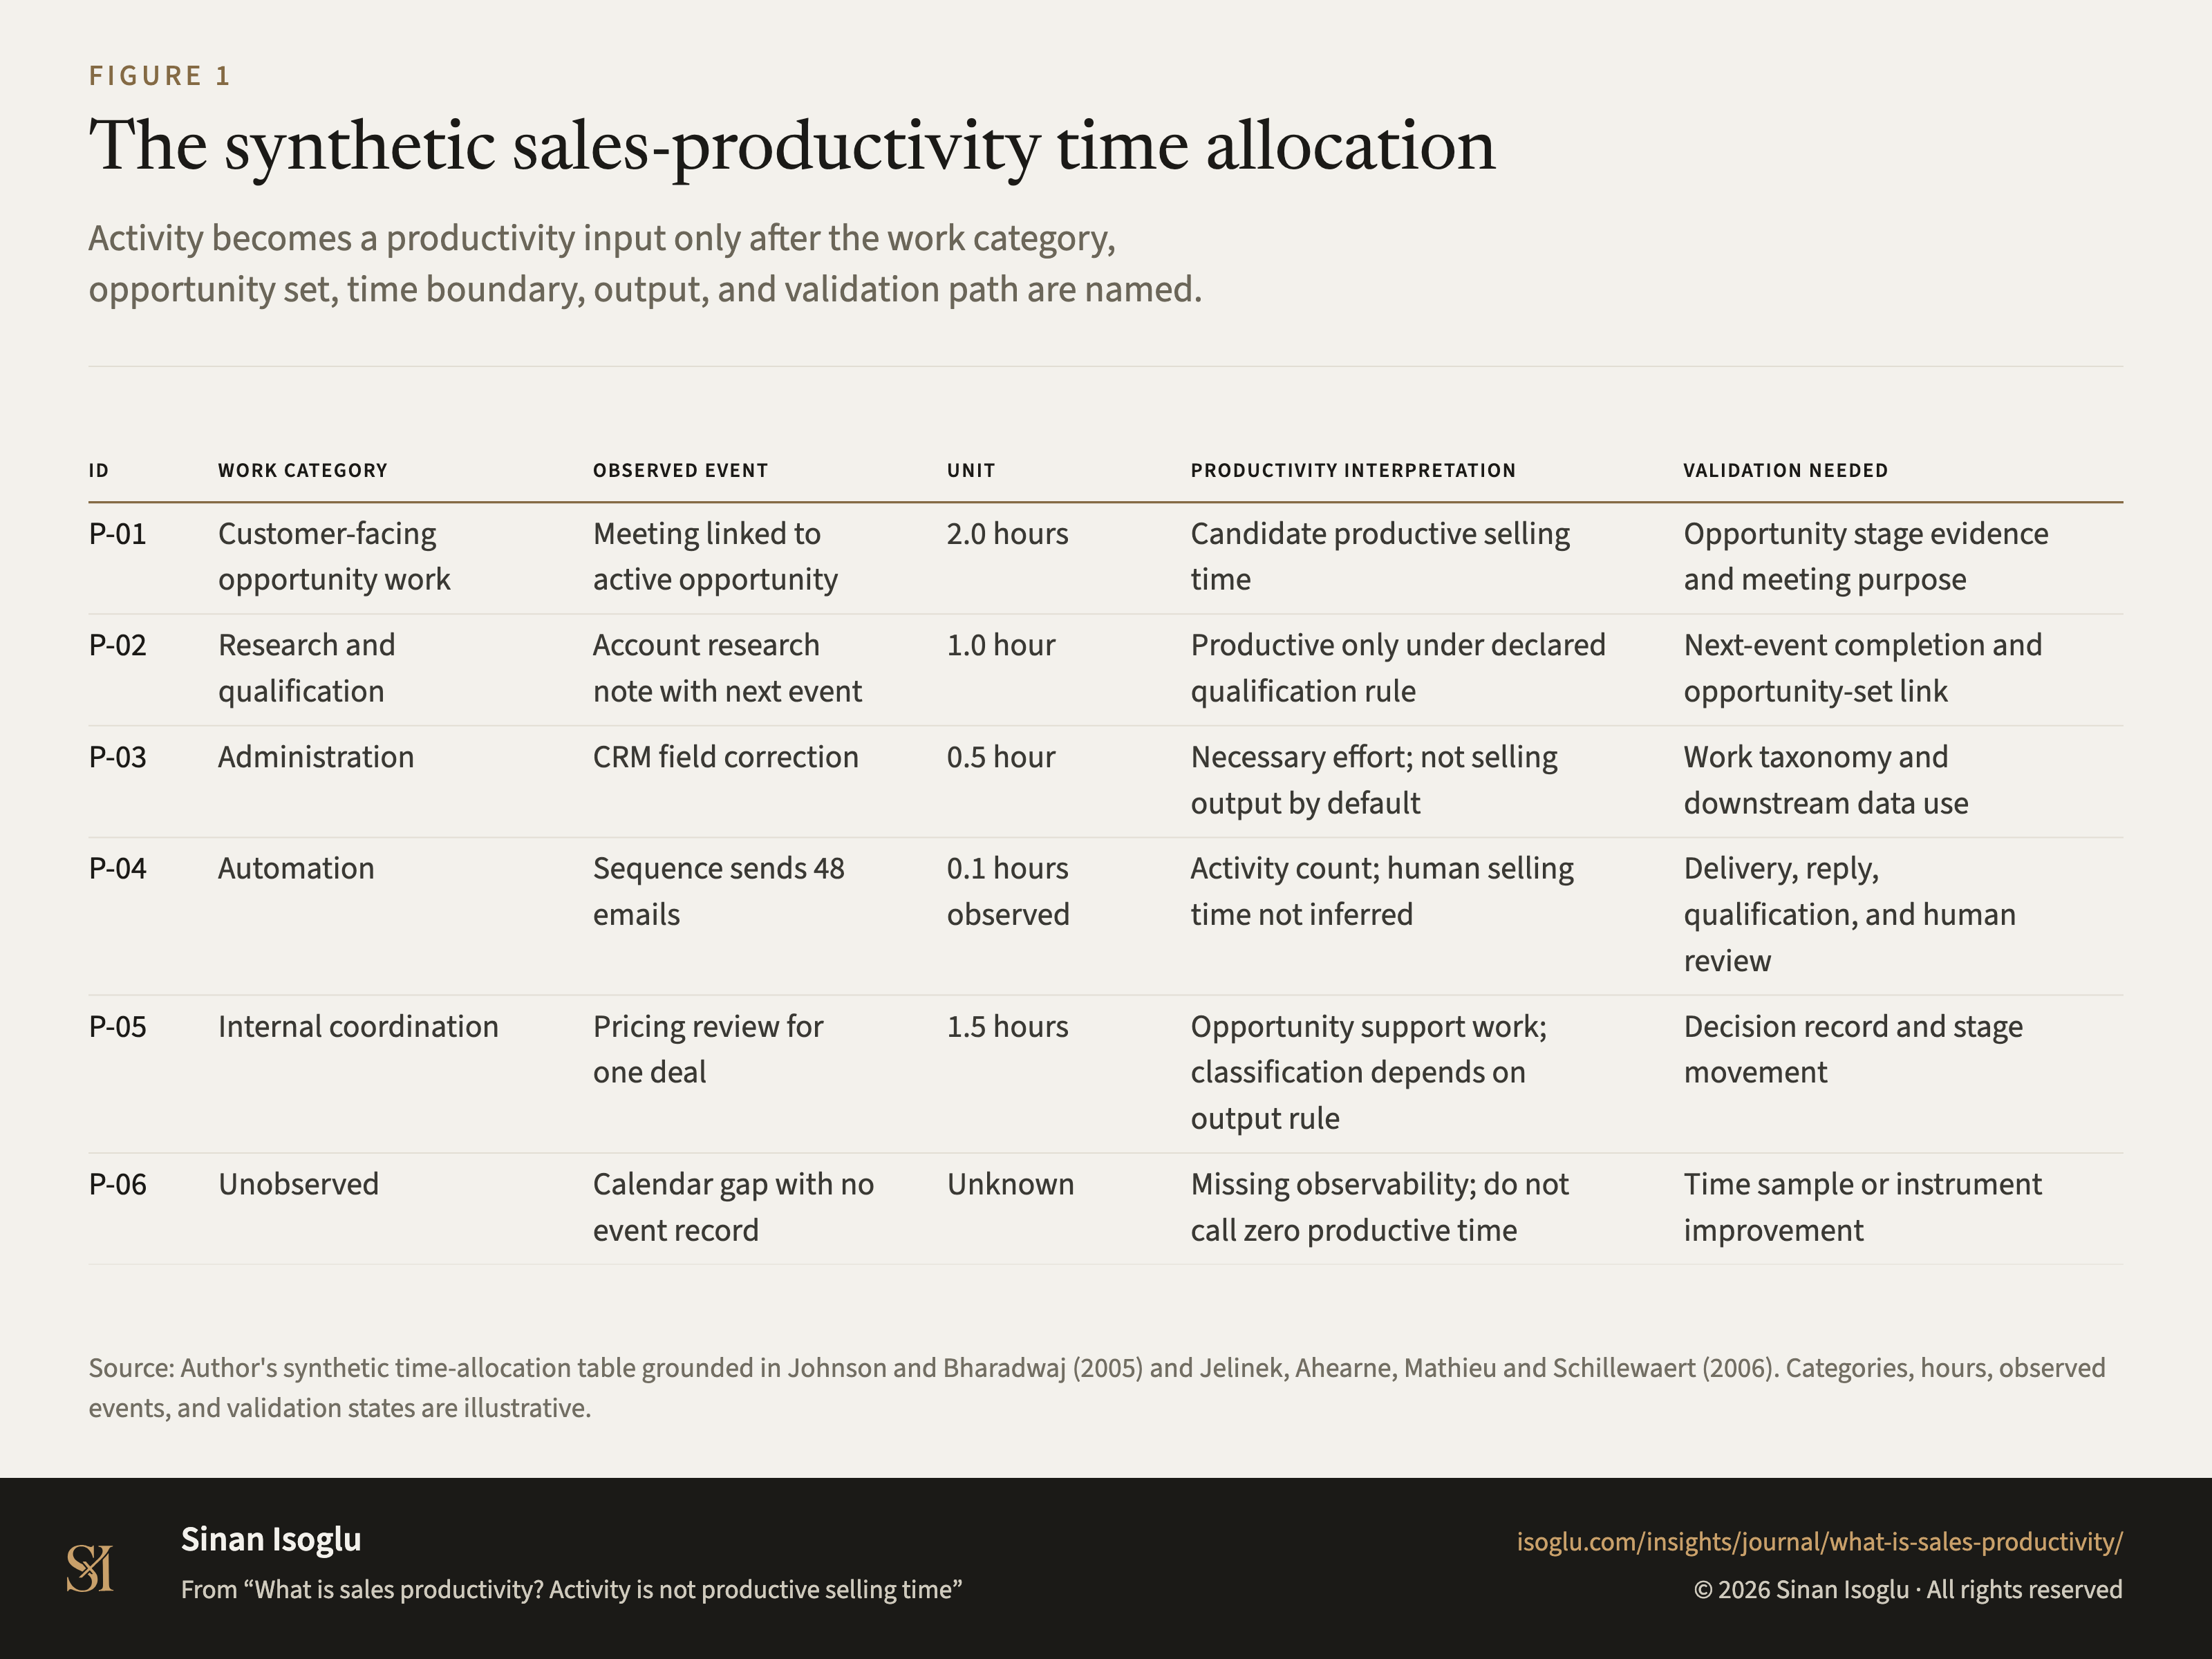
Figure 1Figure
The synthetic sales-productivity time allocation
What is sales productivity? Activity is not productive selling time
Contact
Bring the question you're working on.
Research, a guest lecture, or a commercial question.