← Every exhibit
Four cuts of data you already have
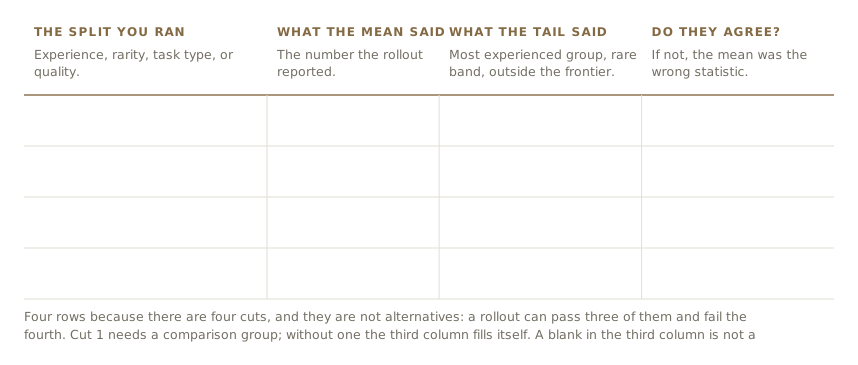
One row per cut. The third column is the one a mean cannot fill in, and a blank there is not a pass.
Reference & Evidence
Source: Author's own worksheet.
Related exhibits
-
What each of these studies actually measured
From the essay What AI actually changes in revenue operations
-
What do forecast categories mean?
From the essay What are forecast categories? Names need stable decision rules
-
What does product-qualified lead mean?
From the essay What is a product-qualified lead? Product use is not buying intent