Figure 1From “Pipeline coverage hides a conversion distribution”
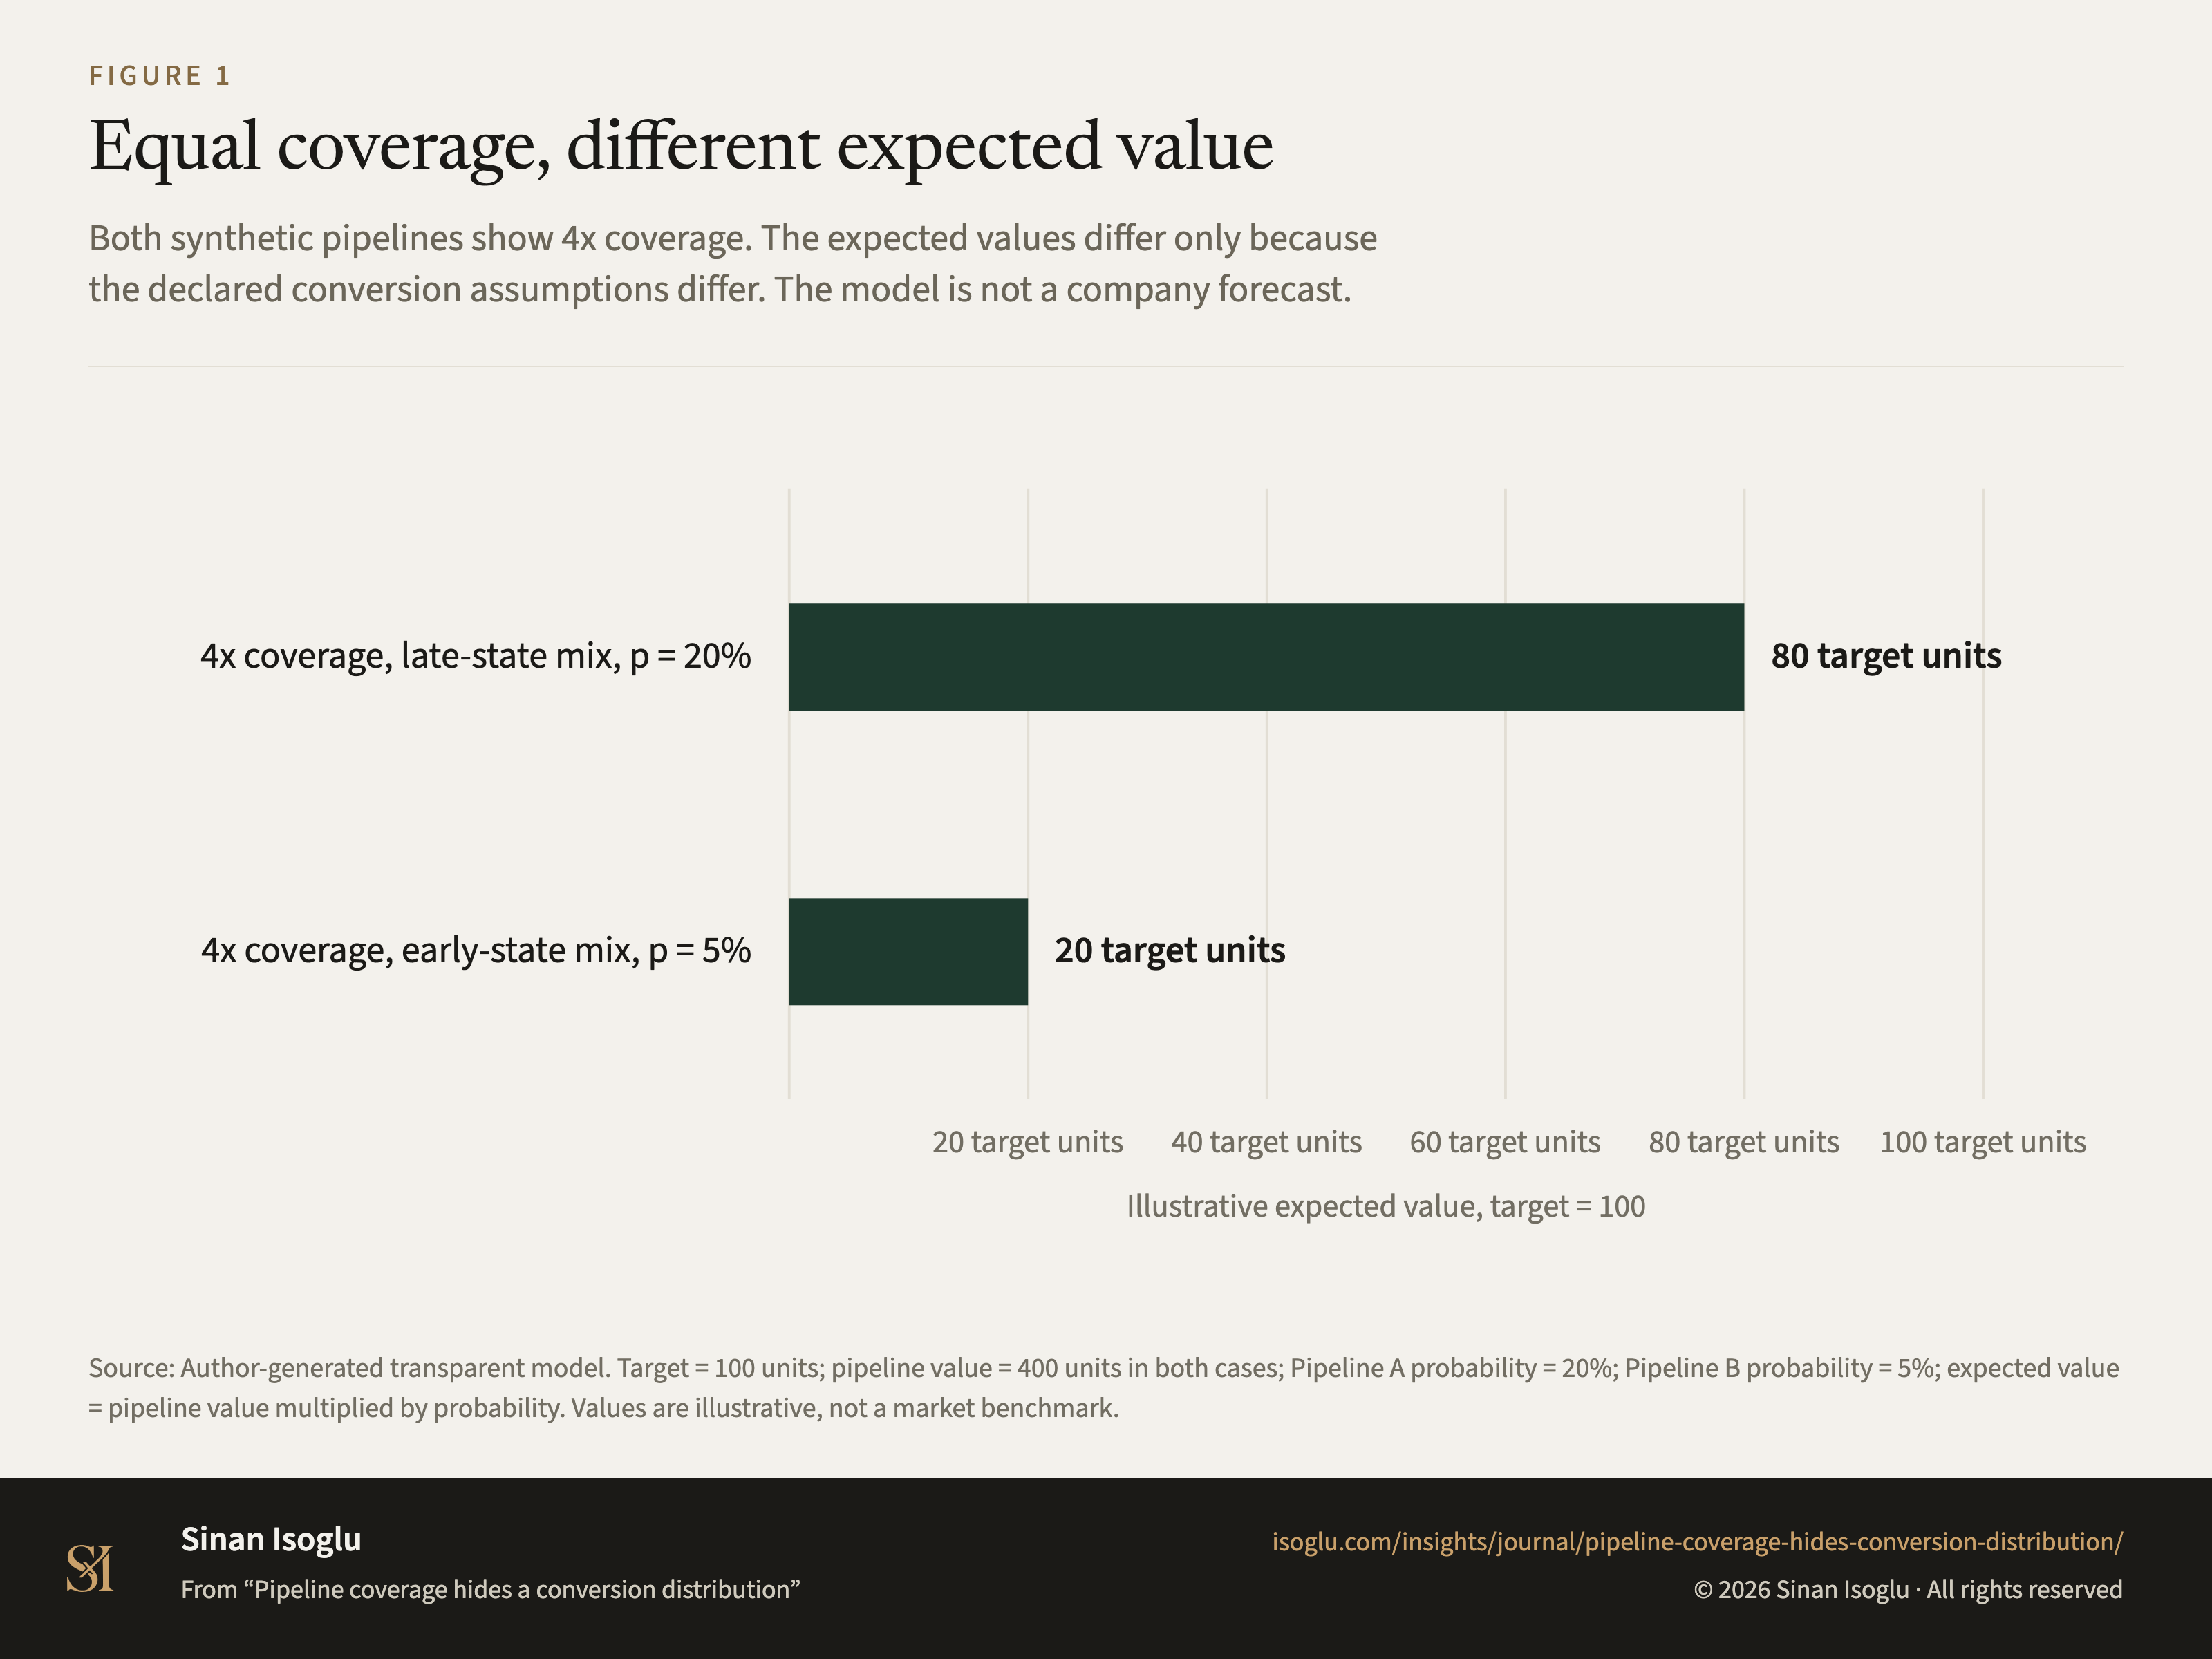
Equal coverage, different expected value
Both synthetic pipelines show 4x coverage. The expected values differ only because the declared conversion assumptions differ. The model is not a company forecast.
Figure 1Equal coverage, different expected value
Source: Author-generated transparent model. Target = 100 units; pipeline value = 400 units in both cases; Pipeline A probability = 20%; Pipeline B probability = 5%; expected value = pipeline value multiplied by probability. Values are illustrative, not a market benchmark.
From the essay
Revenue operations & AI
Pipeline coverage hides a conversion distribution
The same coverage multiple can contain different stage mixes and expected outcomes. State the probability model before trusting the total.
Read the essayThis exhibit belongs to an essay: the numbers live here, the argument lives there.
Cite or embed
Related exhibits
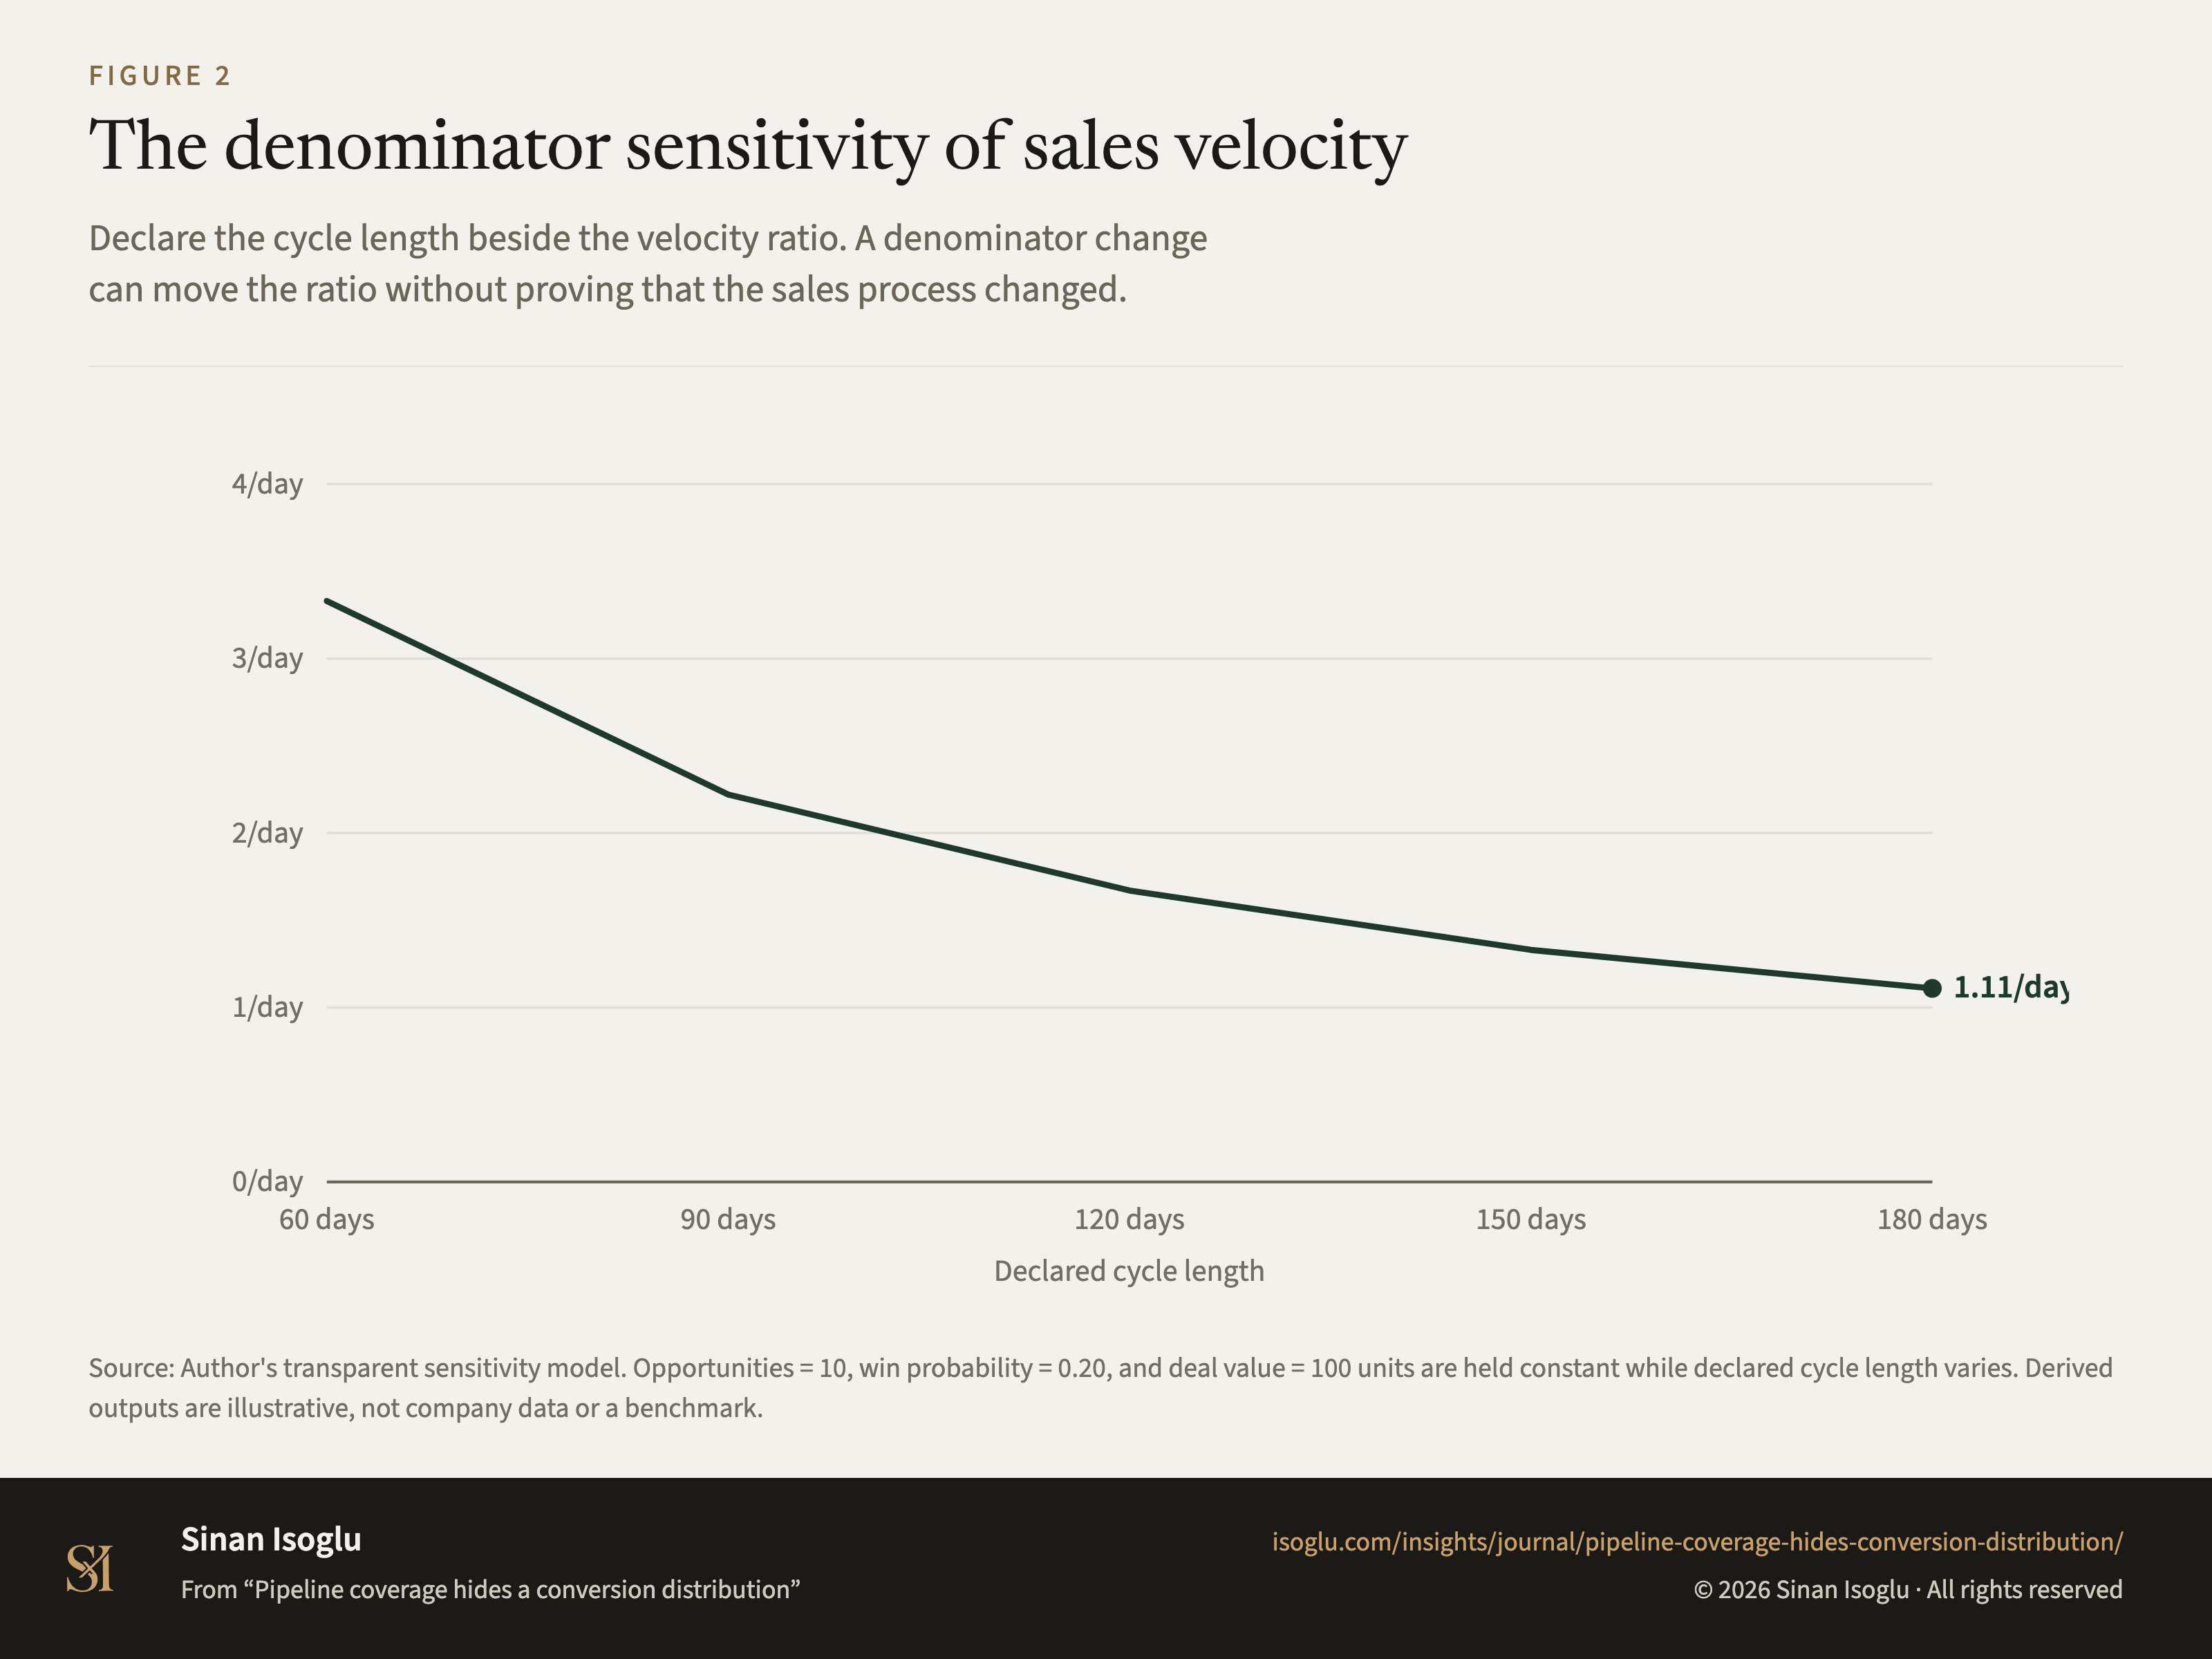
Figure 2Figure
The denominator sensitivity of sales velocity
Pipeline coverage hides a conversion distribution
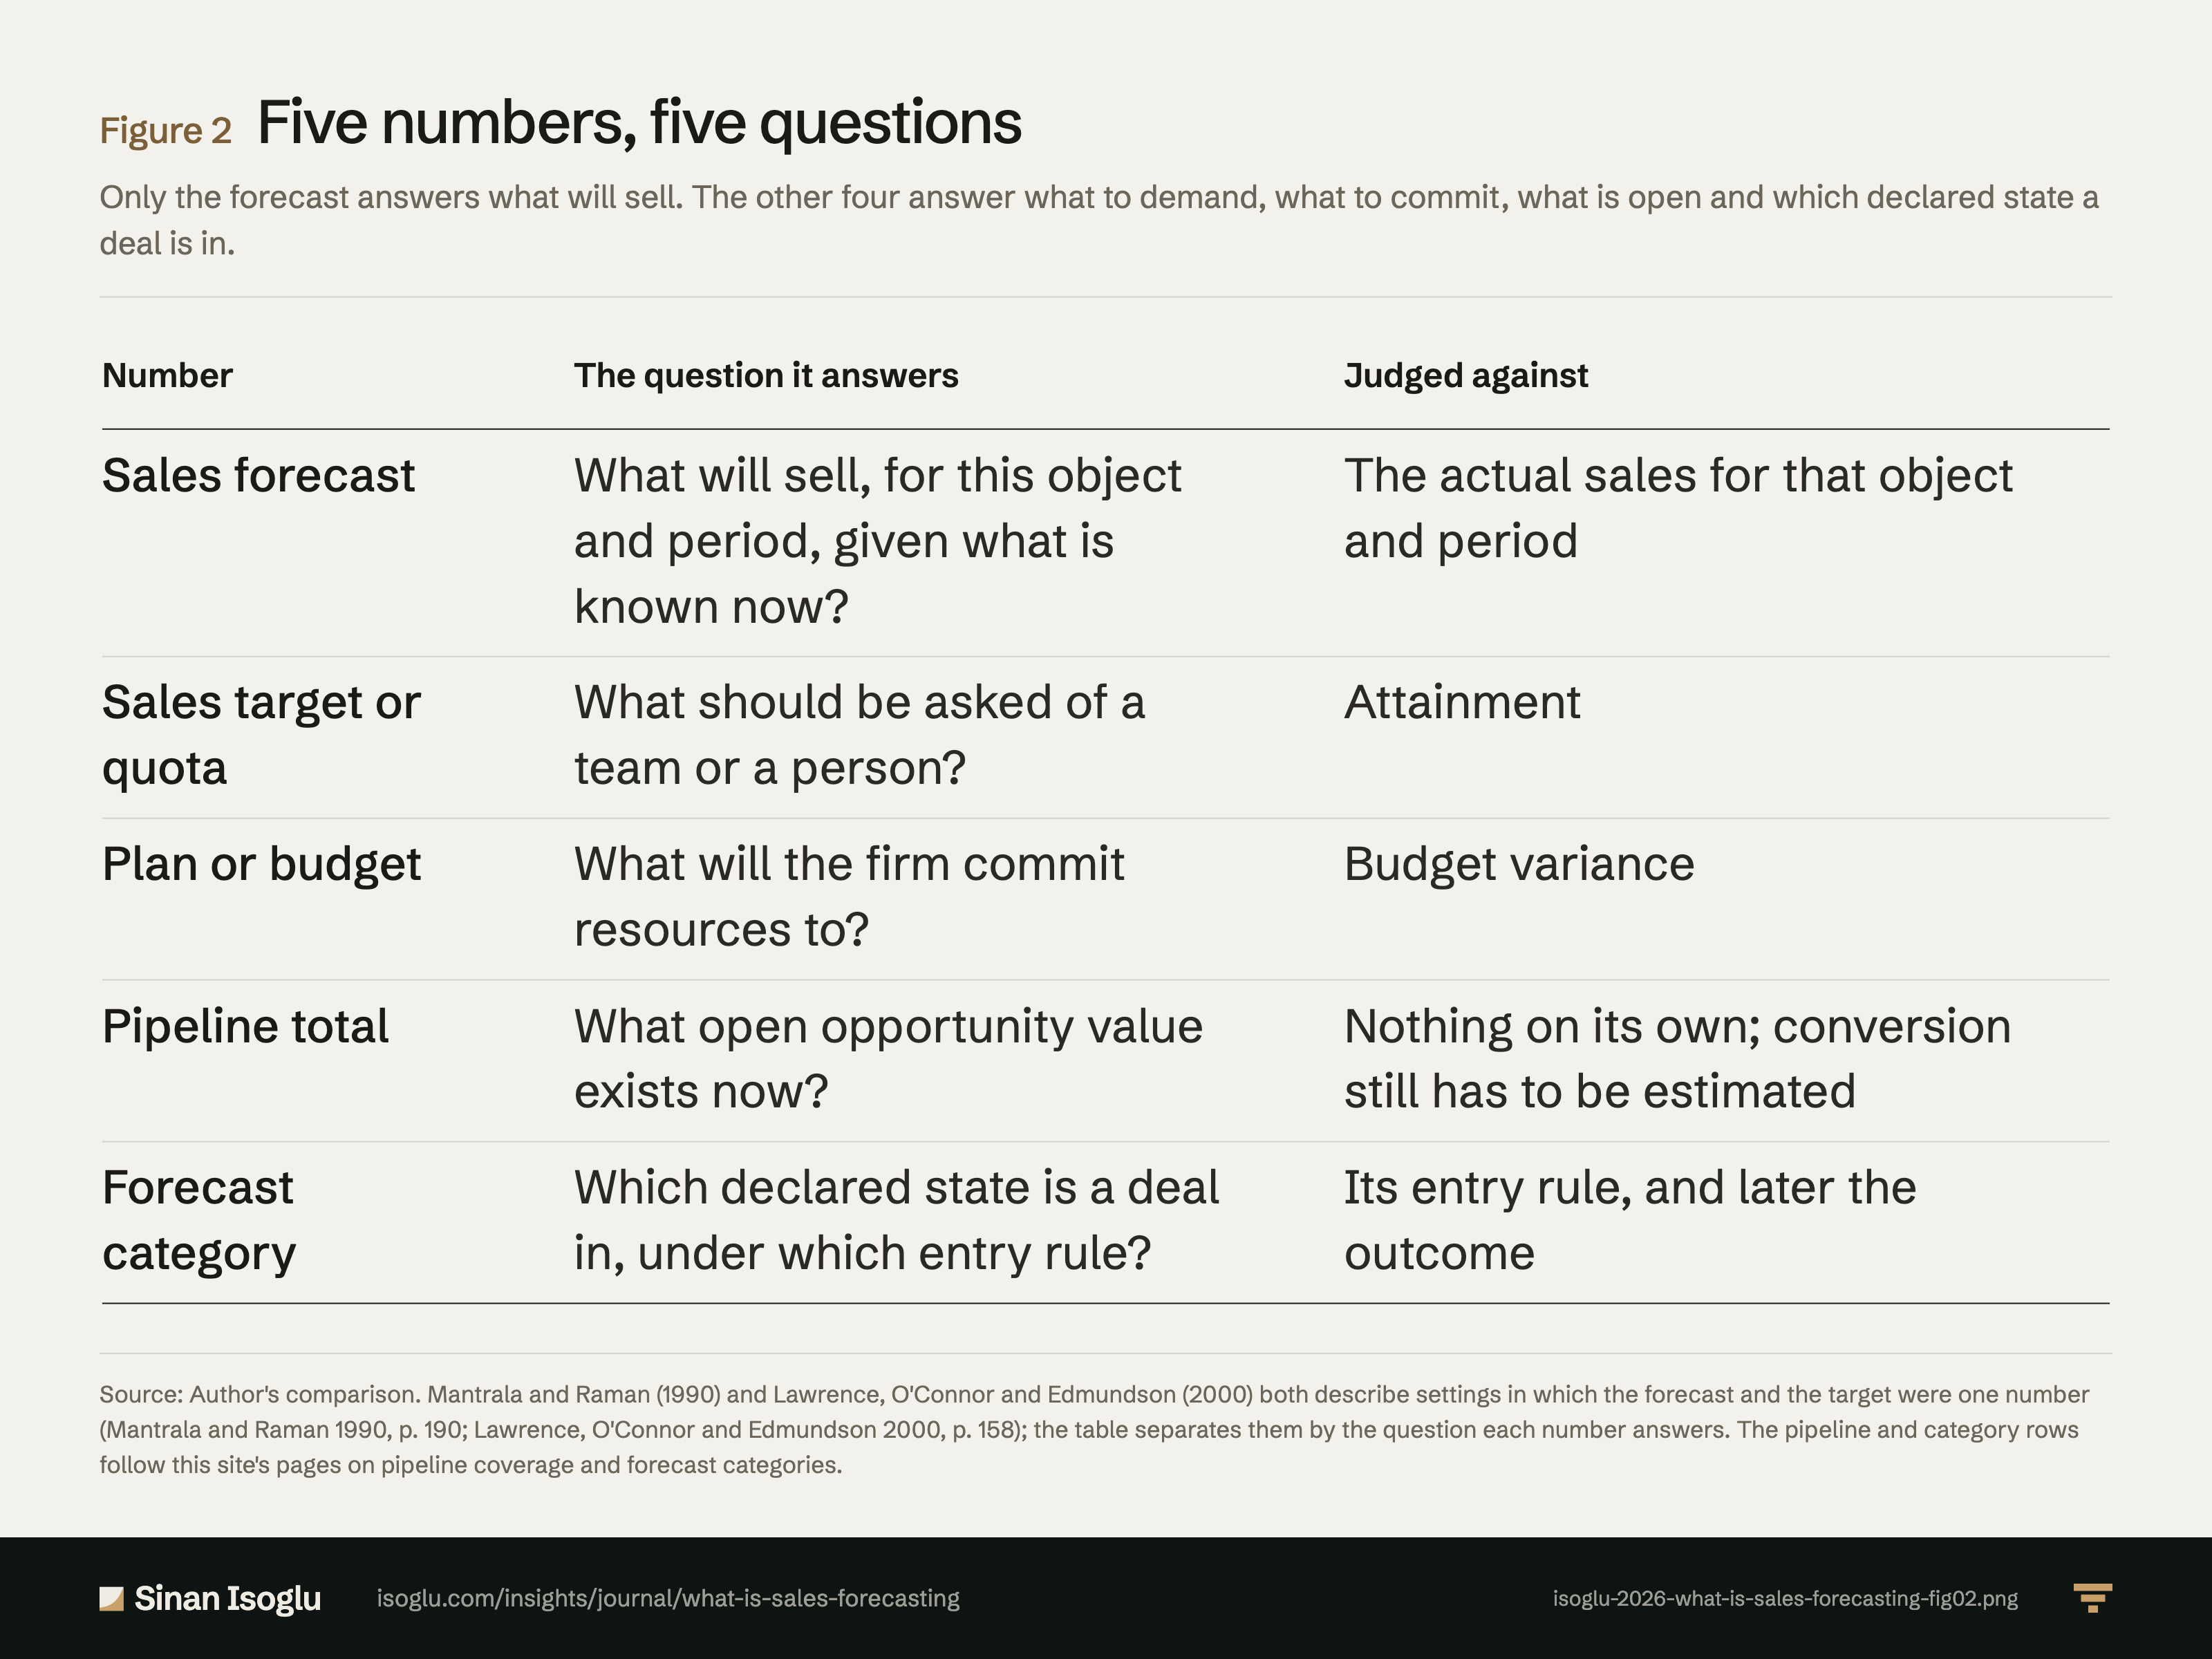
Figure 2Figure
Five numbers, five questions
What is sales forecasting?
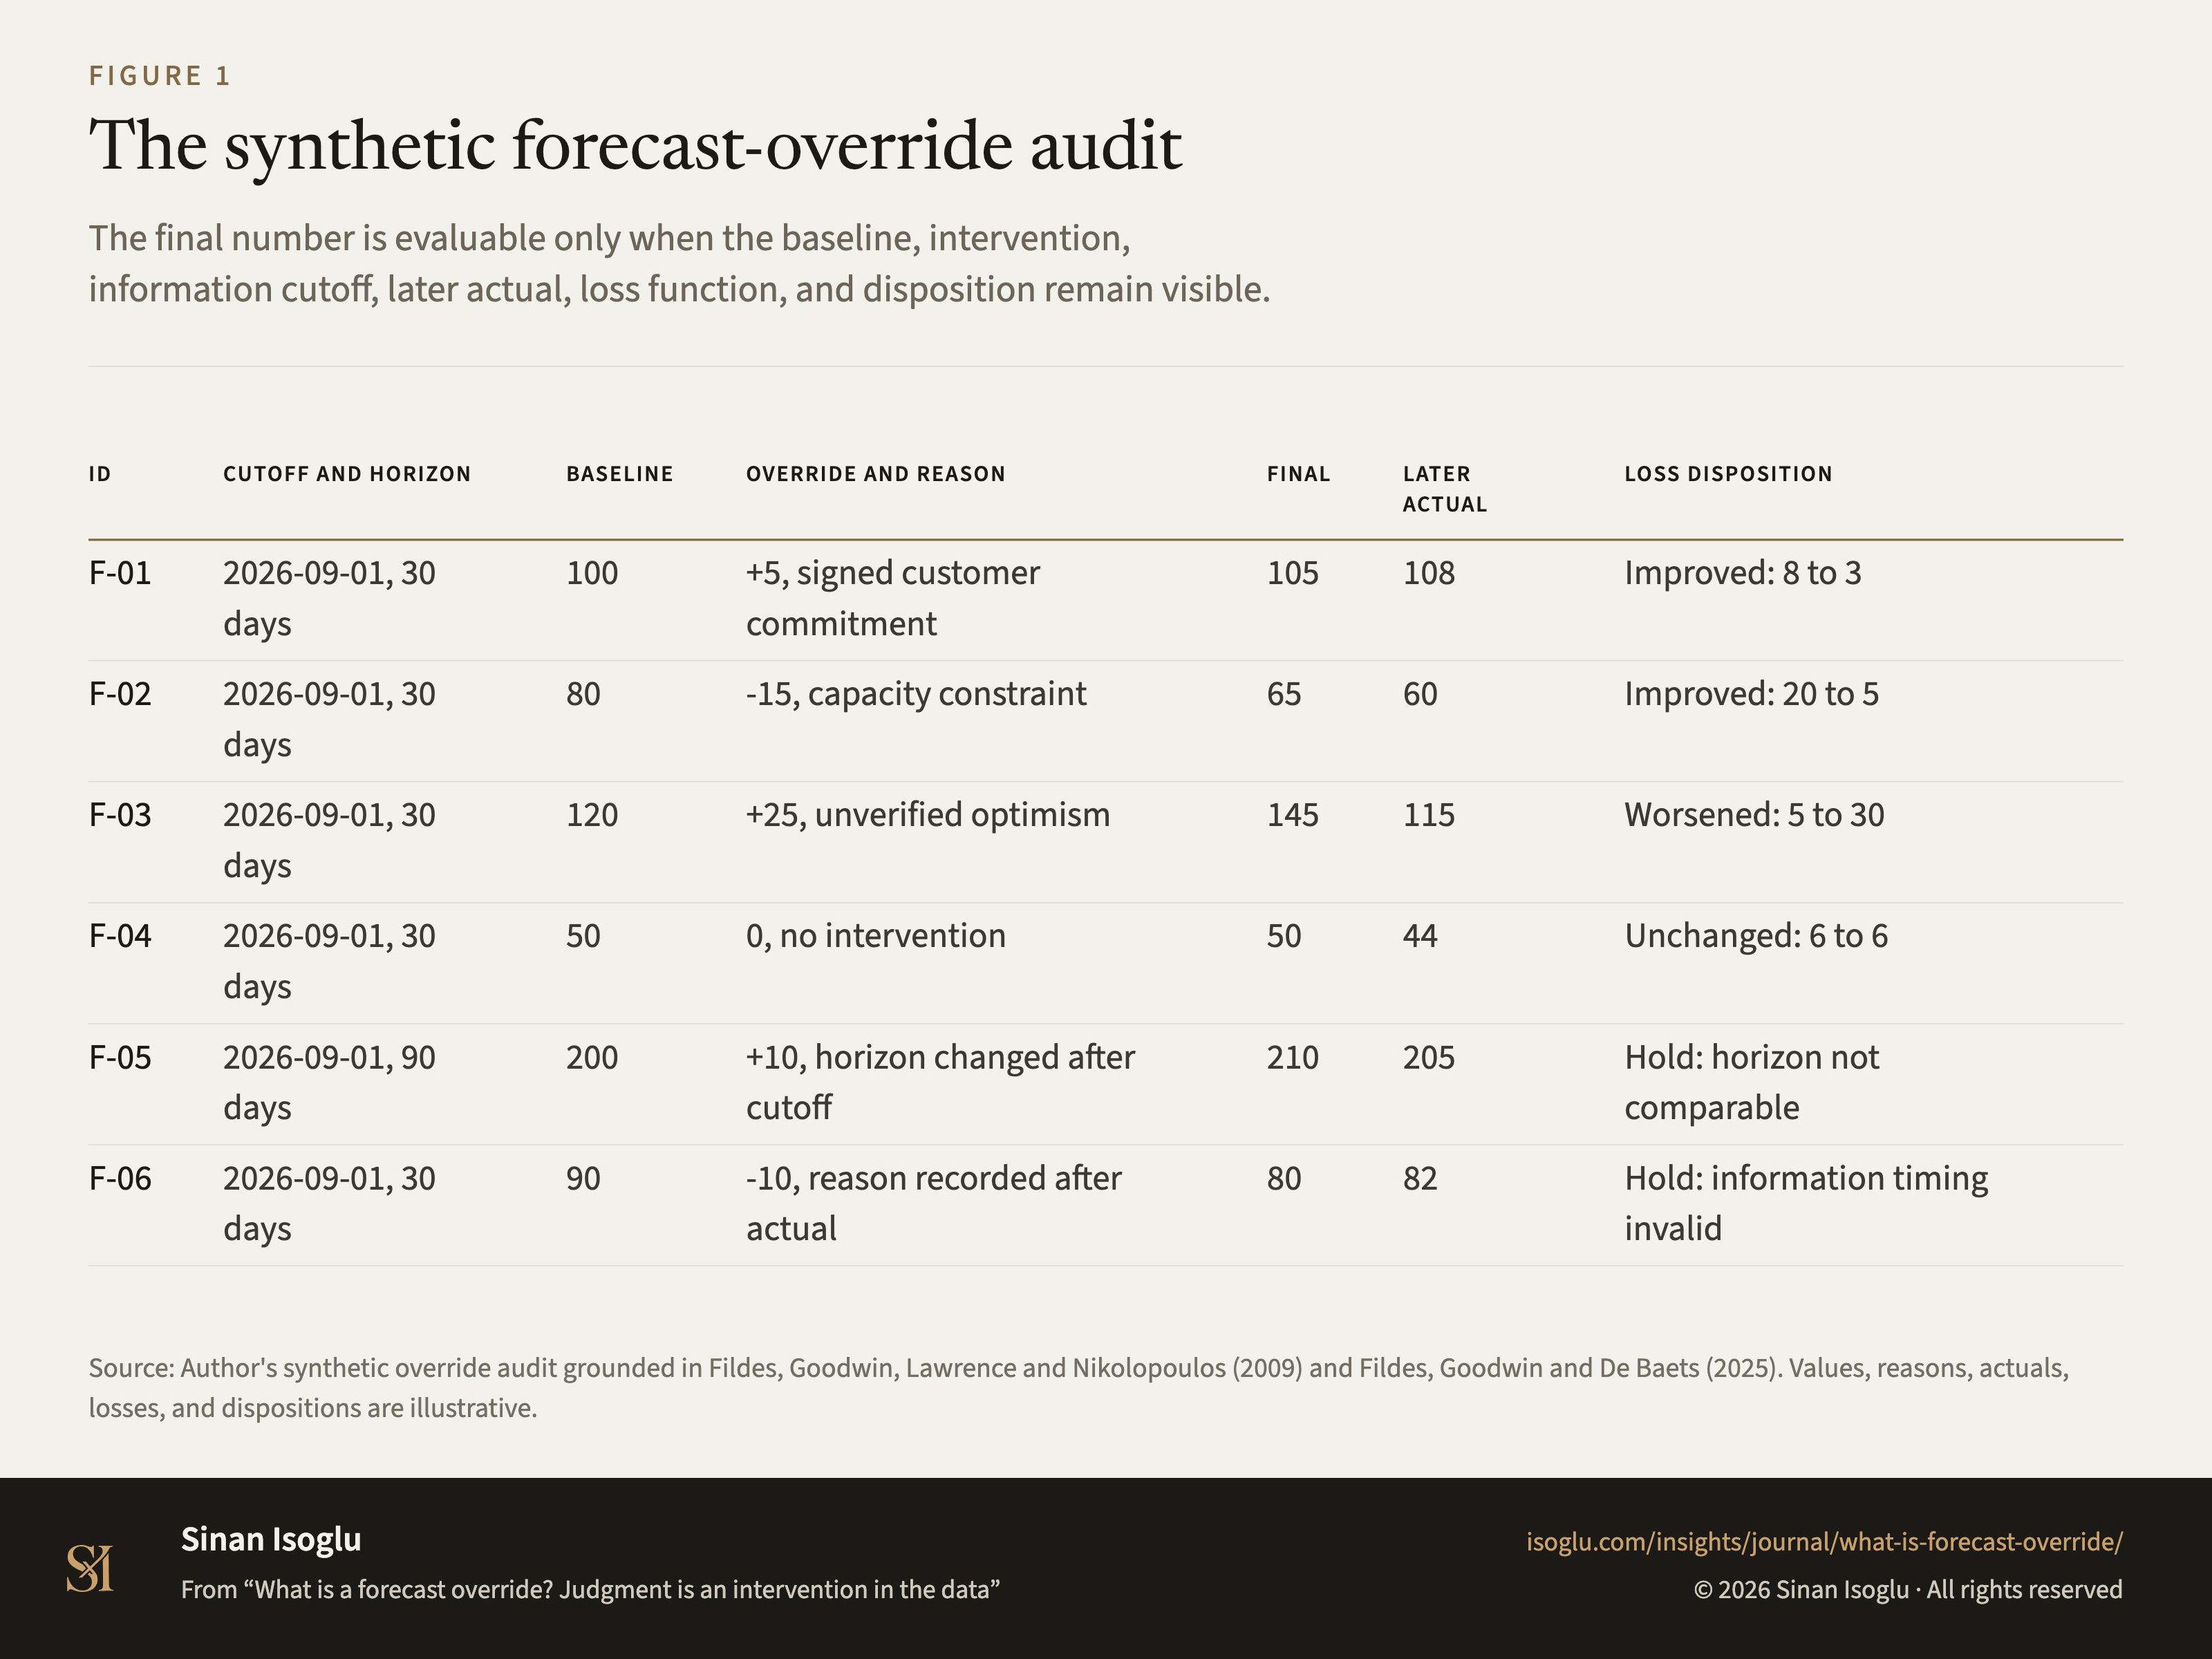
Figure 1Figure
The synthetic forecast-override audit
What is a forecast override? Judgment is an intervention in the data
Contact
Bring the question you're working on.
Research, a guest lecture, or a commercial question.