← Every exhibit
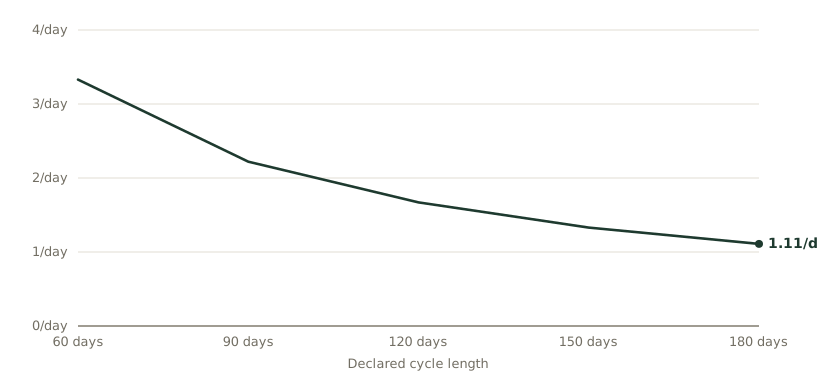
The denominator sensitivity of sales velocity
Declare the cycle length beside the velocity ratio. A denominator change can move the ratio without proving that the sales process changed.
Reference & Evidence
Source: Author's transparent sensitivity model. Opportunities = 10, win probability = 0.20, and deal value = 100 units are held constant while declared cycle length varies. Derived outputs are illustrative, not company data or a benchmark.
Related exhibits
-
Equal coverage, different expected value
From the essay Pipeline coverage hides a conversion distribution
-
Declare the cycle before comparing it
From the essay The sales-cycle number changes when the stages change
-
What should a sales enablement metric measure?
From the essay What are sales enablement metrics? Measure behavior change before activity