← Every exhibit
Table 1From “The LTV:CAC ratio hides the timing”
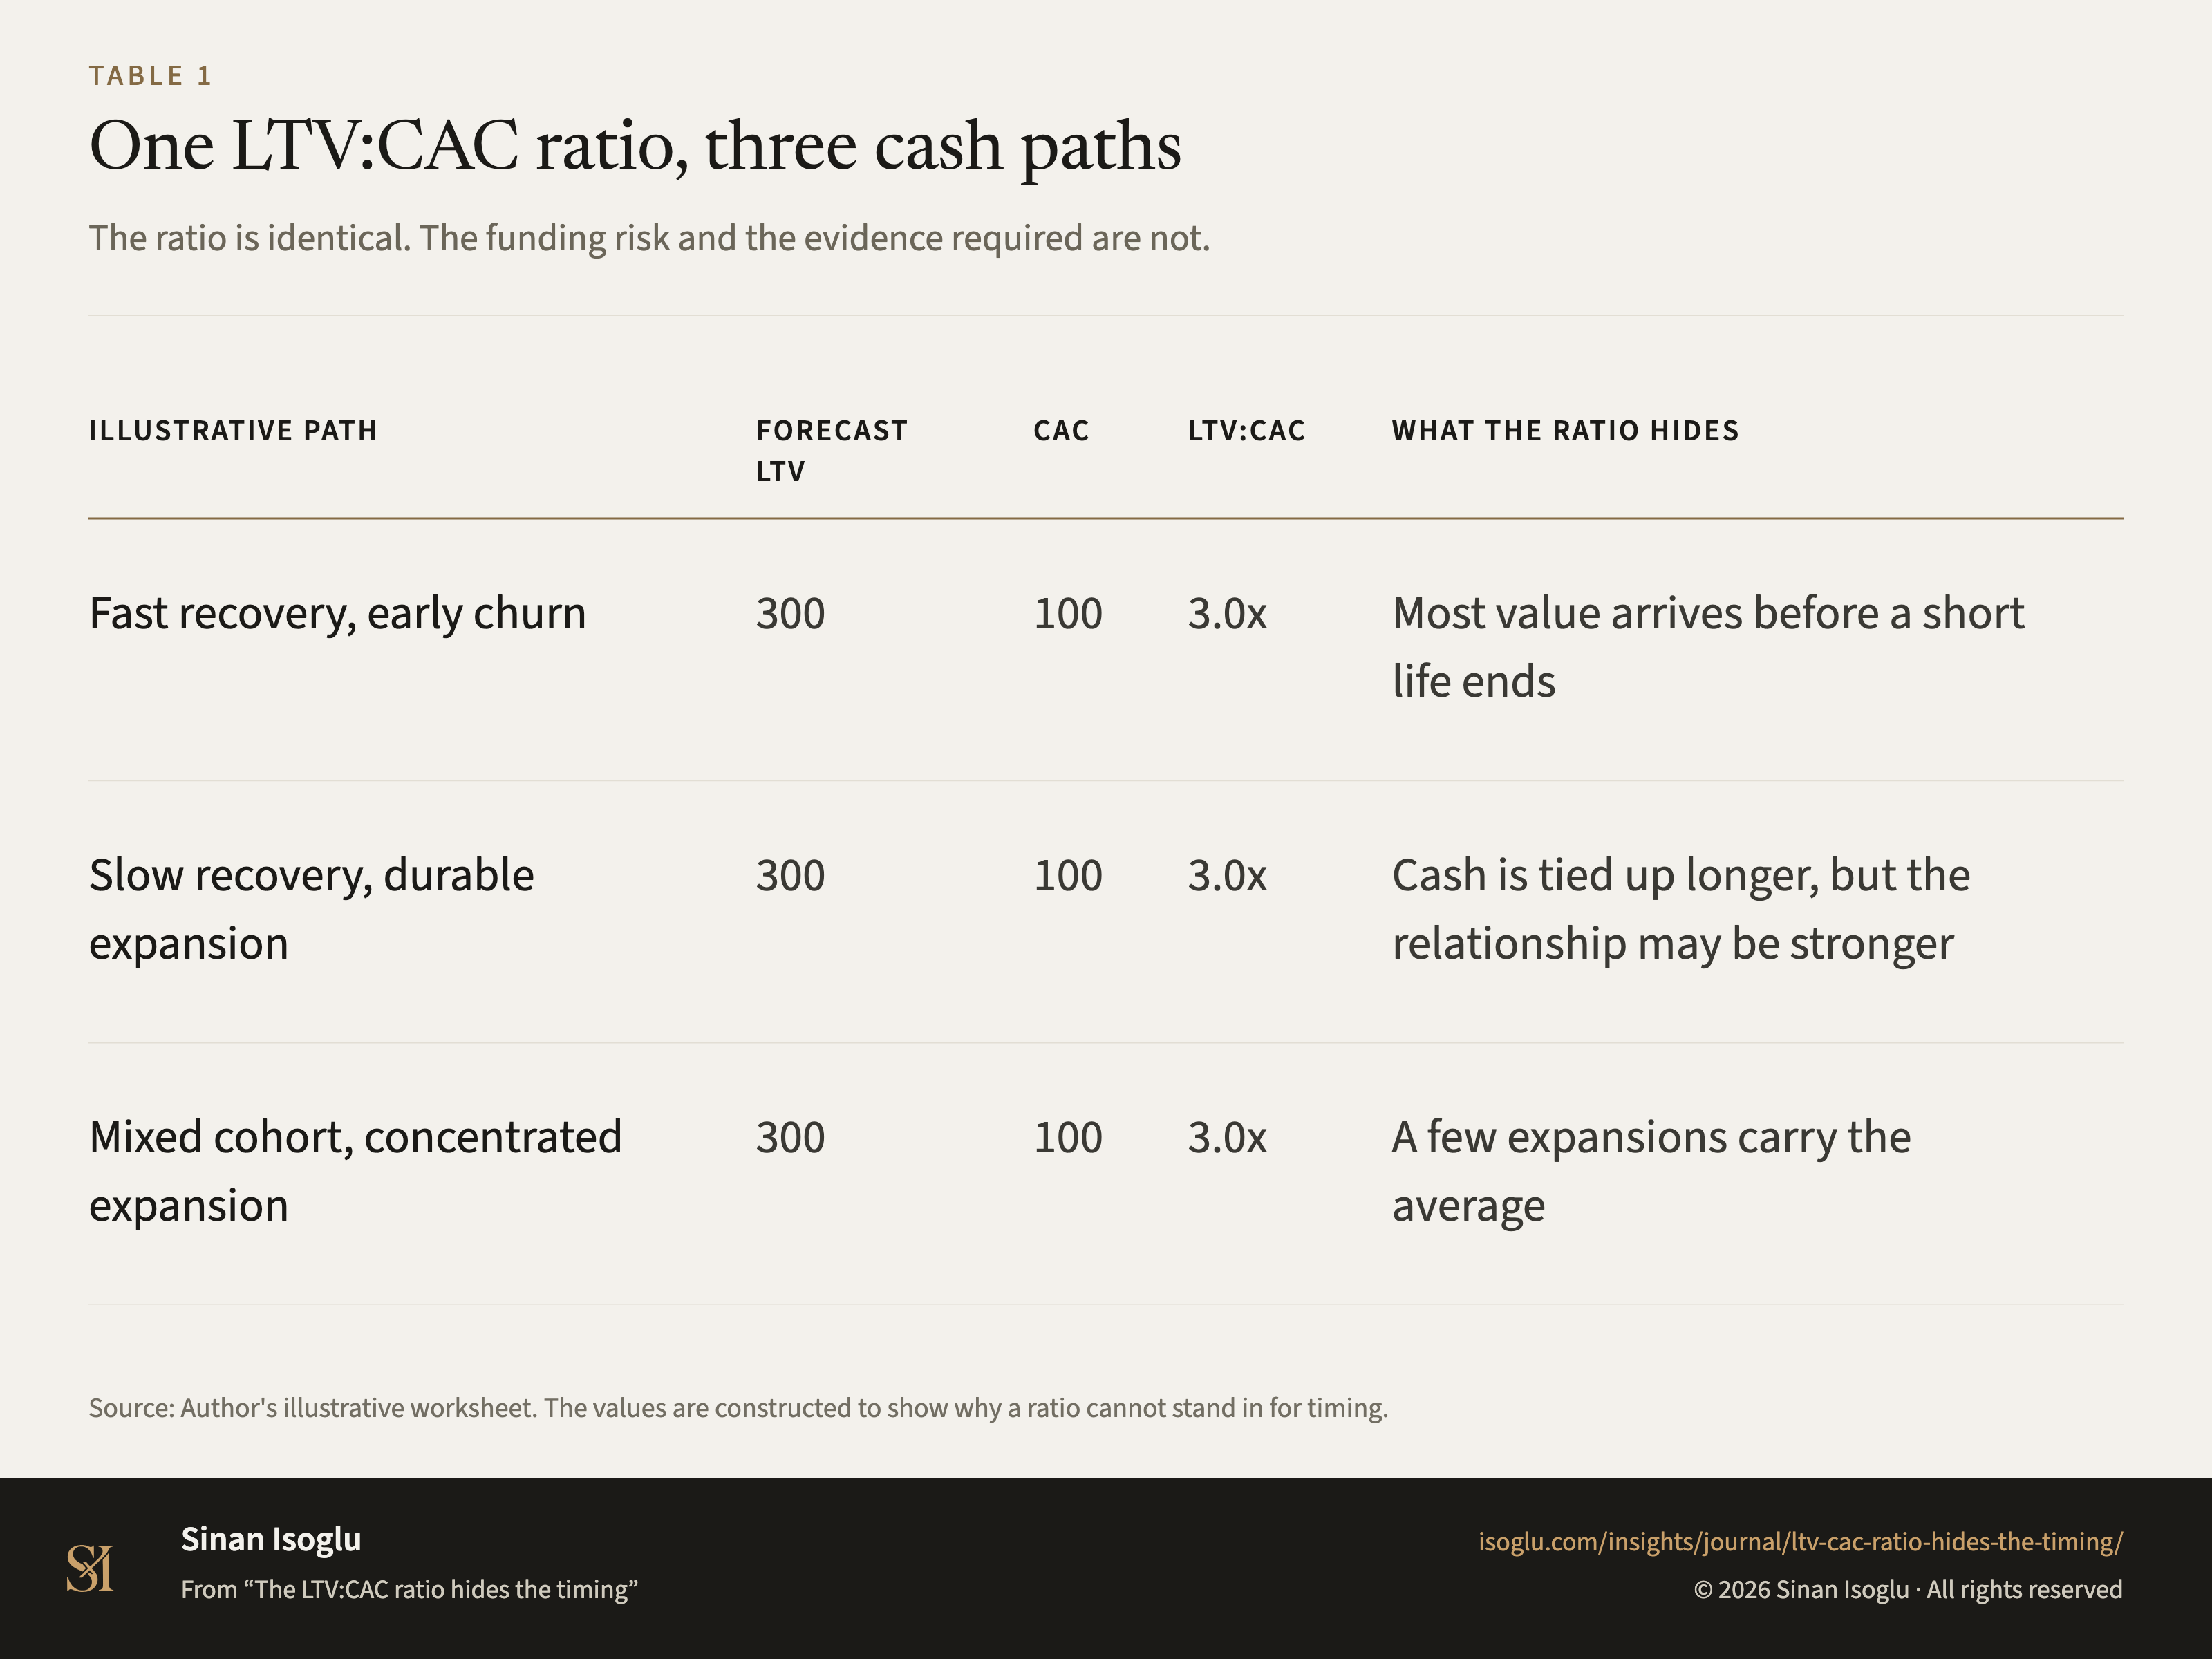
One LTV:CAC ratio, three cash paths
The ratio is identical. The funding risk and the evidence required are not.
Table 1One LTV:CAC ratio, three cash paths
| Illustrative path | Forecast LTV | CAC | LTV:CAC | What the ratio hides |
|---|---|---|---|---|
| Fast recovery, early churn | 300 | 100 | 3.0x | Most value arrives before a short life ends |
| Slow recovery, durable expansion | 300 | 100 | 3.0x | Cash is tied up longer, but the relationship may be stronger |
| Mixed cohort, concentrated expansion | 300 | 100 | 3.0x | A few expansions carry the average |
Swipe or scroll horizontally if the table is wider than your screen.
Source: Author's illustrative worksheet. The values are constructed to show why a ratio cannot stand in for timing.
PNG4:3, 1600 × 1200, with the title, the source line and the attribution set in the image isoglu-2026-ltv-cac-ratio-hides-the-timing-fig01.png
From the essay
Growth that compounds
The LTV:CAC ratio hides the timing
The LTV:CAC ratio compares a forecast with an acquisition cost, but not when cash returns. Put payback, margin and cohort risk beside the ratio.
Read the essayThis exhibit belongs to an essay: the numbers live here, the argument lives there.
Cite or embed
Related exhibits


Contact
Bring the question you're working on.
Research, a guest lecture, or a commercial question.