Table 1From “Go-to-market strategy is a resource-allocation system”
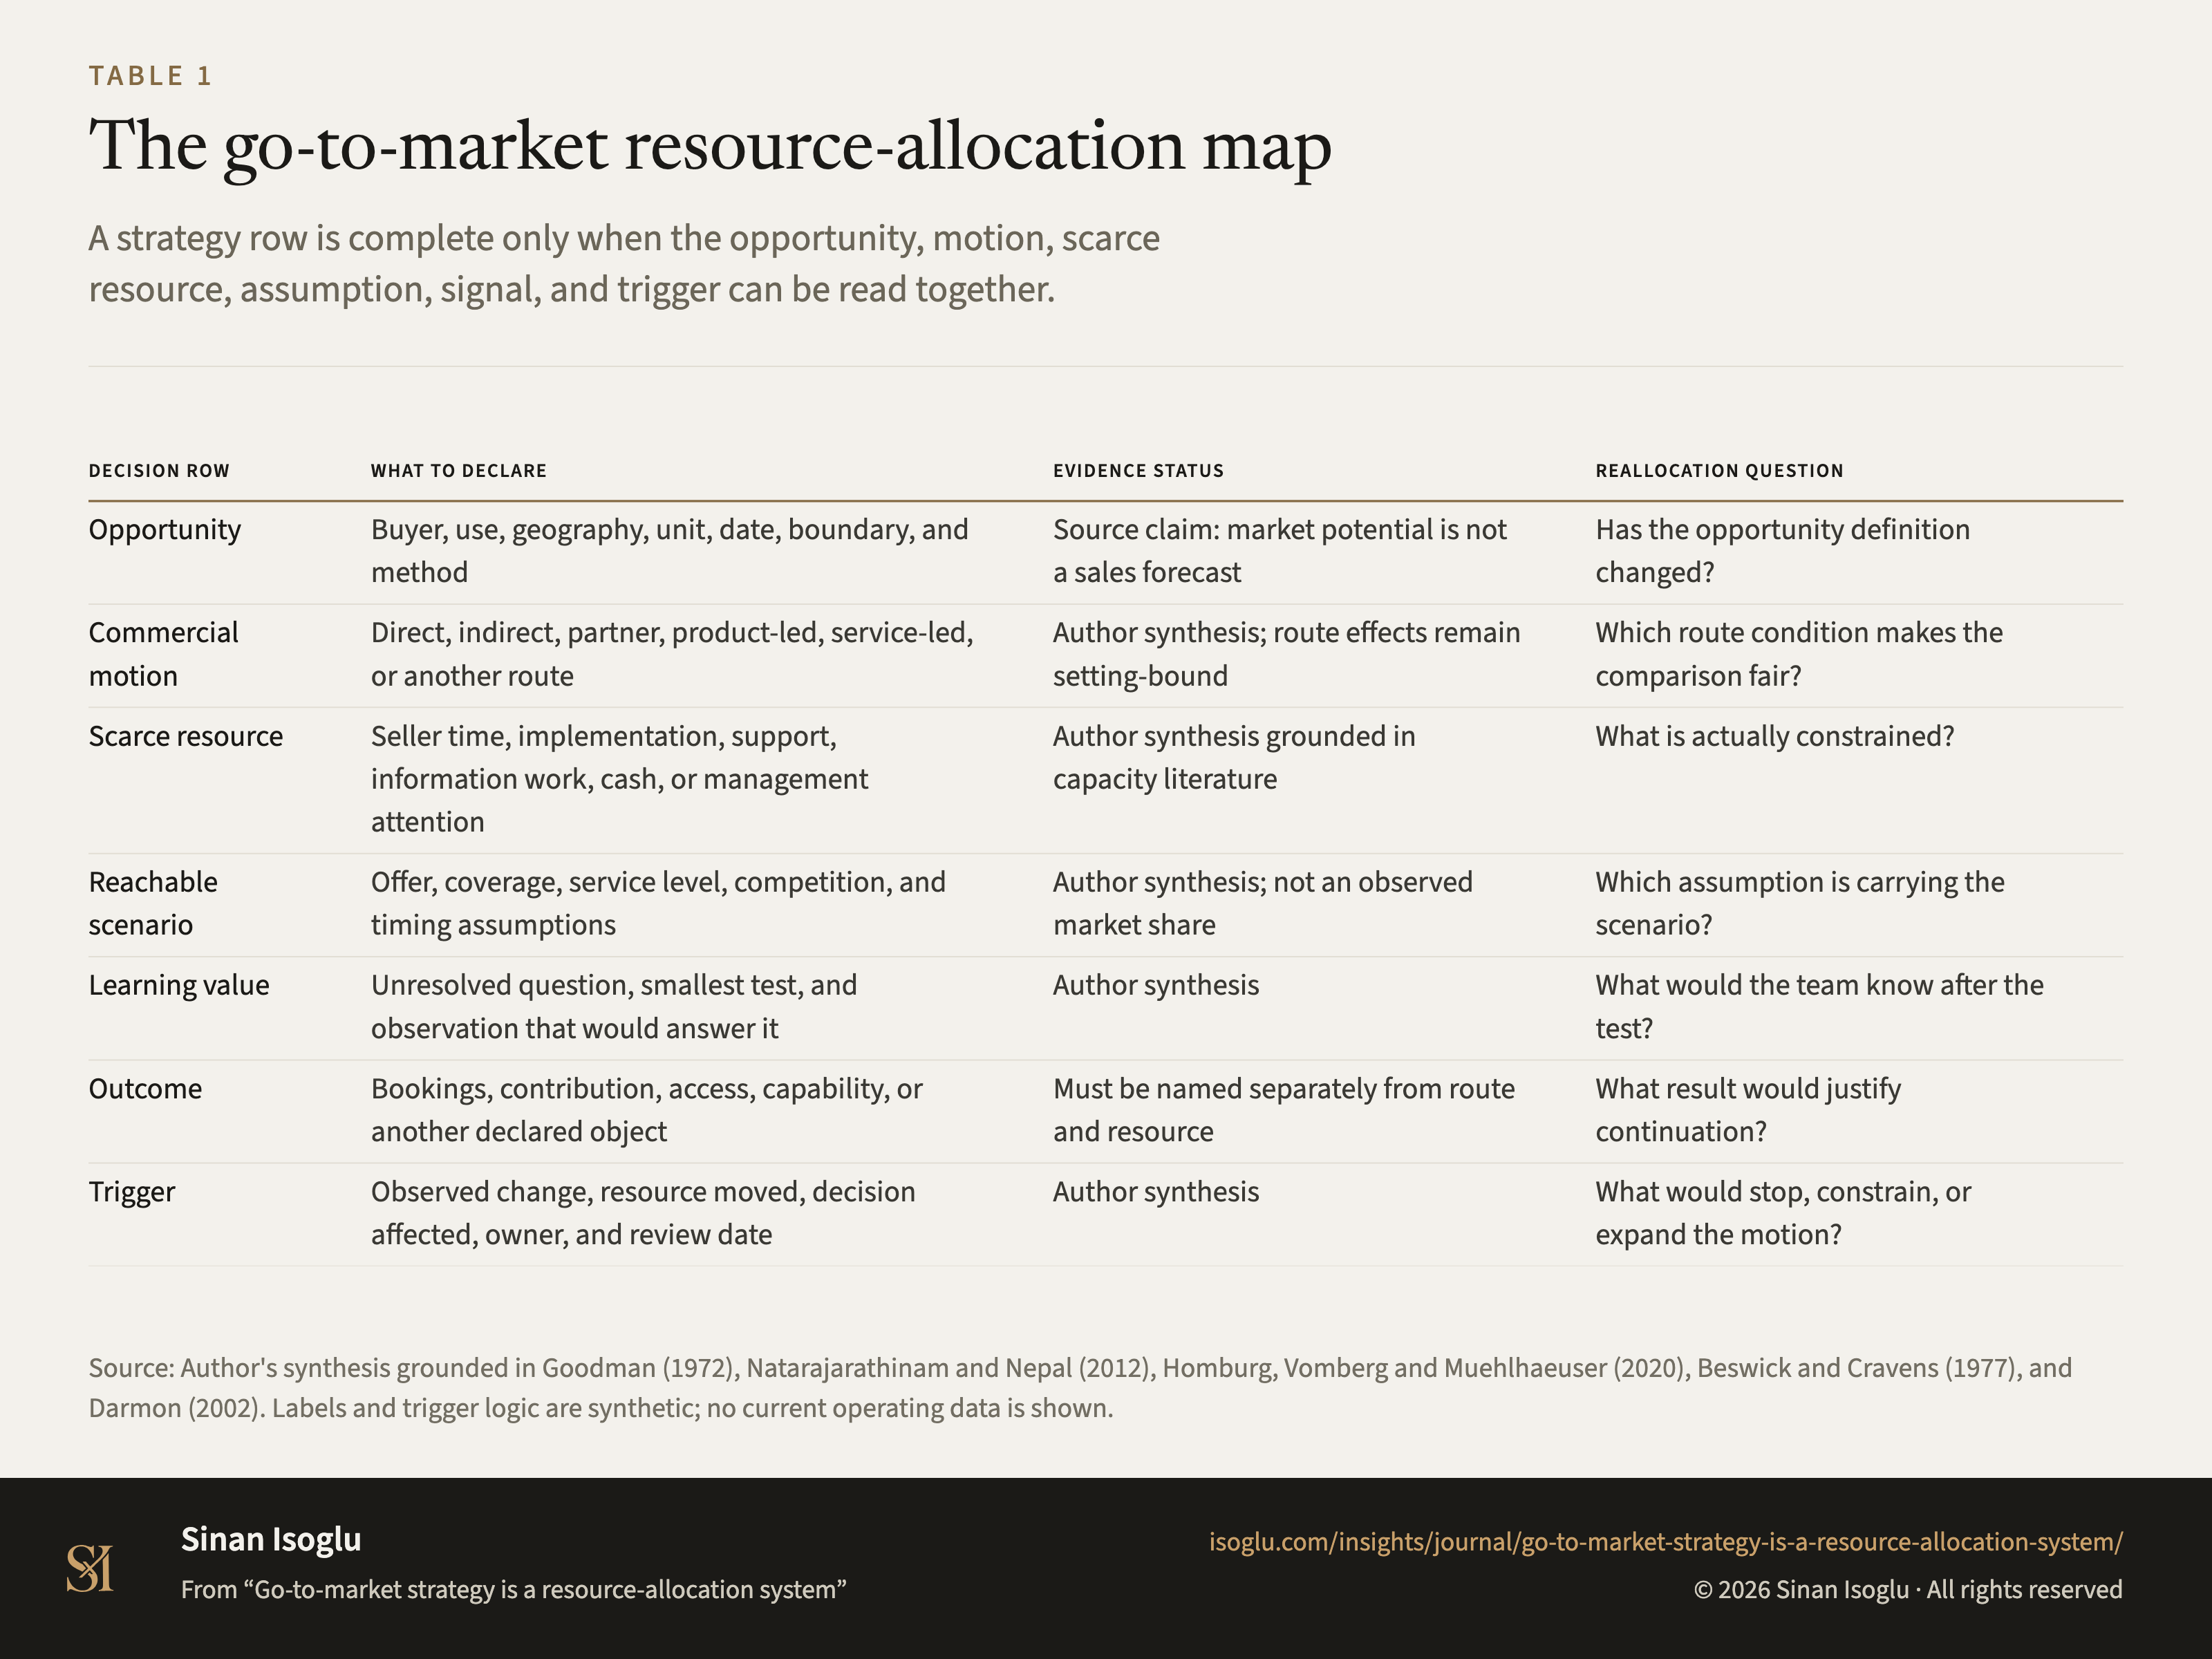
The go-to-market resource-allocation map
A strategy row is complete only when the opportunity, motion, scarce resource, assumption, signal, and trigger can be read together.
Table 1The go-to-market resource-allocation map
| Decision row | What to declare | Evidence status | Reallocation question |
|---|---|---|---|
| Opportunity | Buyer, use, geography, unit, date, boundary, and method | Source claim: market potential is not a sales forecast | Has the opportunity definition changed? |
| Commercial motion | Direct, indirect, partner, product-led, service-led, or another route | Author synthesis; route effects remain setting-bound | Which route condition makes the comparison fair? |
| Scarce resource | Seller time, implementation, support, information work, cash, or management attention | Author synthesis grounded in capacity literature | What is actually constrained? |
| Reachable scenario | Offer, coverage, service level, competition, and timing assumptions | Author synthesis; not an observed market share | Which assumption is carrying the scenario? |
| Learning value | Unresolved question, smallest test, and observation that would answer it | Author synthesis | What would the team know after the test? |
| Outcome | Bookings, contribution, access, capability, or another declared object | Must be named separately from route and resource | What result would justify continuation? |
| Trigger | Observed change, resource moved, decision affected, owner, and review date | Author synthesis | What would stop, constrain, or expand the motion? |
Swipe or scroll horizontally if the table is wider than your screen.
Source: Author's synthesis grounded in Goodman (1972), Natarajarathinam and Nepal (2012), Homburg, Vomberg and Muehlhaeuser (2020), Beswick and Cravens (1977), and Darmon (2002). Labels and trigger logic are synthetic; no current operating data is shown.
Source and evidence
Each line names a claim related to this exhibit, its source, and how it was checked.
- B MSB27-C1 Goodman's own distinction: market potential is a measure "of an environmental state at a point in time (present or future)", whereas "sales forecasts are measures of expectation which are conditional upon inputs of the various marketing decision variables", and "it is usually necessary to rely on proxy data for most of the things a marketer would like to measure"Goodman. (1972)
- B MSB27-C2 The three stages are the paper's own: "The first step assesses the broad market potential of a country; the second step estimates the sales potential for a specific company, and the third step calculates return on investment for the company based on the resources required"Natarajarathinam & Nepal. (2012)
- B MSB27-C3 And each stage carries different conditions: "Each step of the methodology accounts for several external and internal factors", demonstrated on "An example of a fastener manufacturer targeting the Mexican market is used to demonstrate the applic"ation, so it is one worked case and not a formulaNatarajarathinam & Nepal. (2012)
- A CH1R-C1 The sign flips by route design, in the authors' words: "Whereas direct channel usage predominantly lowers agency conflicts in terms of information asymmetry and sales partner moral hazard, indirect channel usage" amplifies them. So an observed association can differ across direct and indirect route designsHomburg, Vomberg and Muehlhaeuser (2020), publisher PDF pp. 1, 9, and 13-16
Grades: A, verified against the printed page of the primary source · B, primary source, text layer only · C, authoritative secondary · D, reported.
From the essay
Go-to-market strategy
Go-to-market strategy is a resource-allocation system
A go-to-market strategy is credible only when it allocates scarce capacity across opportunity, route, service burden, learning, and a trigger.
Read the essayThis exhibit belongs to an essay: the numbers live here, the argument lives there.
Cite or embed
Contact
Bring the question you're working on.
Research, a guest lecture, or a commercial question.