Table 1From “Forecast value added is a process audit”
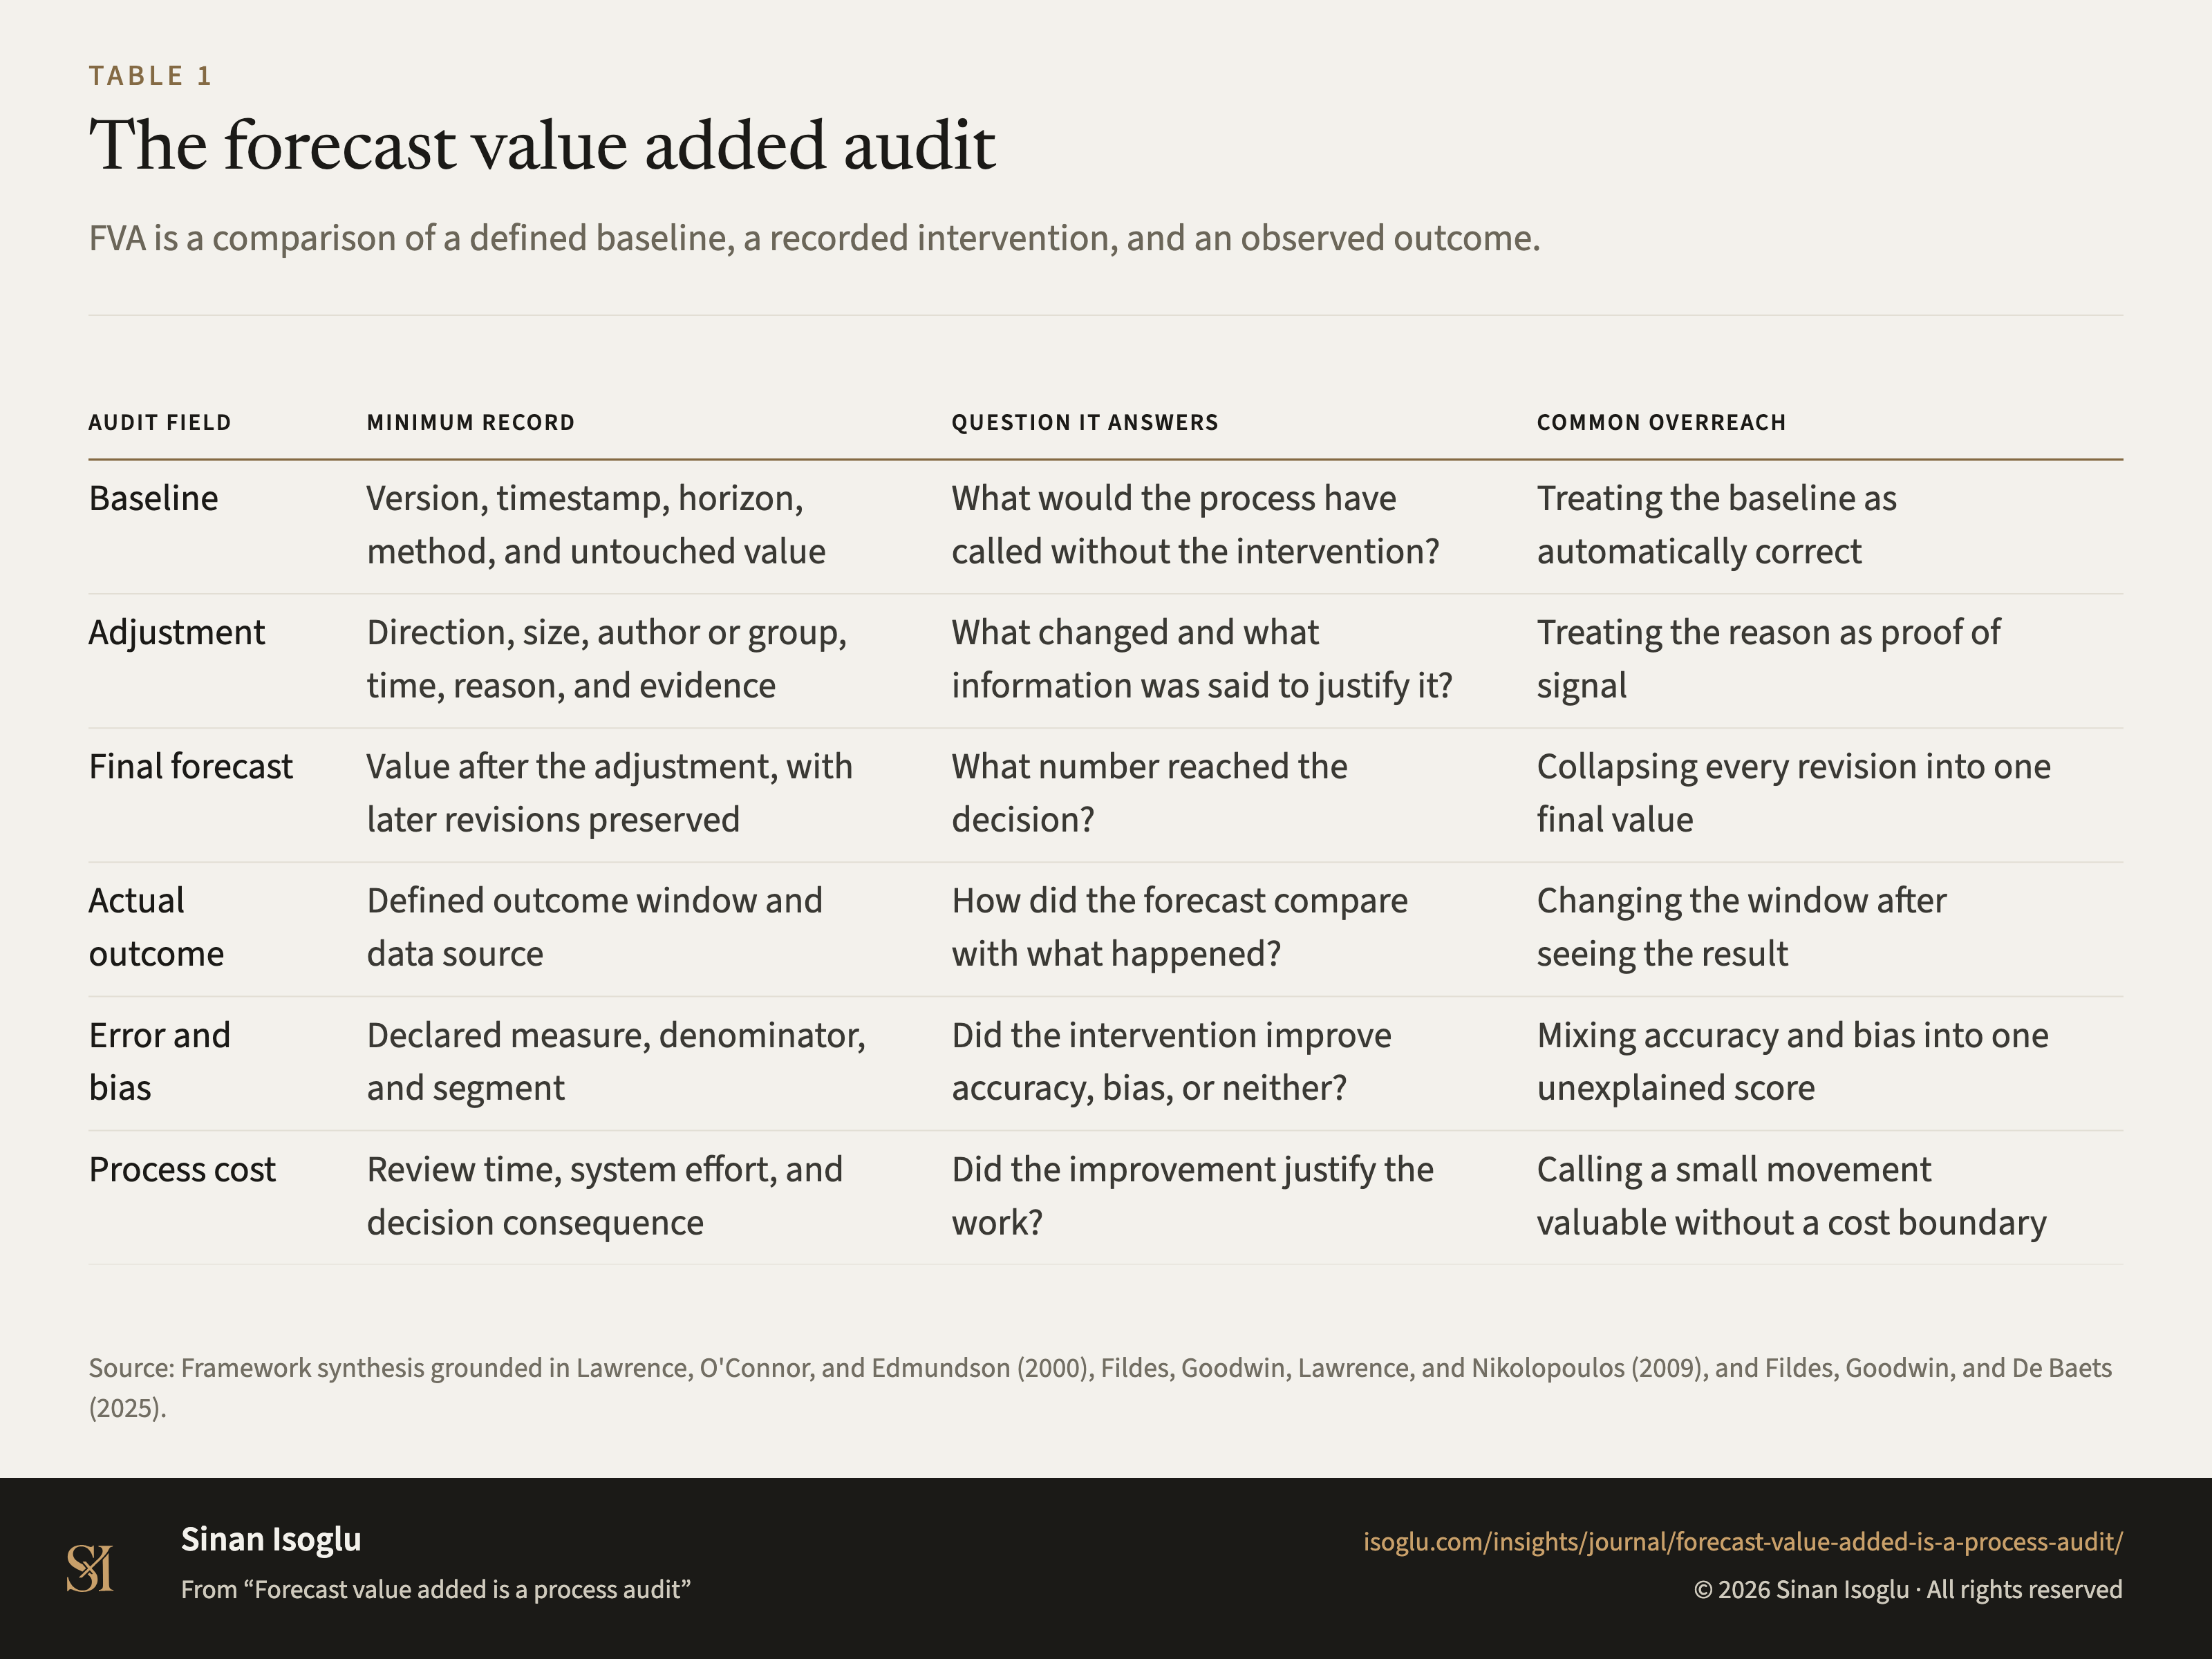
The forecast value added audit
FVA is a comparison of a defined baseline, a recorded intervention, and an observed outcome.
Table 1The forecast value added audit
| Audit field | Minimum record | Question it answers | Common overreach |
|---|---|---|---|
| Baseline | Version, timestamp, horizon, method, and untouched value | What would the process have called without the intervention? | Treating the baseline as automatically correct |
| Adjustment | Direction, size, author or group, time, reason, and evidence | What changed and what information was said to justify it? | Treating the reason as proof of signal |
| Final forecast | Value after the adjustment, with later revisions preserved | What number reached the decision? | Collapsing every revision into one final value |
| Actual outcome | Defined outcome window and data source | How did the forecast compare with what happened? | Changing the window after seeing the result |
| Error and bias | Declared measure, denominator, and segment | Did the intervention improve accuracy, bias, or neither? | Mixing accuracy and bias into one unexplained score |
| Process cost | Review time, system effort, and decision consequence | Did the improvement justify the work? | Calling a small movement valuable without a cost boundary |
Swipe or scroll horizontally if the table is wider than your screen.
Source: Framework synthesis grounded in Lawrence, O'Connor, and Edmundson (2000), Fildes, Goodwin, Lawrence, and Nikolopoulos (2009), and Fildes, Goodwin, and De Baets (2025).
Source and evidence
Each line names a claim related to this exhibit, its source, and how it was checked.
- B FVA27-C1 Forecast value added compares a baseline with an adjusted or final forecast and an actual outcome under a stated error measureAuthor translation grounded in Fildes, Goodwin and De Baets (2025)
- B FVA27-C2 The Lawrence et al. field study compares company forecasts with a naive comparator defined as the most recent actualAuthor translation grounded in Lawrence, O'Connor and Edmundson (2000)
- B FVA27-C3 The 2025 study combines 147,131 forecasts and actuals from 10 organizations and 22 business unitsAuthor translation grounded in Fildes, Goodwin and De Baets (2025)
- B FVA27-C4 The reported overall medians show 51.5% of SKUs with improved FVA and 55.6% with improved biasAuthor translation grounded in Fildes, Goodwin and De Baets (2025)
- B FVA27-C5 Accuracy and bias can move in opposite directions and therefore remain separate audit dimensionsAuthor translation grounded in Fildes, Goodwin and De Baets (2025)
- B FVA27-C6 Downward adjustments generally performed better in the 2025 datasets, while upward adjustments had a mixed record and often reduced accuracyAuthor translation grounded in Fildes, Goodwin and De Baets (2025)
- B FVA27-C7 The 2025 results vary across datasets and do not validate a B2B pipeline override protocolAuthor translation grounded in Fildes, Goodwin and De Baets (2025)
- B FVA27-C8 A useful audit preserves the baseline, intervention, final forecast, actual, metric, and process costAuthor framework
Grades: A, verified against the printed page of the primary source · B, primary source, text layer only · C, authoritative secondary · D, reported.
From the essay
Revenue operations & AI
Forecast value added is a process audit
Forecast value added is not a verdict on judgment. Compare the baseline, adjustment, and actual outcome, then test whether the process earned its effort.
Read the essayThis exhibit belongs to an essay: the numbers live here, the argument lives there.
Cite or embed
Contact
Bring the question you're working on.
Research, a guest lecture, or a commercial question.