Figure 2From “What is time series forecasting?”
A forecast comparison record
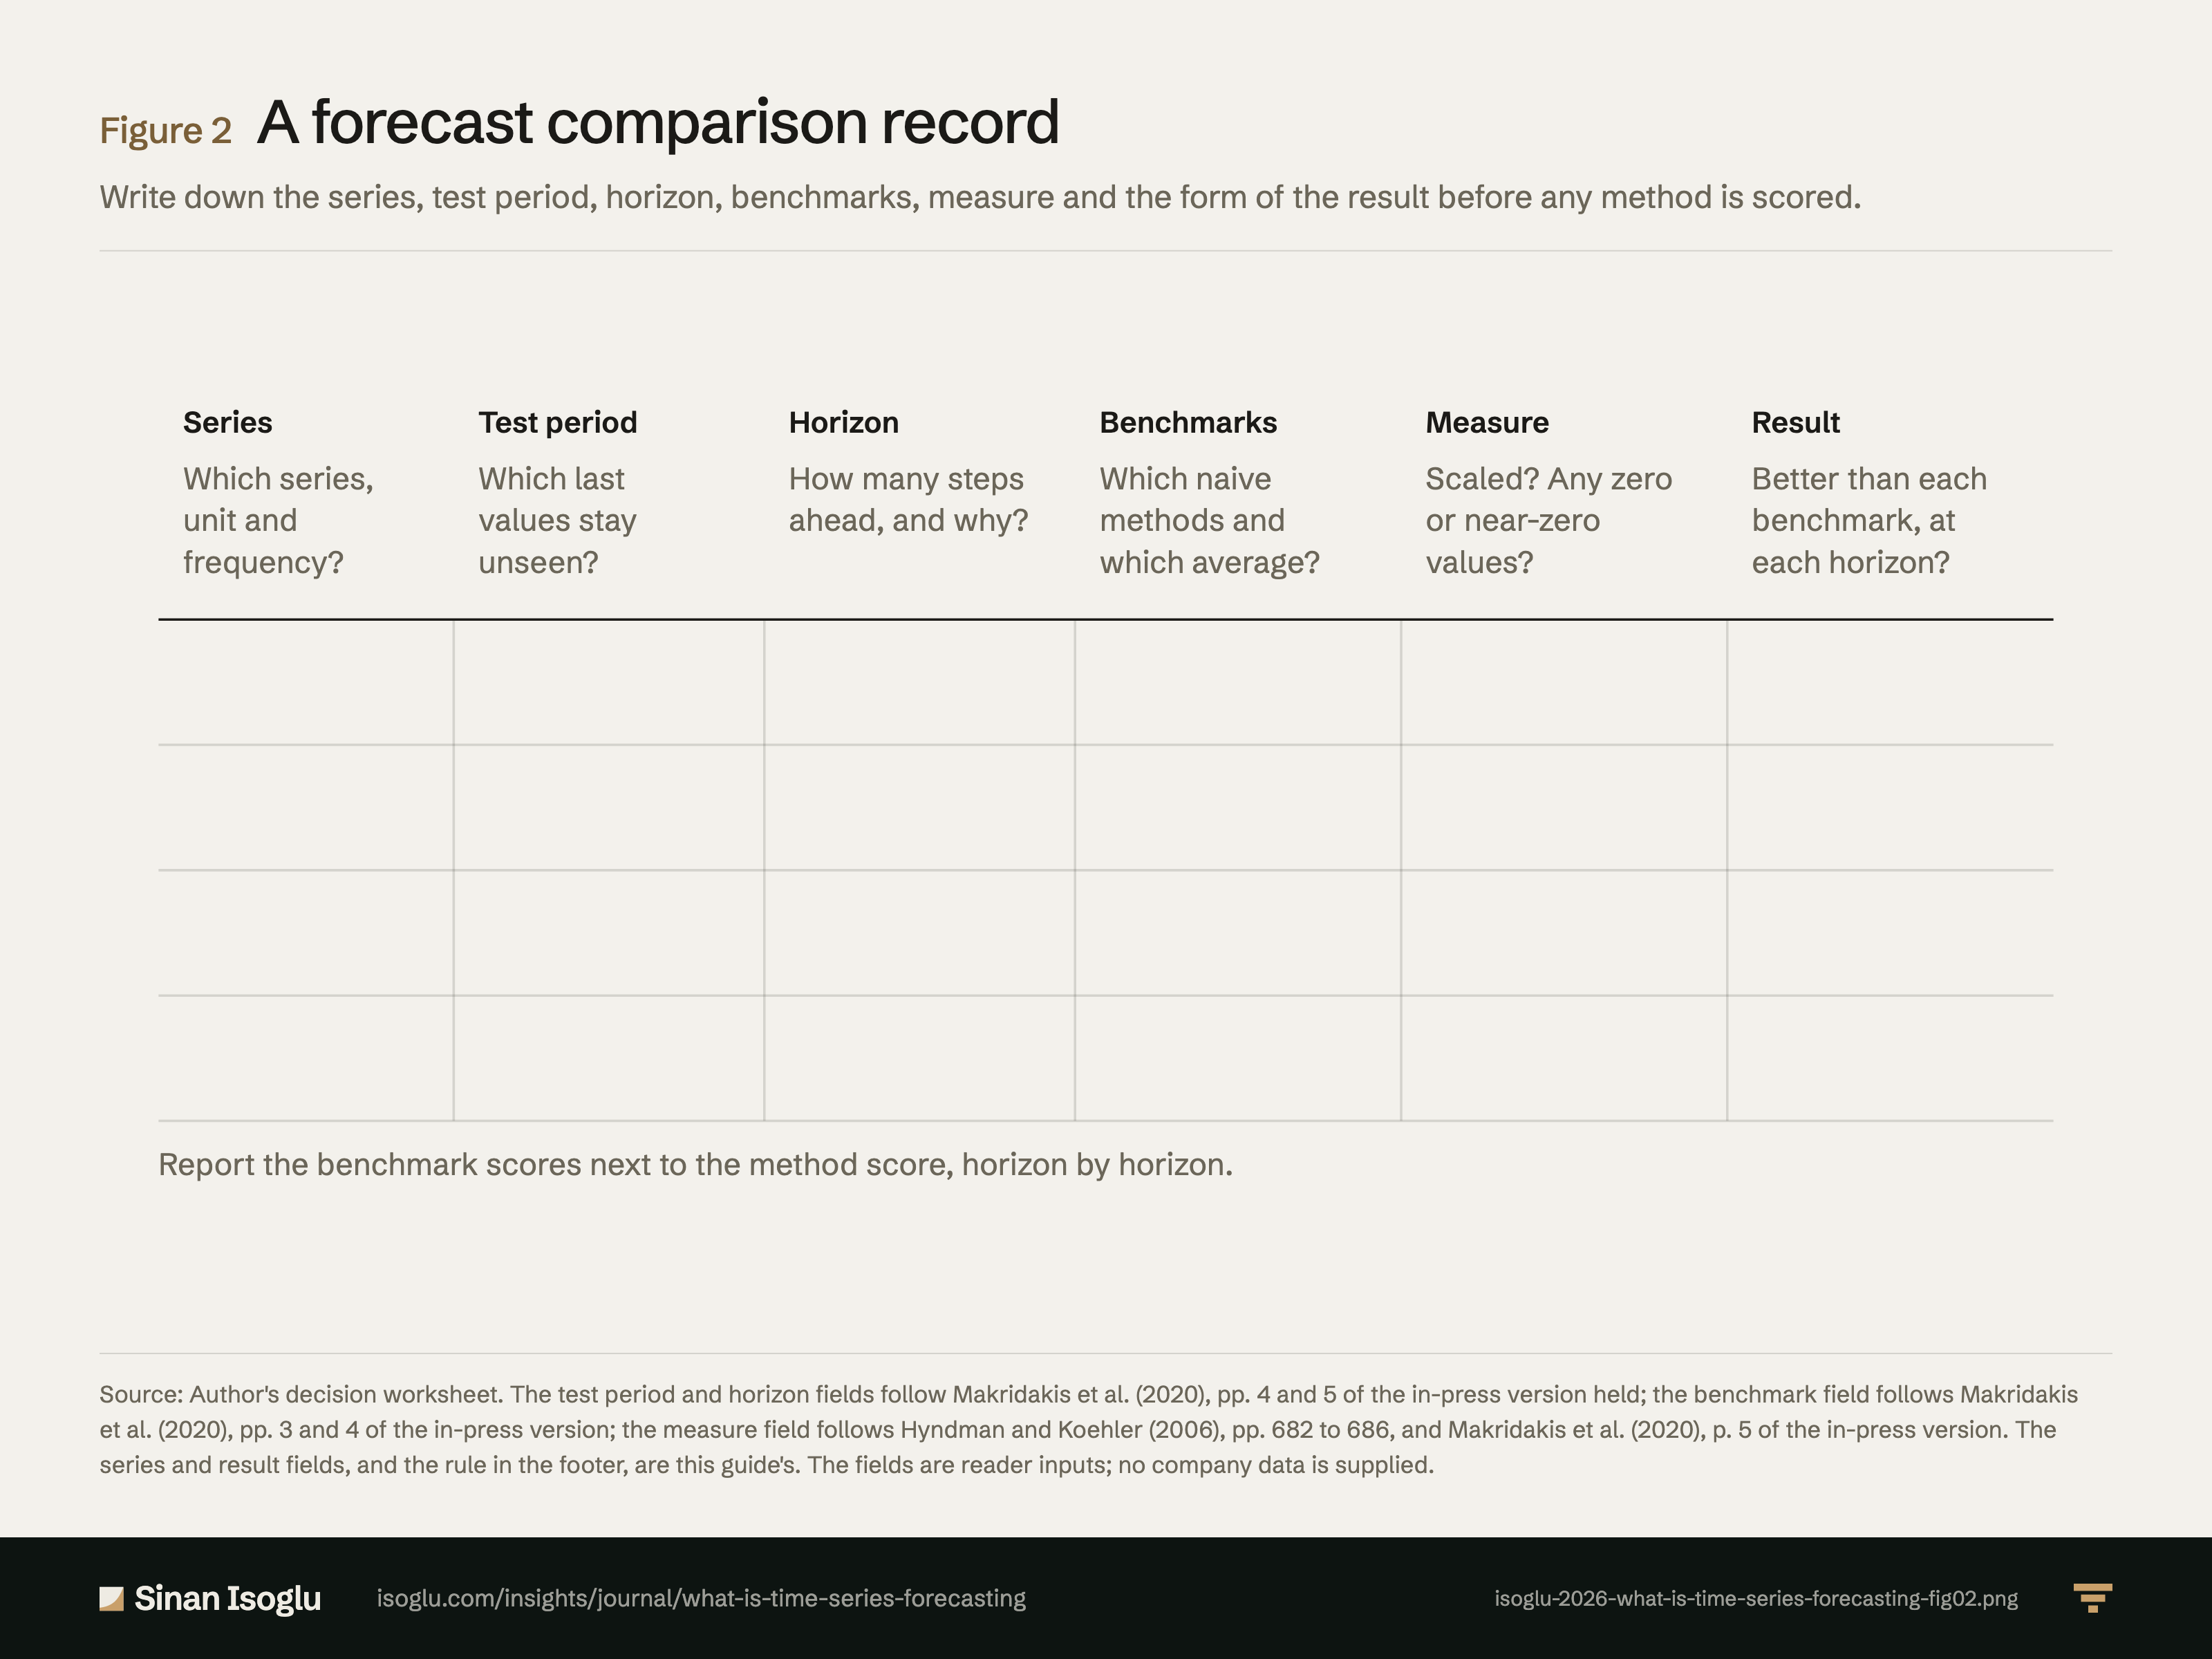
Write down the series, test period, horizon, benchmarks, measure and the form of the result before any method is scored.
Figure 2A forecast comparison record
Source: Author's decision worksheet. The test period and horizon fields follow Makridakis et al. (2020), pp. 4 and 5 of the in-press version held; the benchmark field follows Makridakis et al. (2020), pp. 3 and 4 of the in-press version; the measure field follows Hyndman and Koehler (2006), pp. 682 to 686, and Makridakis et al. (2020), p. 5 of the in-press version. The series and result fields, and the rule in the footer, are this guide's. The fields are reader inputs; no company data is supplied.
Source and evidence
Each line names a claim related to this exhibit, its source, and how it was checked.
- B TSF-OWN-C3 A forecast comparison is written down as one record: the series with its unit and frequency, the test period, the horizon and its reason, the benchmarks (naive, seasonal naive and a simple average), the measure and its scaling, and how the result will be reported against each benchmark at each horizon, the form fixed before scoring and the result filled in after (G5 F6); illustrated with a hypothetical manufacturer's 40 spare-part lines with twelve months held back and one forecast origin per line, as in M4 (G5 N4), horizons of three and twelve months, the seasonal naive method, Naïve 2 and a plain exponential smoothing average as benchmarks, errors scaled per line in the MASE way, and a note that M4 left intermittent series out and that neither source tests methods built for them; untested.Author worksheet grounded in MSA20-C1, MSA20-C3, MSA20-C4, HK06-C2, HK06-C3 and HK06-C6
Grades: A, verified against the printed page of the primary source · B, primary source, text layer only · C, authoritative secondary · D, reported.
From the essay
Revenue operations & AI
What is time series forecasting?
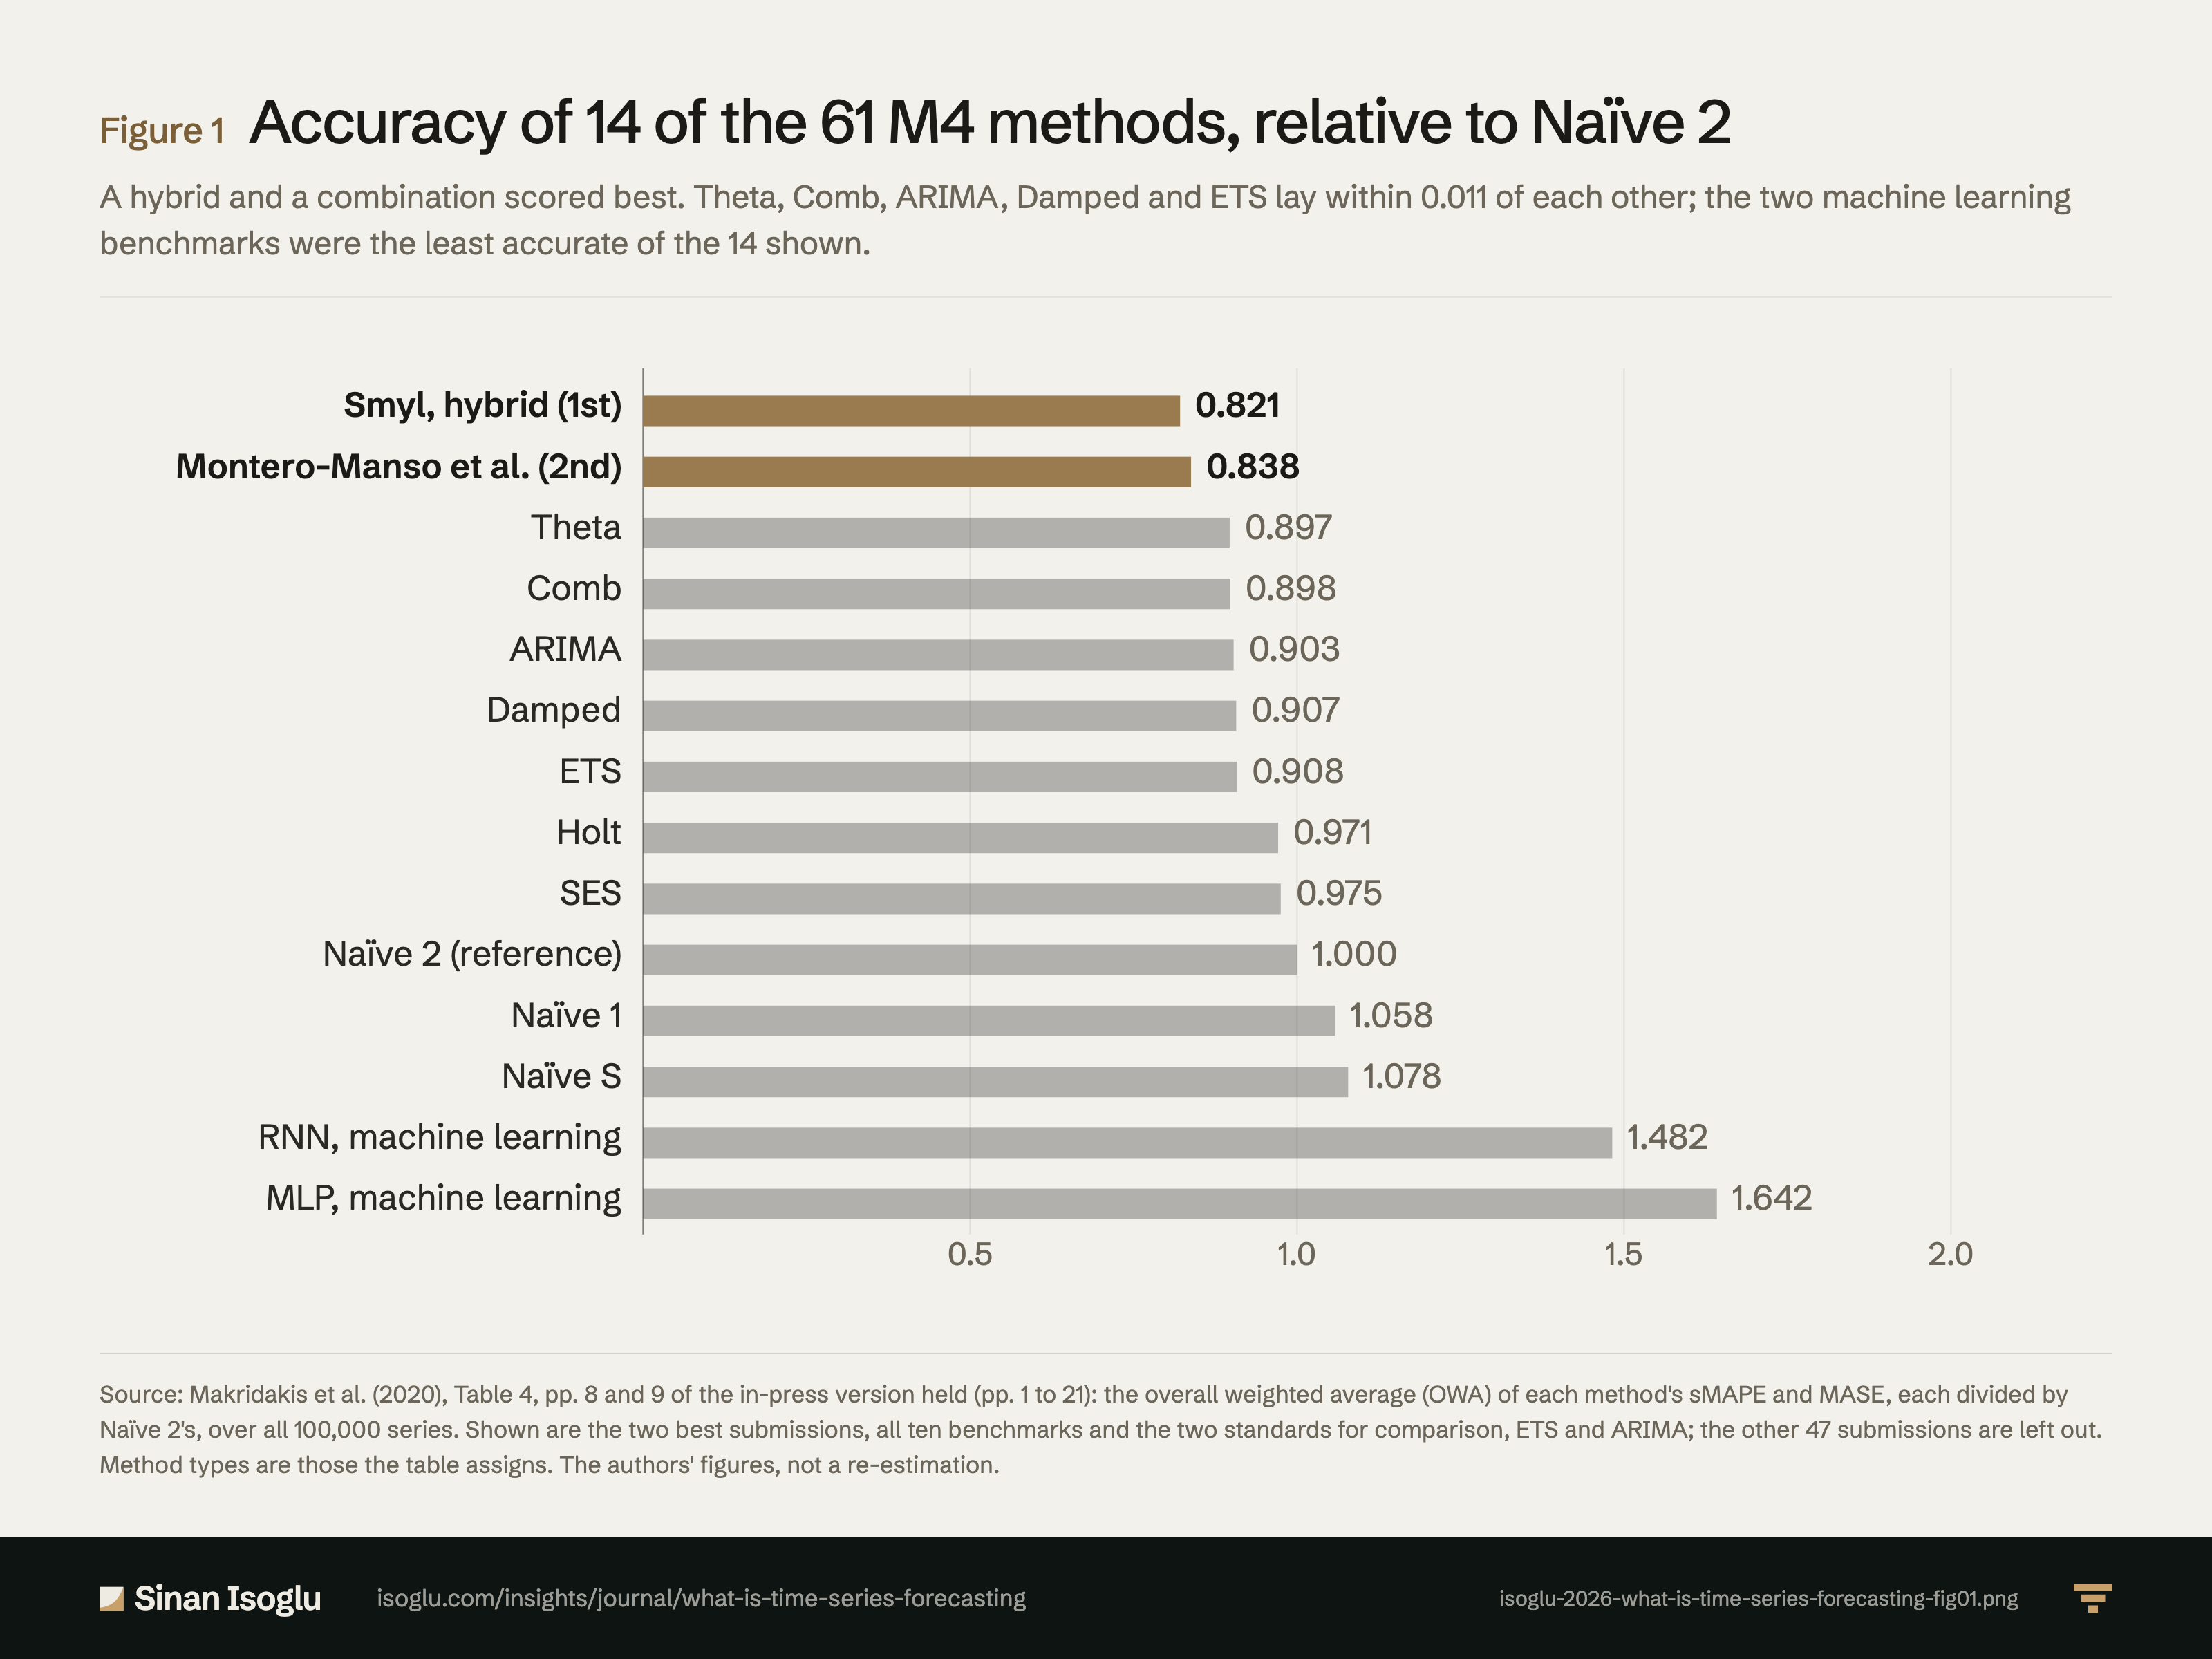
A time series forecast extends a series from its own past. In the M4 competition, a hybrid and combinations led; pure methods trailed.
Read the essayThis exhibit belongs to an essay: the numbers live here, the argument lives there.
Cite or embed
Contact
Bring the question you're working on.
Research, a guest lecture, or a commercial question.