Table 1From “Conjoint analysis estimates preference, not demand”
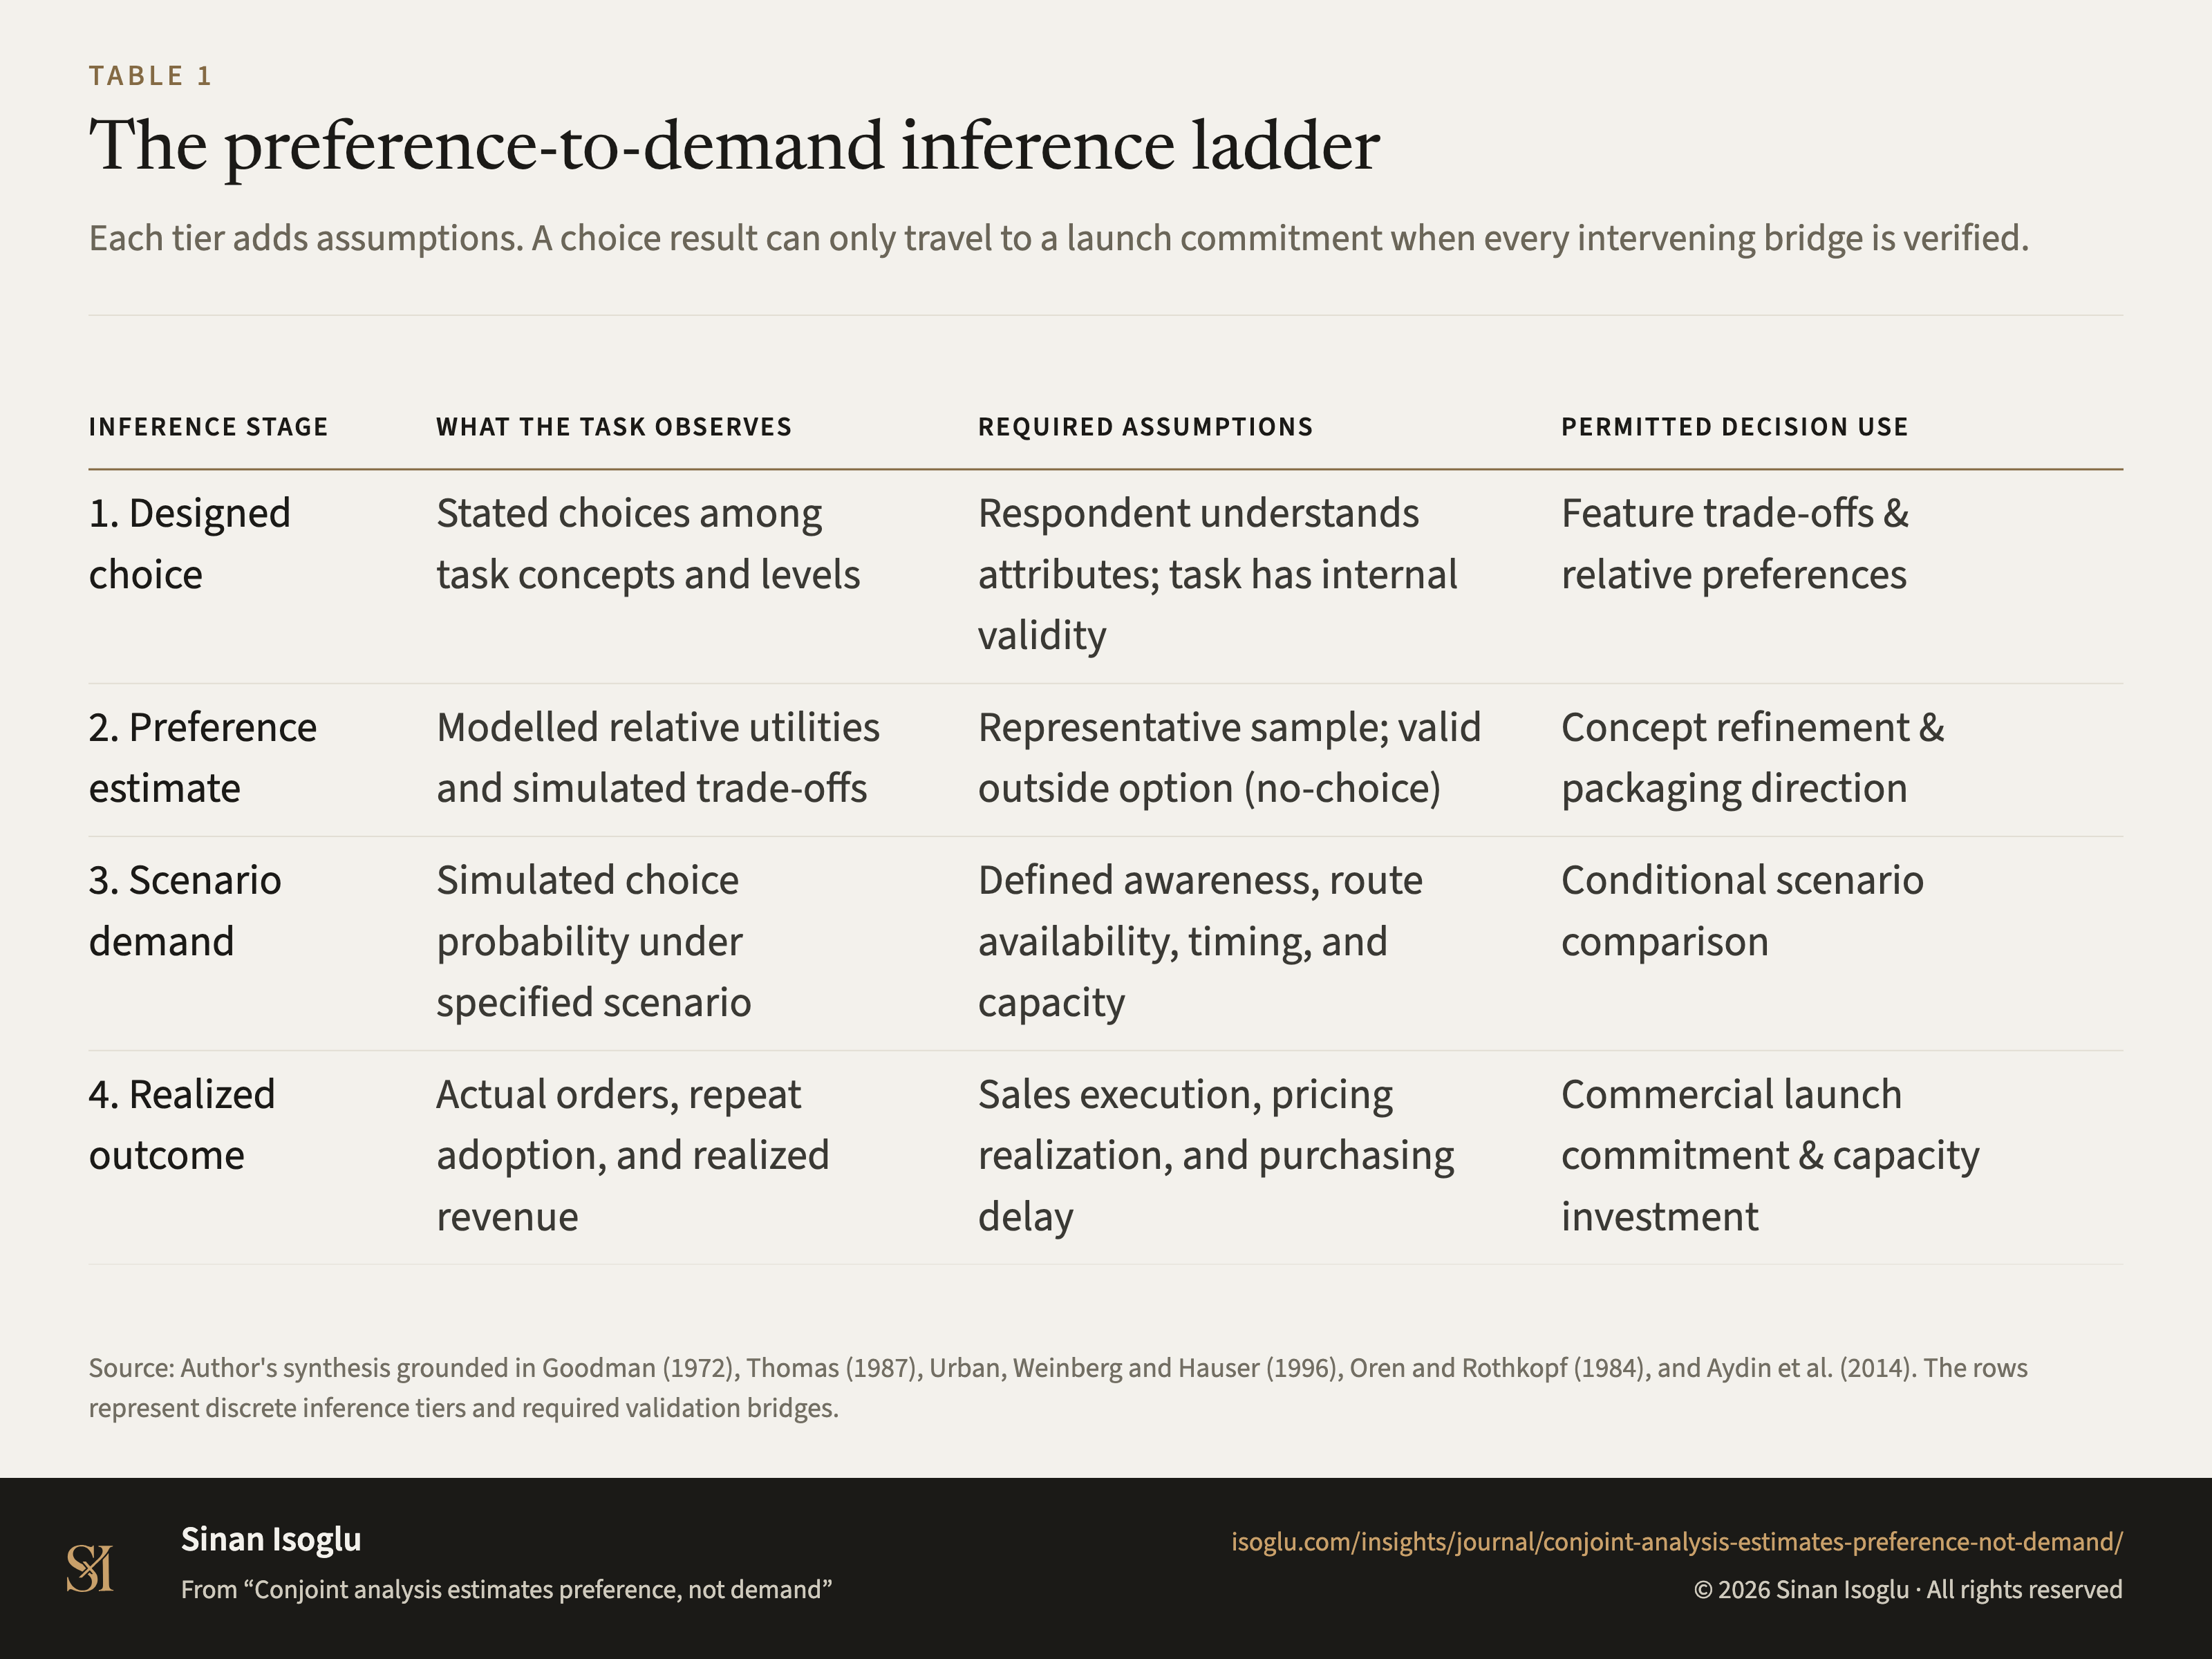
The preference-to-demand inference ladder
Each tier adds assumptions. A choice result can only travel to a launch commitment when every intervening bridge is verified.
Table 1The preference-to-demand inference ladder
| Inference stage | What the task observes | Required assumptions | Permitted decision use |
|---|---|---|---|
| 1. Designed choice | Stated choices among task concepts and levels | Respondent understands attributes; task has internal validity | Feature trade-offs & relative preferences |
| 2. Preference estimate | Modelled relative utilities and simulated trade-offs | Representative sample; valid outside option (no-choice) | Concept refinement & packaging direction |
| 3. Scenario demand | Simulated choice probability under specified scenario | Defined awareness, route availability, timing, and capacity | Conditional scenario comparison |
| 4. Realized outcome | Actual orders, repeat adoption, and realized revenue | Sales execution, pricing realization, and purchasing delay | Commercial launch commitment & capacity investment |
Swipe or scroll horizontally if the table is wider than your screen.
Source: Author's synthesis grounded in Goodman (1972), Thomas (1987), Urban, Weinberg and Hauser (1996), Oren and Rothkopf (1984), and Aydin et al. (2014). The rows represent discrete inference tiers and required validation bridges.
Source and evidence
Each line names a claim related to this exhibit, its source, and how it was checked.
- B MSB27-C1 Goodman's own distinction: market potential is a measure "of an environmental state at a point in time (present or future)", whereas "sales forecasts are measures of expectation which are conditional upon inputs of the various marketing decision variables", and "it is usually necessary to rely on proxy data for most of the things a marketer would like to measure"Goodman. (1972)
- B NPM27-C1 The three steps are Thomas's own: "defining a concept of market potential for the new product", independent operationalisations, and reconciliation. The reason he gives for the plurality: "Multiple methods help to ensure that what is measured is due to the phenomenon under study and not the method"Thomas. (1987)
- B NPM27-C2 The decision the forecast serves is three-way in the paper's own words: whether "the really-new product would be a viable business ven"ture, whether to plan improvements, or whether "the firm should stop development", and it is reached because "the authors describe how one firm combines managerial judgment and state"-of-the-art market measurementUrban, Weinberg & Hauser. (1996)
- B NPM27-C3 One case, and a named one: "the authors describe how one firm combines managerial judgment and state"-of-the-art market measurement to decide whether "the really-new product would be a viable business ven"tureUrban, Weinberg & Hauser. (1996)
- B NPM27-C4 The path is enumerated in the paper: "This model accounts for differ""ences in customer awareness of different products, for differences in product announcement dates, for differences in product availability, for differences in marketing efforts, for customer inertia and for customer purchasing delays", applied in "a system developed for market analysis of high speed nonimpact computer printers"Oren & Rothkopf. (1984)
- B NPM27-C5 The uncertainty the fuzzy model preserves is in the survey data itself: "a high degree of fuzziness always exists in the data obtained from conjoint surveys", and "ignorance of the fuzziness would lead to the over-estimation of market demands"Aydin, Kwong, Ji & Law. (2014)
Grades: A, verified against the printed page of the primary source · B, primary source, text layer only · C, authoritative secondary · D, reported.
From the essay
From the research bench
Conjoint analysis estimates preference, not demand
A conjoint study can reveal trade-offs in a designed choice, but demand also depends on awareness, availability, timing, capacity, and competition.
Read the essayThis exhibit belongs to an essay: the numbers live here, the argument lives there.
Cite or embed
Related exhibits
Contact
Bring the question you're working on.
Research, a guest lecture, or a commercial question.