Table 1From “A customer P&L needs a cost boundary”
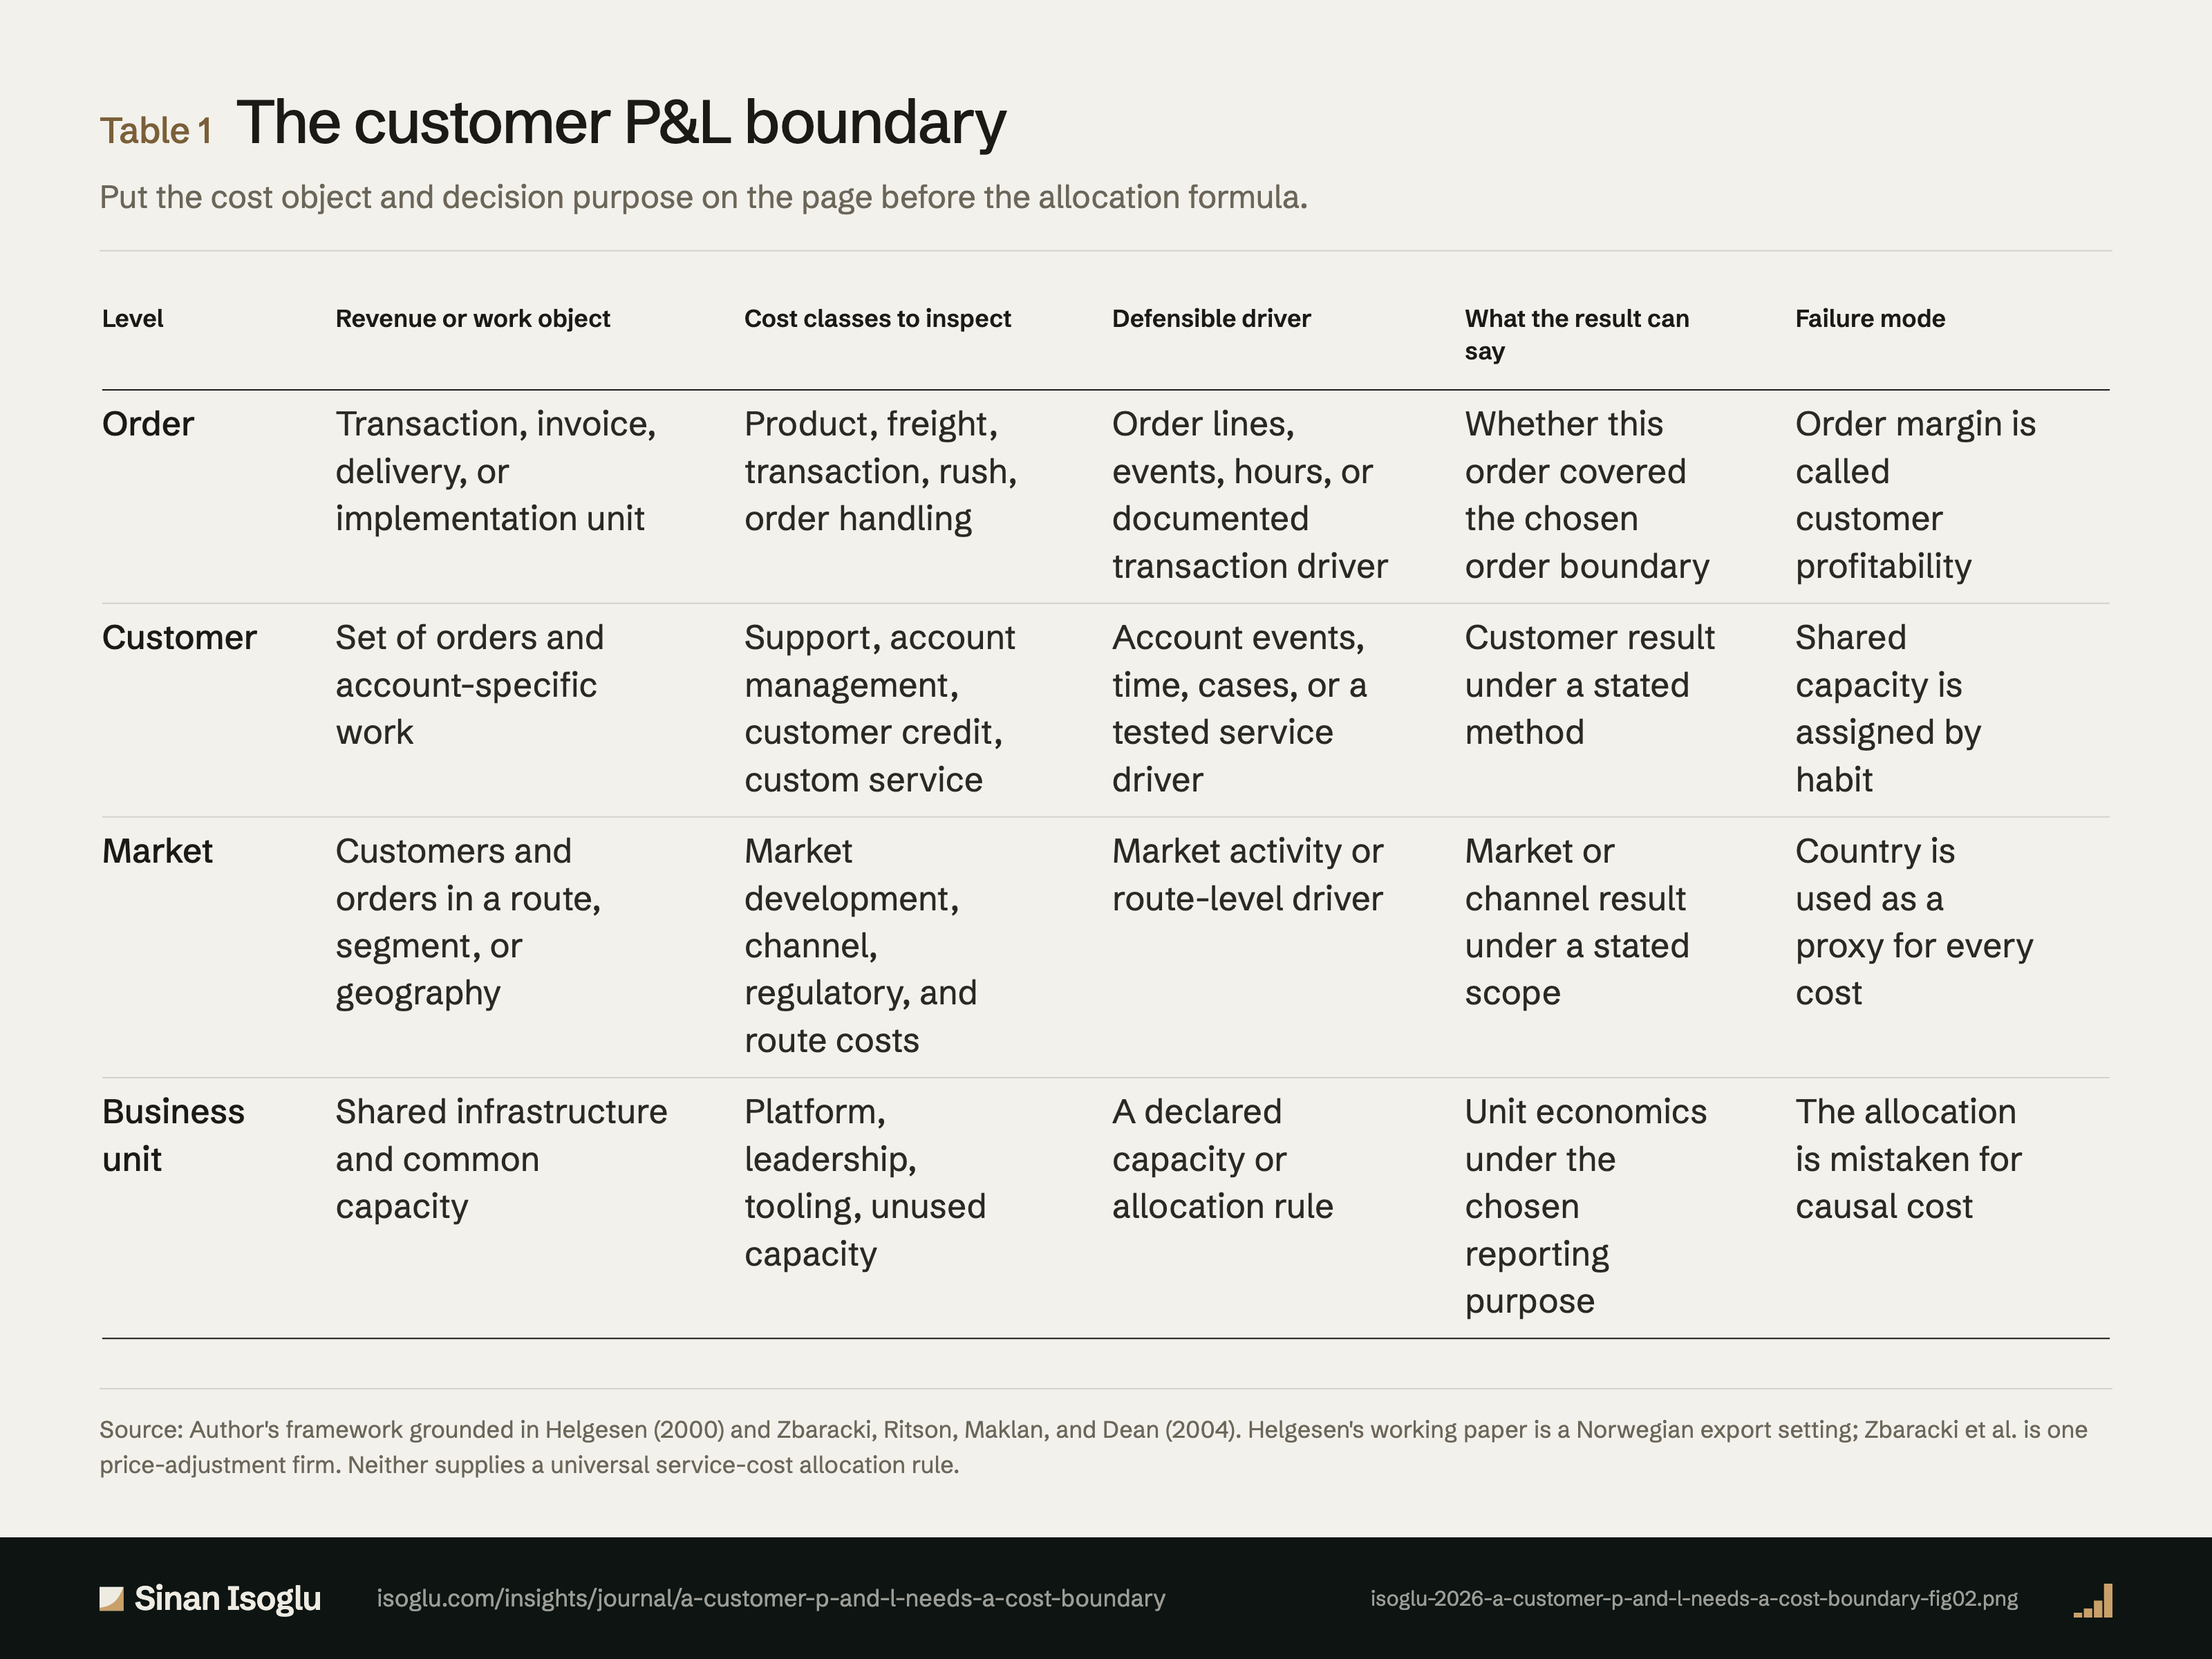
The customer P&L boundary
Put the cost object and decision purpose on the page before the allocation formula.
Table 1The customer P&L boundary
| Level | Revenue or work object | Cost classes to inspect | Defensible driver | What the result can say | Failure mode |
|---|---|---|---|---|---|
| Order | Transaction, invoice, delivery, or implementation unit | Product, freight, transaction, rush, order handling | Order lines, events, hours, or documented transaction driver | Whether this order covered the chosen order boundary | Order margin is called customer profitability |
| Customer | Set of orders and account-specific work | Support, account management, customer credit, custom service | Account events, time, cases, or a tested service driver | Customer result under a stated method | Shared capacity is assigned by habit |
| Market | Customers and orders in a route, segment, or geography | Market development, channel, regulatory, and route costs | Market activity or route-level driver | Market or channel result under a stated scope | Country is used as a proxy for every cost |
| Business unit | Shared infrastructure and common capacity | Platform, leadership, tooling, unused capacity | A declared capacity or allocation rule | Unit economics under the chosen reporting purpose | The allocation is mistaken for causal cost |
Swipe or scroll horizontally if the table is wider than your screen.
Source: Author's framework grounded in Helgesen (2000) and Zbaracki, Ritson, Maklan, and Dean (2004). Helgesen's working paper is a Norwegian export setting; Zbaracki et al. is one price-adjustment firm. Neither supplies a universal service-cost allocation rule.
Source and evidence
Each line names a claim related to this exhibit, its source, and how it was checked.
- A HLG00-C1 The setting is one industry in one country: "Norwegian exporters of klipfish and frozen fish are chosen as a context"Helgesen. (2000)
- A HLG00-C2 The sample, verbatim: "the sample, consisting of 564 orders related to 176 customer and 36 geographical markets"Helgesen. (2000)
- A HLG00-C3 The rule is stated as a rule: "Costs are assigned to the level where they are incurred (orders, customers, markets, etc.). All the revenues are related to the order level", and "Then revenues and costs from orders are transferred to the customer level"Helgesen. (2000)
- A HLG00-C4 The paper says the method changes the answer: descriptive customer profitability can be built with "full costing (the absorp""tion method), (2) variable costing (the contribution margin method) or (3) activity based costing", and "These methods will of course tend to result in different designs of the specified accounts"Helgesen. (2000)
- A ZRLDB04-C1 "the managerial costs are more than 6 times and customer costs are more than 20 times the menu costs"zbaracki-etal-2004-price-adjustment-costs
- A ZRLDB04-C2 "in total the price adjustment costs comprise 1 22 of the company s revenue and 20 03 of the company s net margin": one firm, one periodzbaracki-etal-2004-price-adjustment-costs
- B B08-C1 A customer P&L boundary should follow the cost object and where the cost is incurred, not the reporting convenience of a revenue dashboardAuthor framework grounded in Helgesen (2000)
- B B08-C2 Service costs should be classified by order, customer, market, and business-unit level before a team decides whether to allocate them furtherAuthor framework grounded in Helgesen (2000) and Zbaracki et al. (2004)
Grades: A, verified against the printed page of the primary source · B, primary source, text layer only · C, authoritative secondary · D, reported.
From the essay
Growth that compounds
A customer P&L needs a cost boundary
Revenue is not customer profitability. Trace order, account, market, and shared-capacity costs to the object and decision they can support.
Read the essayThis exhibit belongs to an essay: the numbers live here, the argument lives there.
Cite or embed
Related exhibits
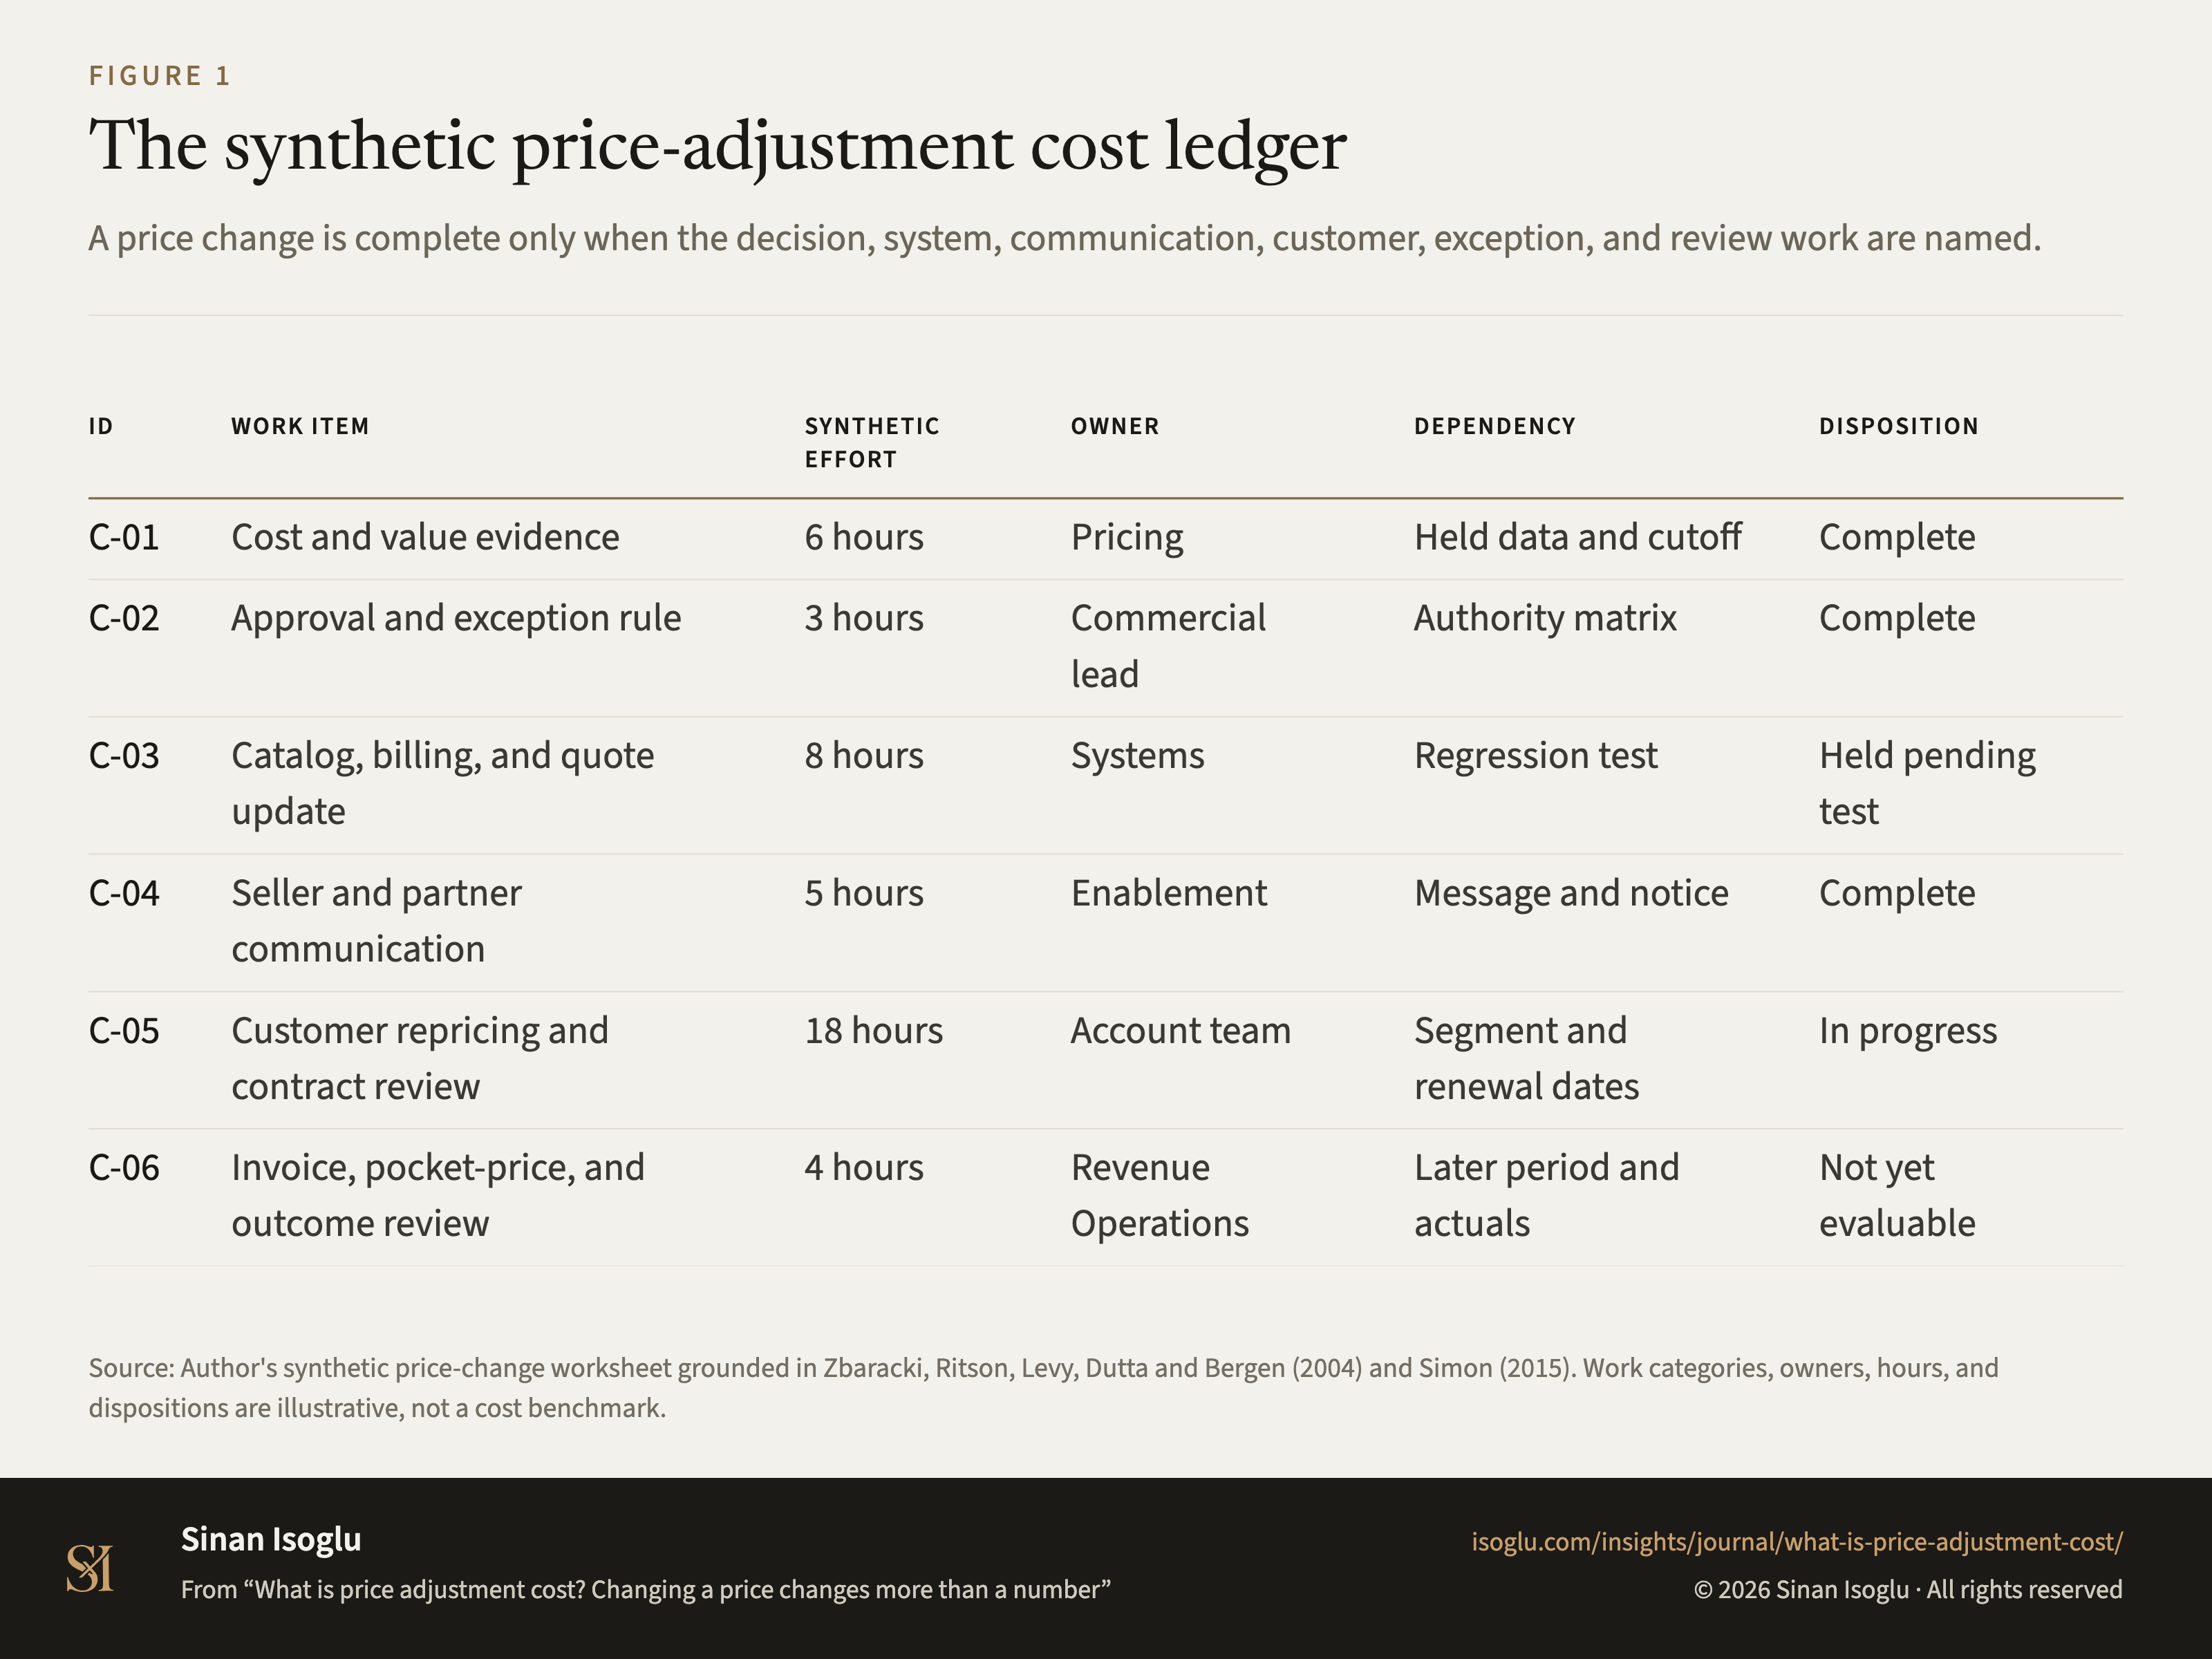
Figure 1Figure
The synthetic price-adjustment cost ledger
What is price adjustment cost? Changing a price changes more than a number
Table 1Table
Customer profitability dashboard and data requirements
A customer P&L needs a cost boundary
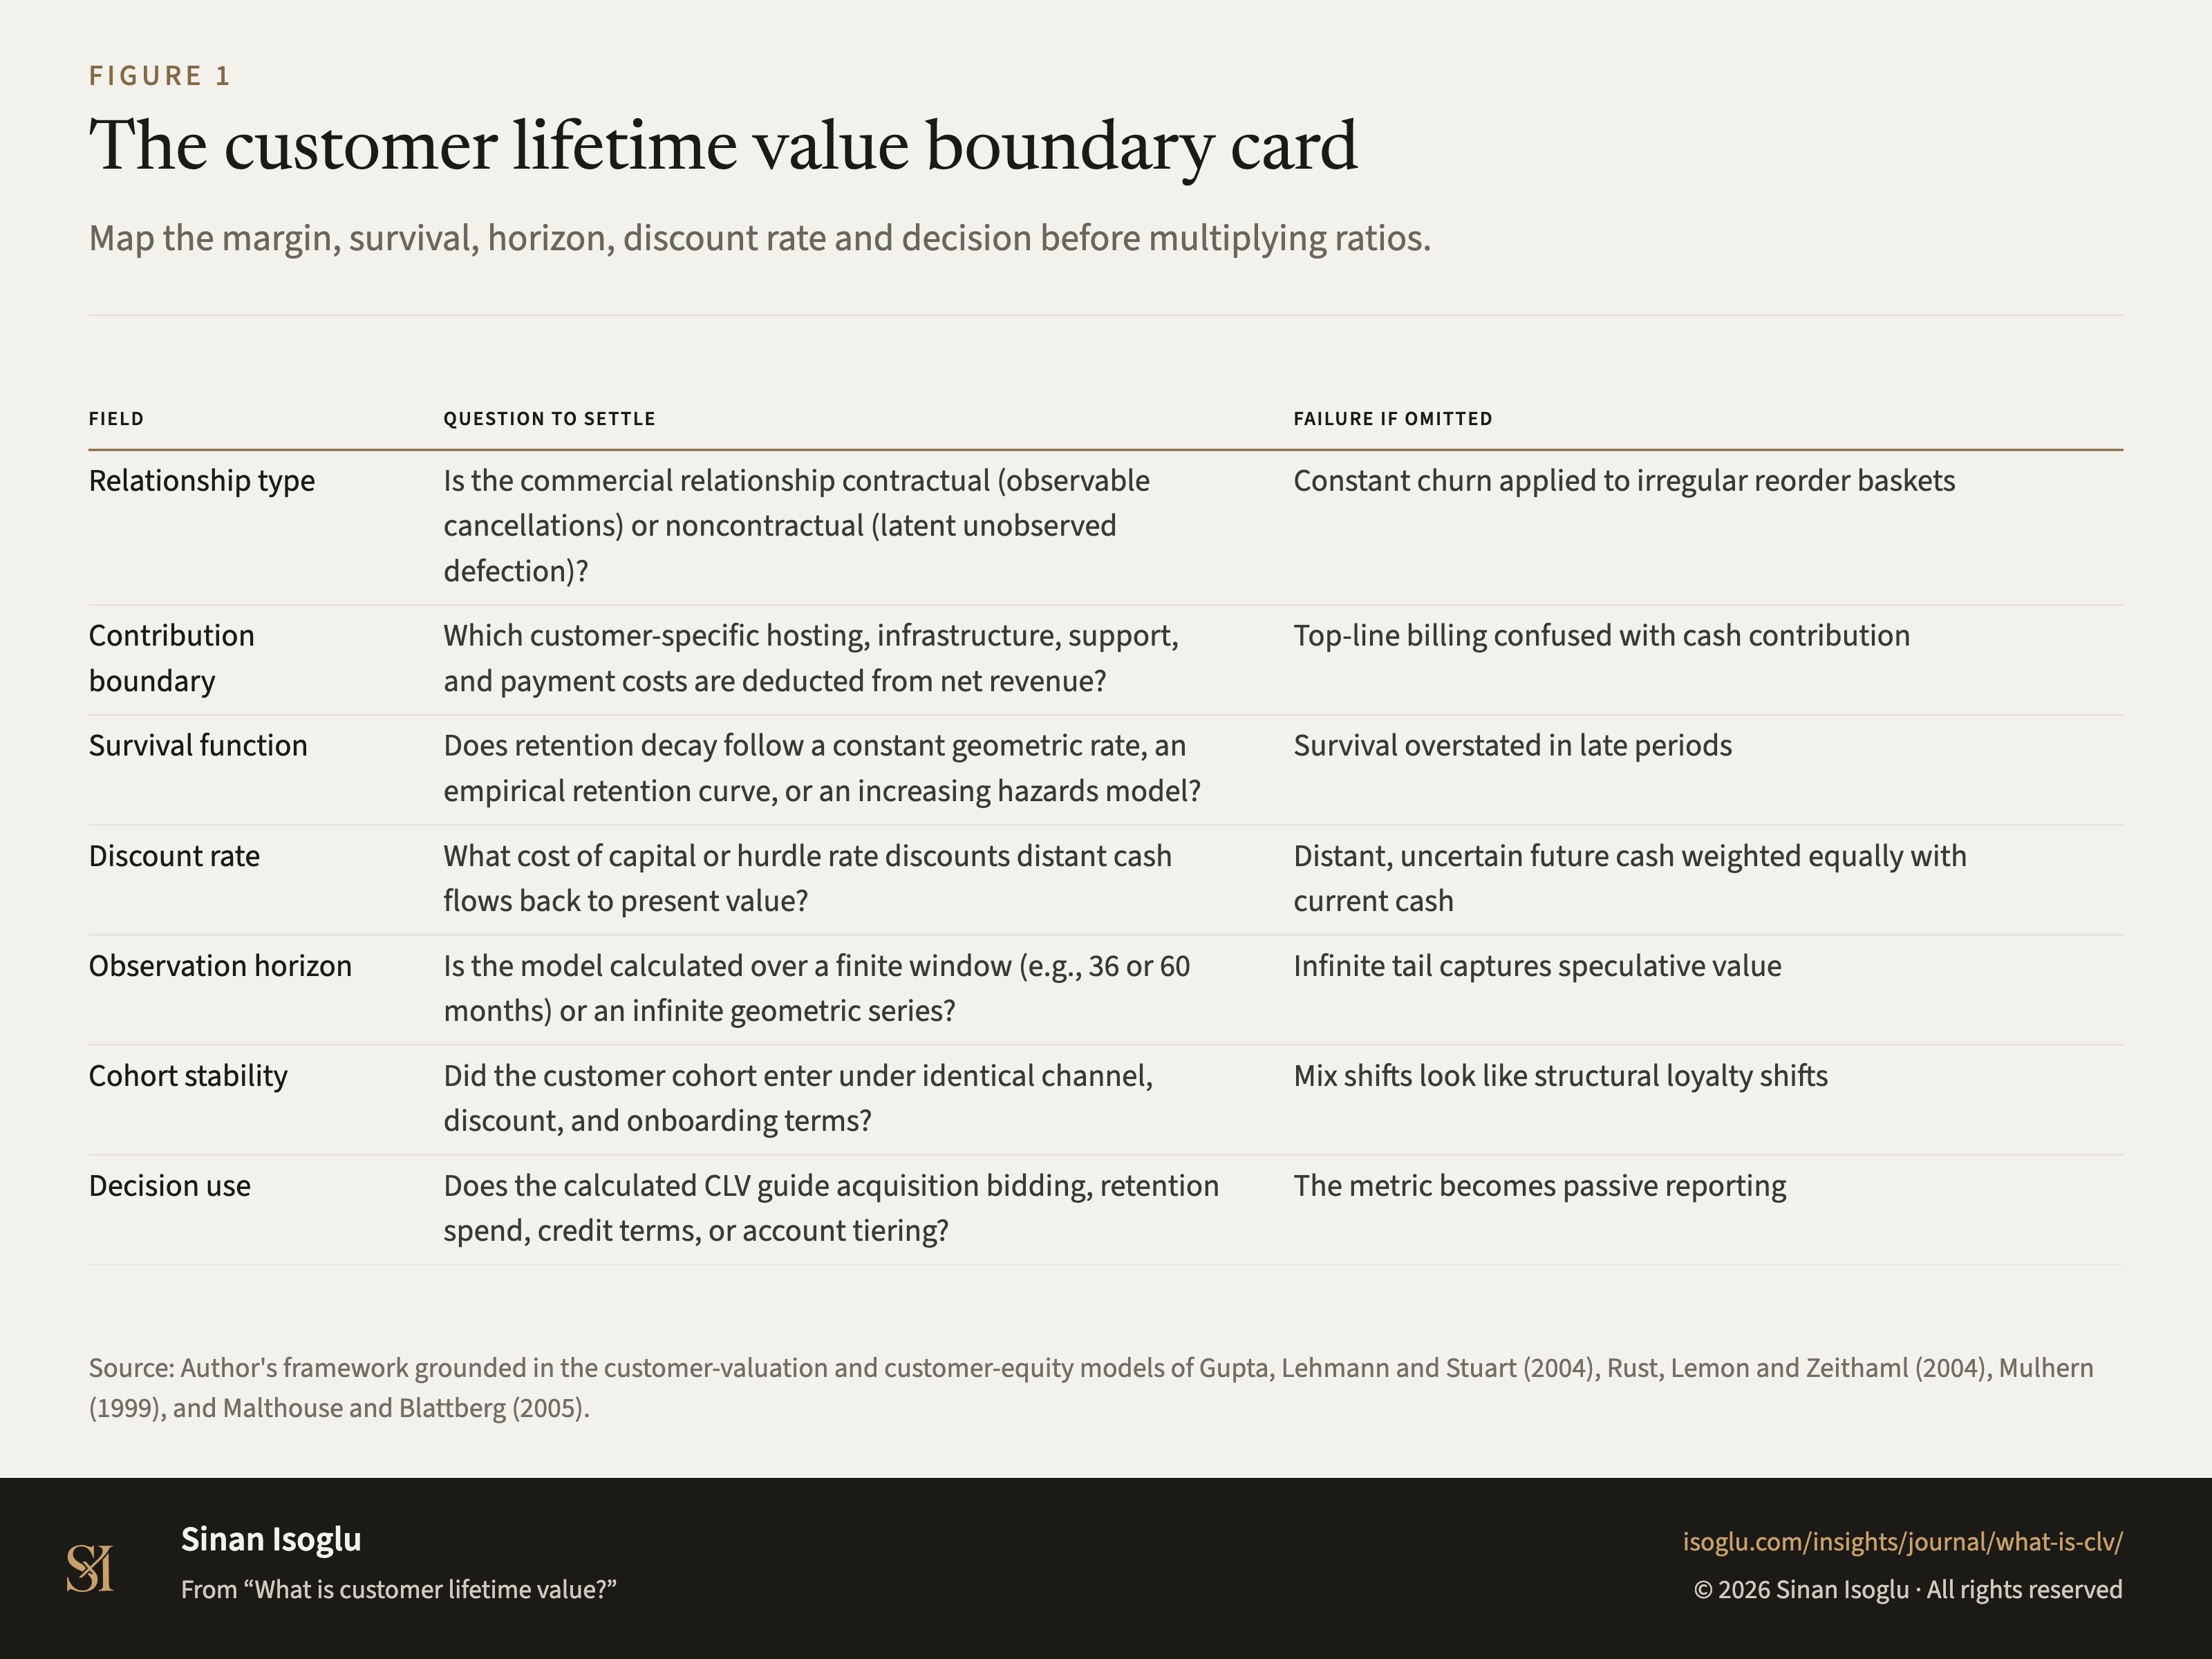
Figure 1Figure
The customer lifetime value boundary card
What is customer lifetime value?
Contact
Bring the question you're working on.
Research, a guest lecture, or a commercial question.