Figure 1From “Why growth compounds, and activity doesn't.”
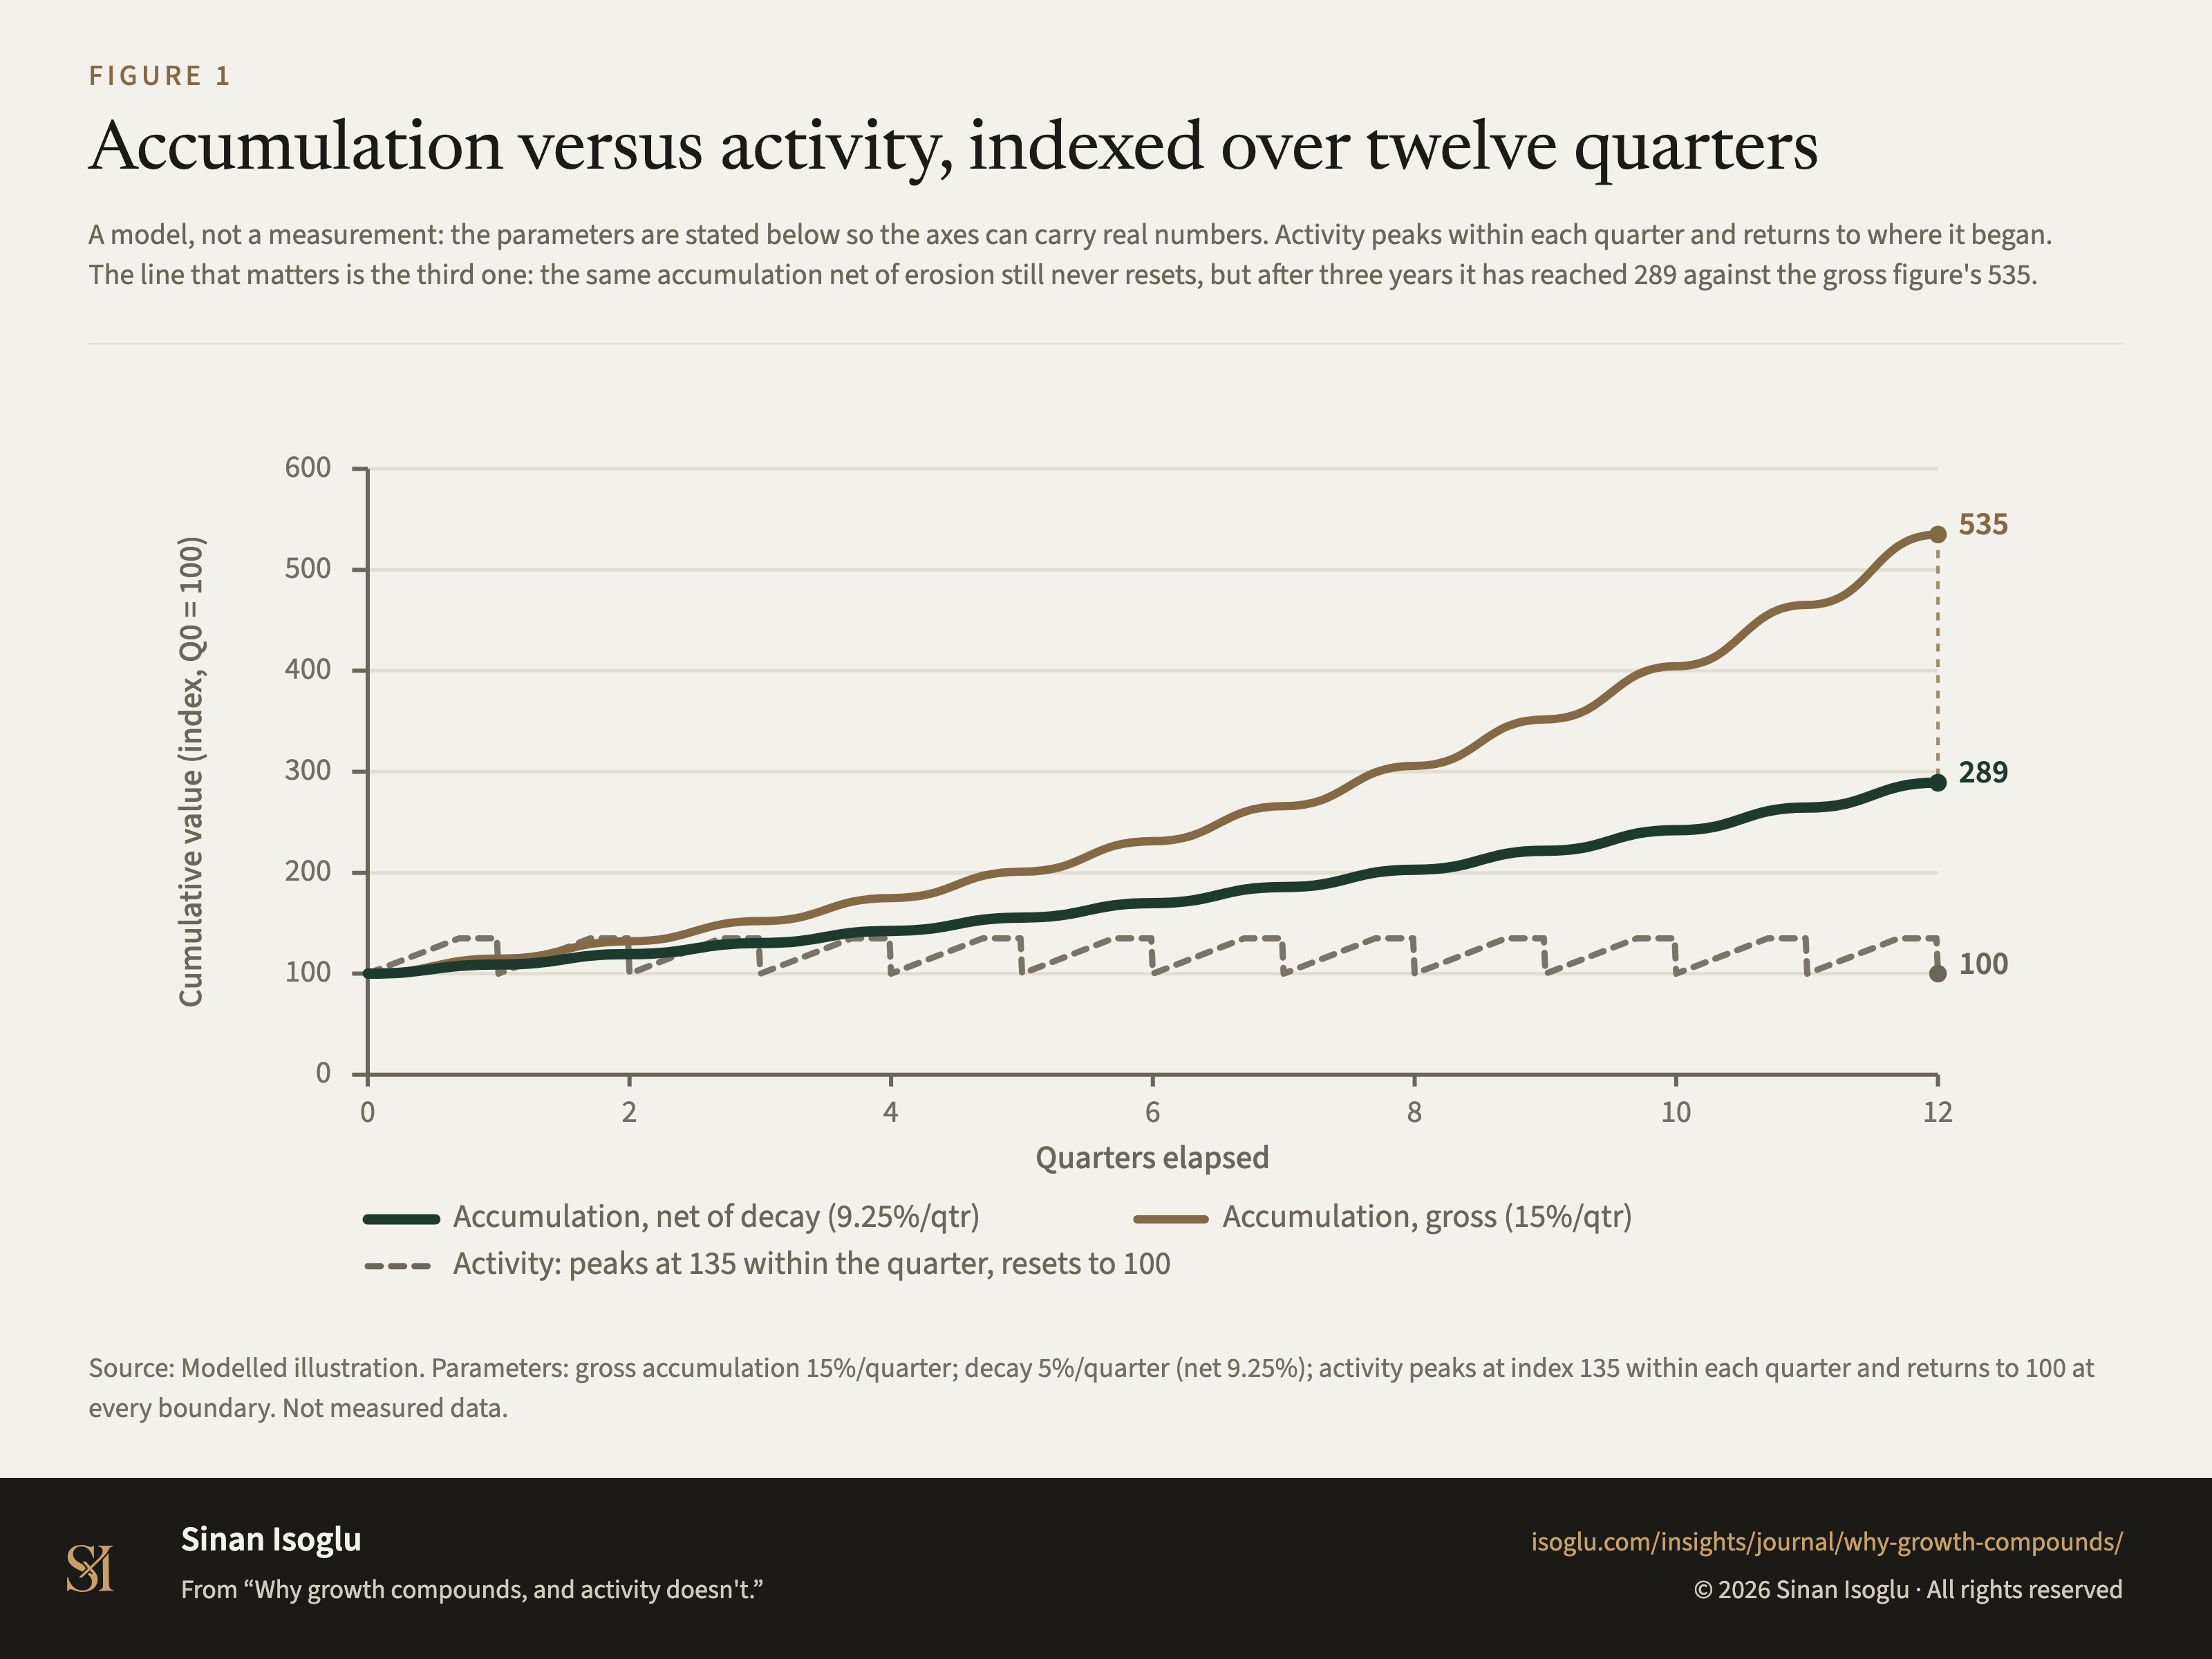
Accumulation versus activity, indexed over twelve quarters
A model, not a measurement: the parameters are stated below so the axes can carry real numbers. Activity peaks within each quarter and returns to where it began. The line that matters is the third one: the same accumulation net of erosion still never resets, but after three years it has reached 289 against the gross figure's 535.
Figure 1Accumulation versus activity, indexed over twelve quarters
Source: Modelled illustration. Parameters: gross accumulation 15%/quarter; decay 5%/quarter (net 9.25%); activity peaks at index 135 within each quarter and returns to 100 at every boundary. Not measured data.
Source and evidence
Each line names a claim related to this exhibit, its source, and how it was checked.
- A DC89-C1 Flows adjust instantly, stocks do not, in the authors' own words: "while flows can be adjusted instantaneously, stocks cannot", and "It takes a consistent pattern of resource flows to accumulate a desired change in strategic asset stocks"dierickx-cool-1989-asset-stock
- A DC89-C7 All asset stocks decay without maintenance spend, in the authors' own words: "preciates over time because of technological obsolescence; brand awareness erodes because the consumer population is not stationary", since "R&D know-how de"preciates and "all asset stocks" decay "in the absence of adequate" maintenance expendituresdierickx-cool-1989-asset-stock
Grades: A, verified against the printed page of the primary source · B, primary source, text layer only · C, authoritative secondary · D, reported.
From the essay
Growth that compounds
Why growth compounds, and activity doesn't.
The quiet difference between moves that make the next move easier and work that resets when the quarter ends, and why the second is much easier to fund.
Read the essayThis exhibit belongs to an essay: the numbers live here, the argument lives there.
Cite or embed
Related exhibits
Contact
Bring the question you're working on.
Research, a guest lecture, or a commercial question.