Figure 2From “What is the synthetic control method?”
California before Proposition 99: the real state, its synthetic version and the donor average
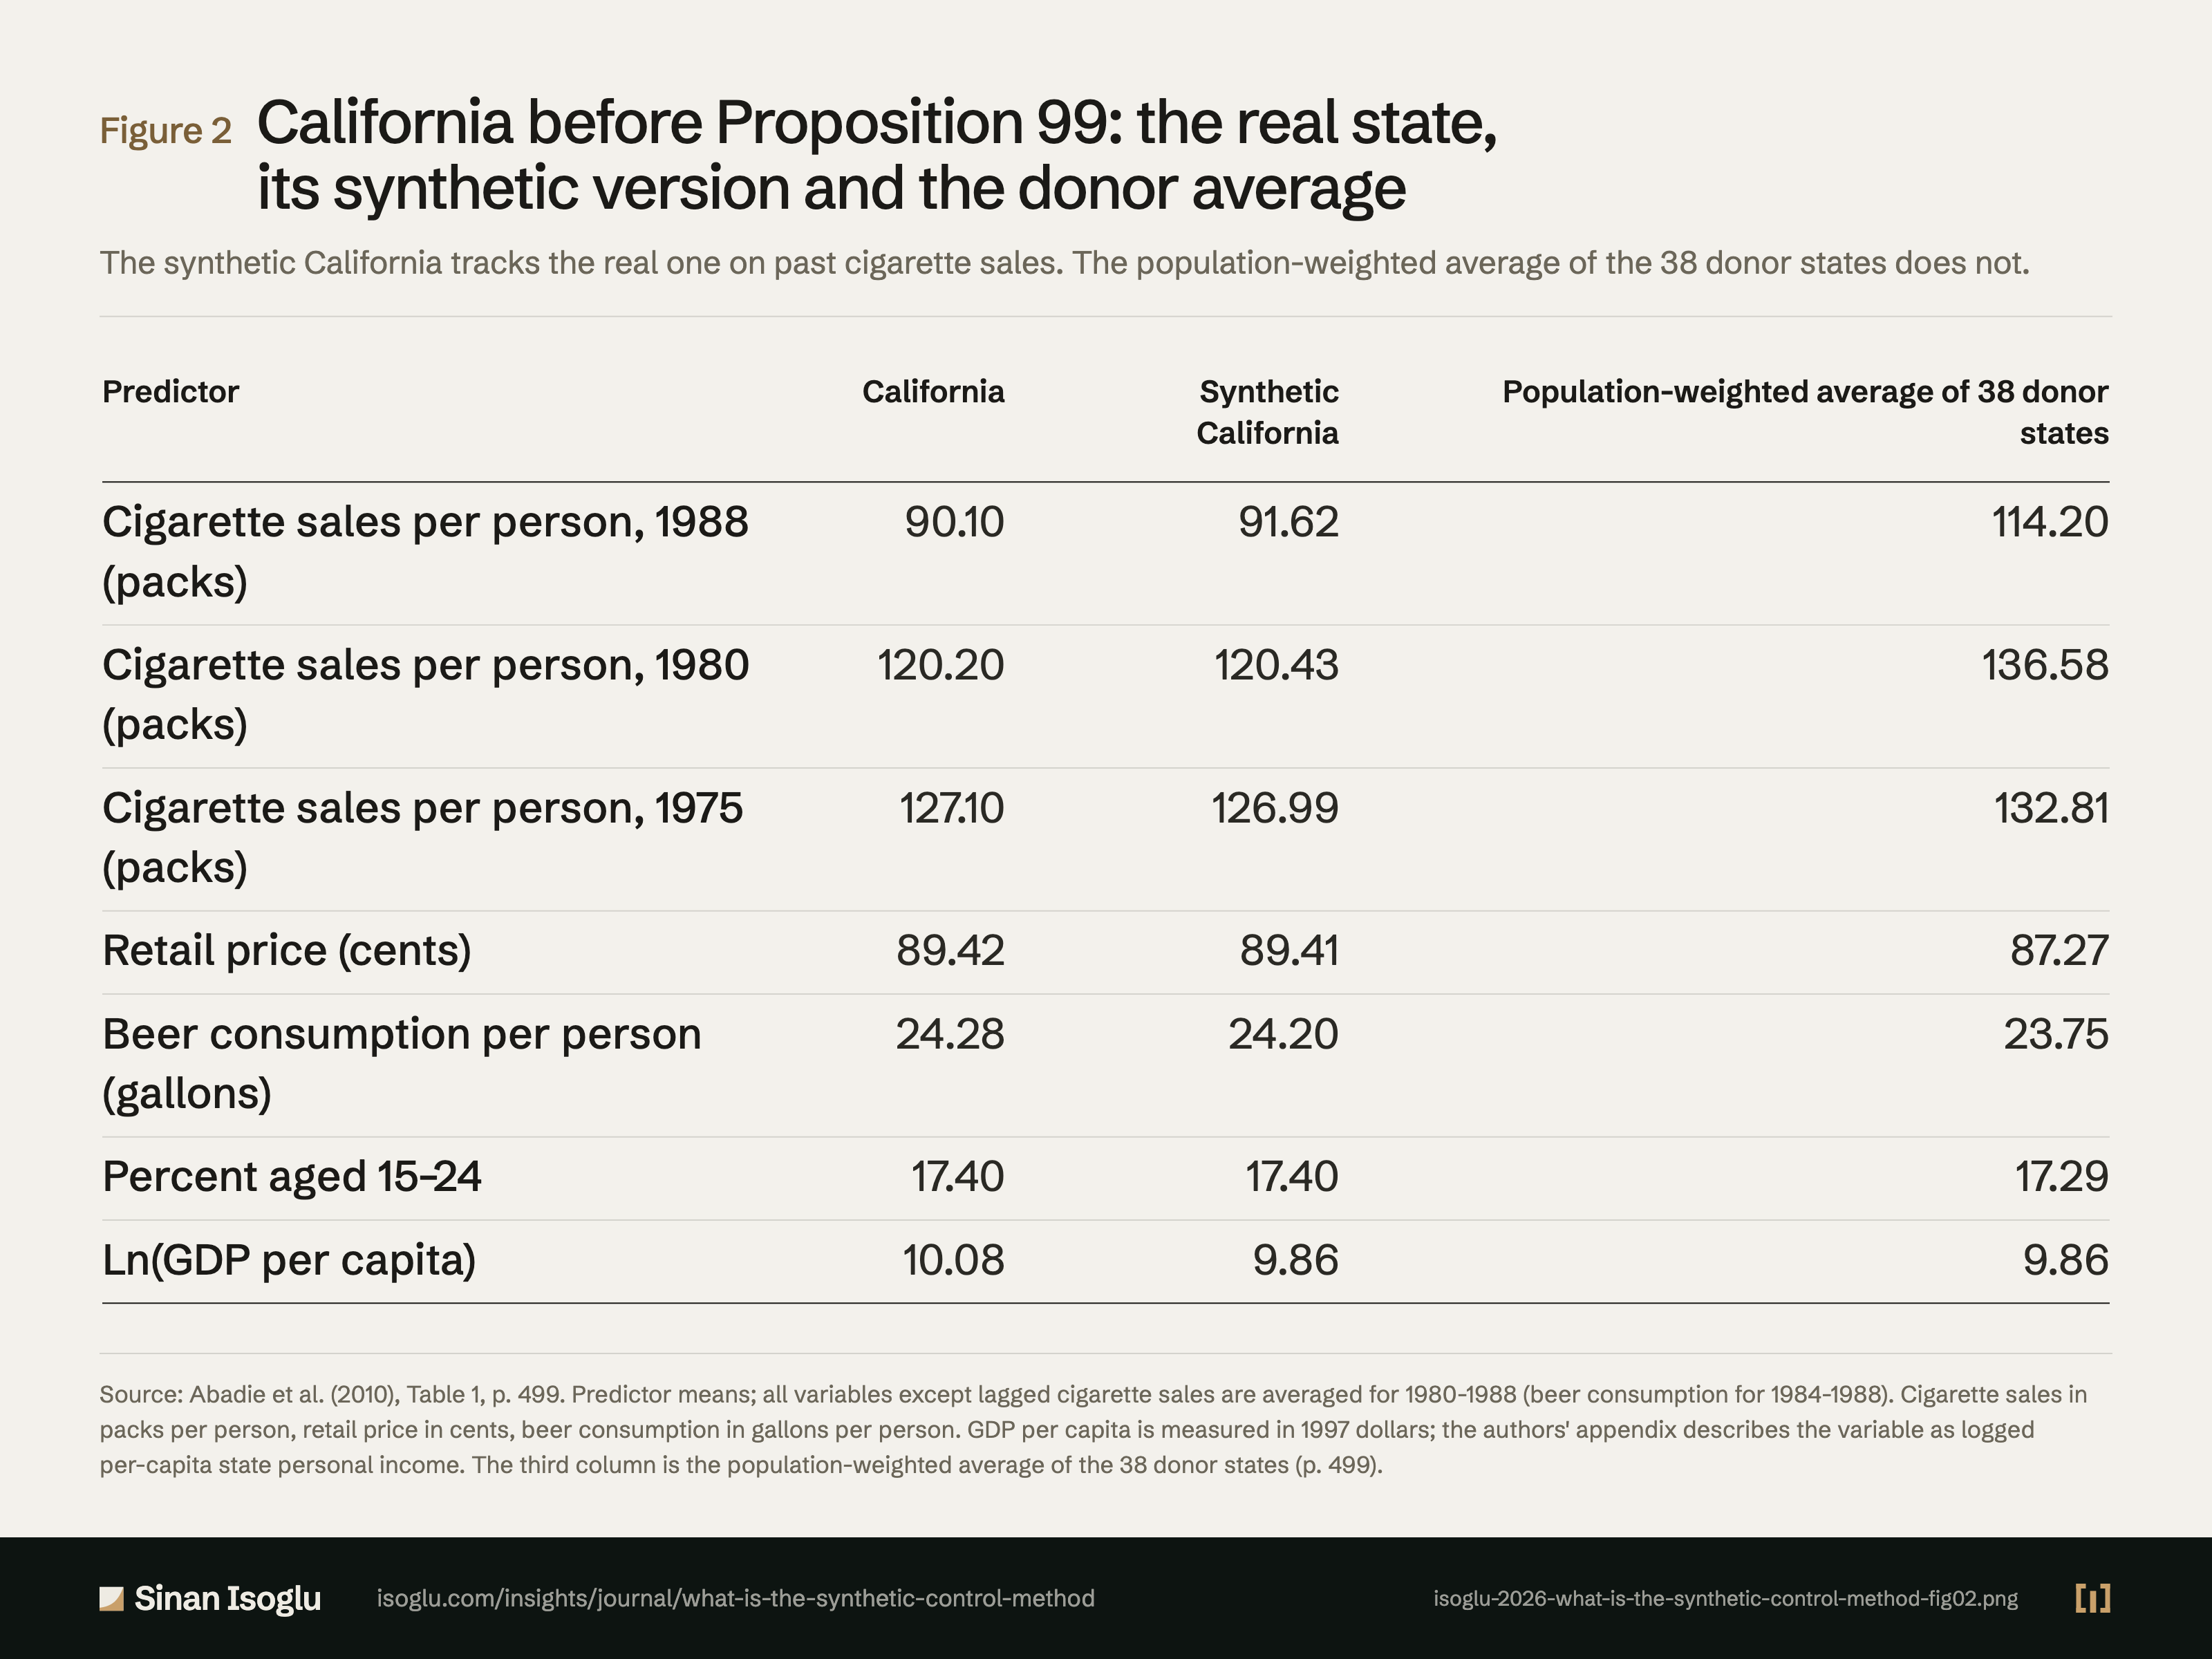
The synthetic California tracks the real one on past cigarette sales. The population-weighted average of the 38 donor states does not.
Figure 2California before Proposition 99: the real state, its synthetic version and the donor average
| Predictor | California | Synthetic California | Population-weighted average of 38 donor states |
|---|---|---|---|
| Cigarette sales per person, 1988 (packs) | 90.10 | 91.62 | 114.20 |
| Cigarette sales per person, 1980 (packs) | 120.20 | 120.43 | 136.58 |
| Cigarette sales per person, 1975 (packs) | 127.10 | 126.99 | 132.81 |
| Retail price (cents) | 89.42 | 89.41 | 87.27 |
| Beer consumption per person (gallons) | 24.28 | 24.20 | 23.75 |
| Percent aged 15–24 | 17.40 | 17.40 | 17.29 |
| Ln(GDP per capita) | 10.08 | 9.86 | 9.86 |
Swipe or scroll horizontally if the table is wider than your screen.
Source: Abadie et al. (2010), Table 1, p. 499. Predictor means; all variables except lagged cigarette sales are averaged for 1980-1988 (beer consumption for 1984-1988). Cigarette sales in packs per person, retail price in cents, beer consumption in gallons per person. GDP per capita is measured in 1997 dollars; the authors' appendix describes the variable as logged per-capita state personal income. The third column is the population-weighted average of the 38 donor states (p. 499).
Source and evidence
Each line names a claim related to this exhibit, its source, and how it was checked.
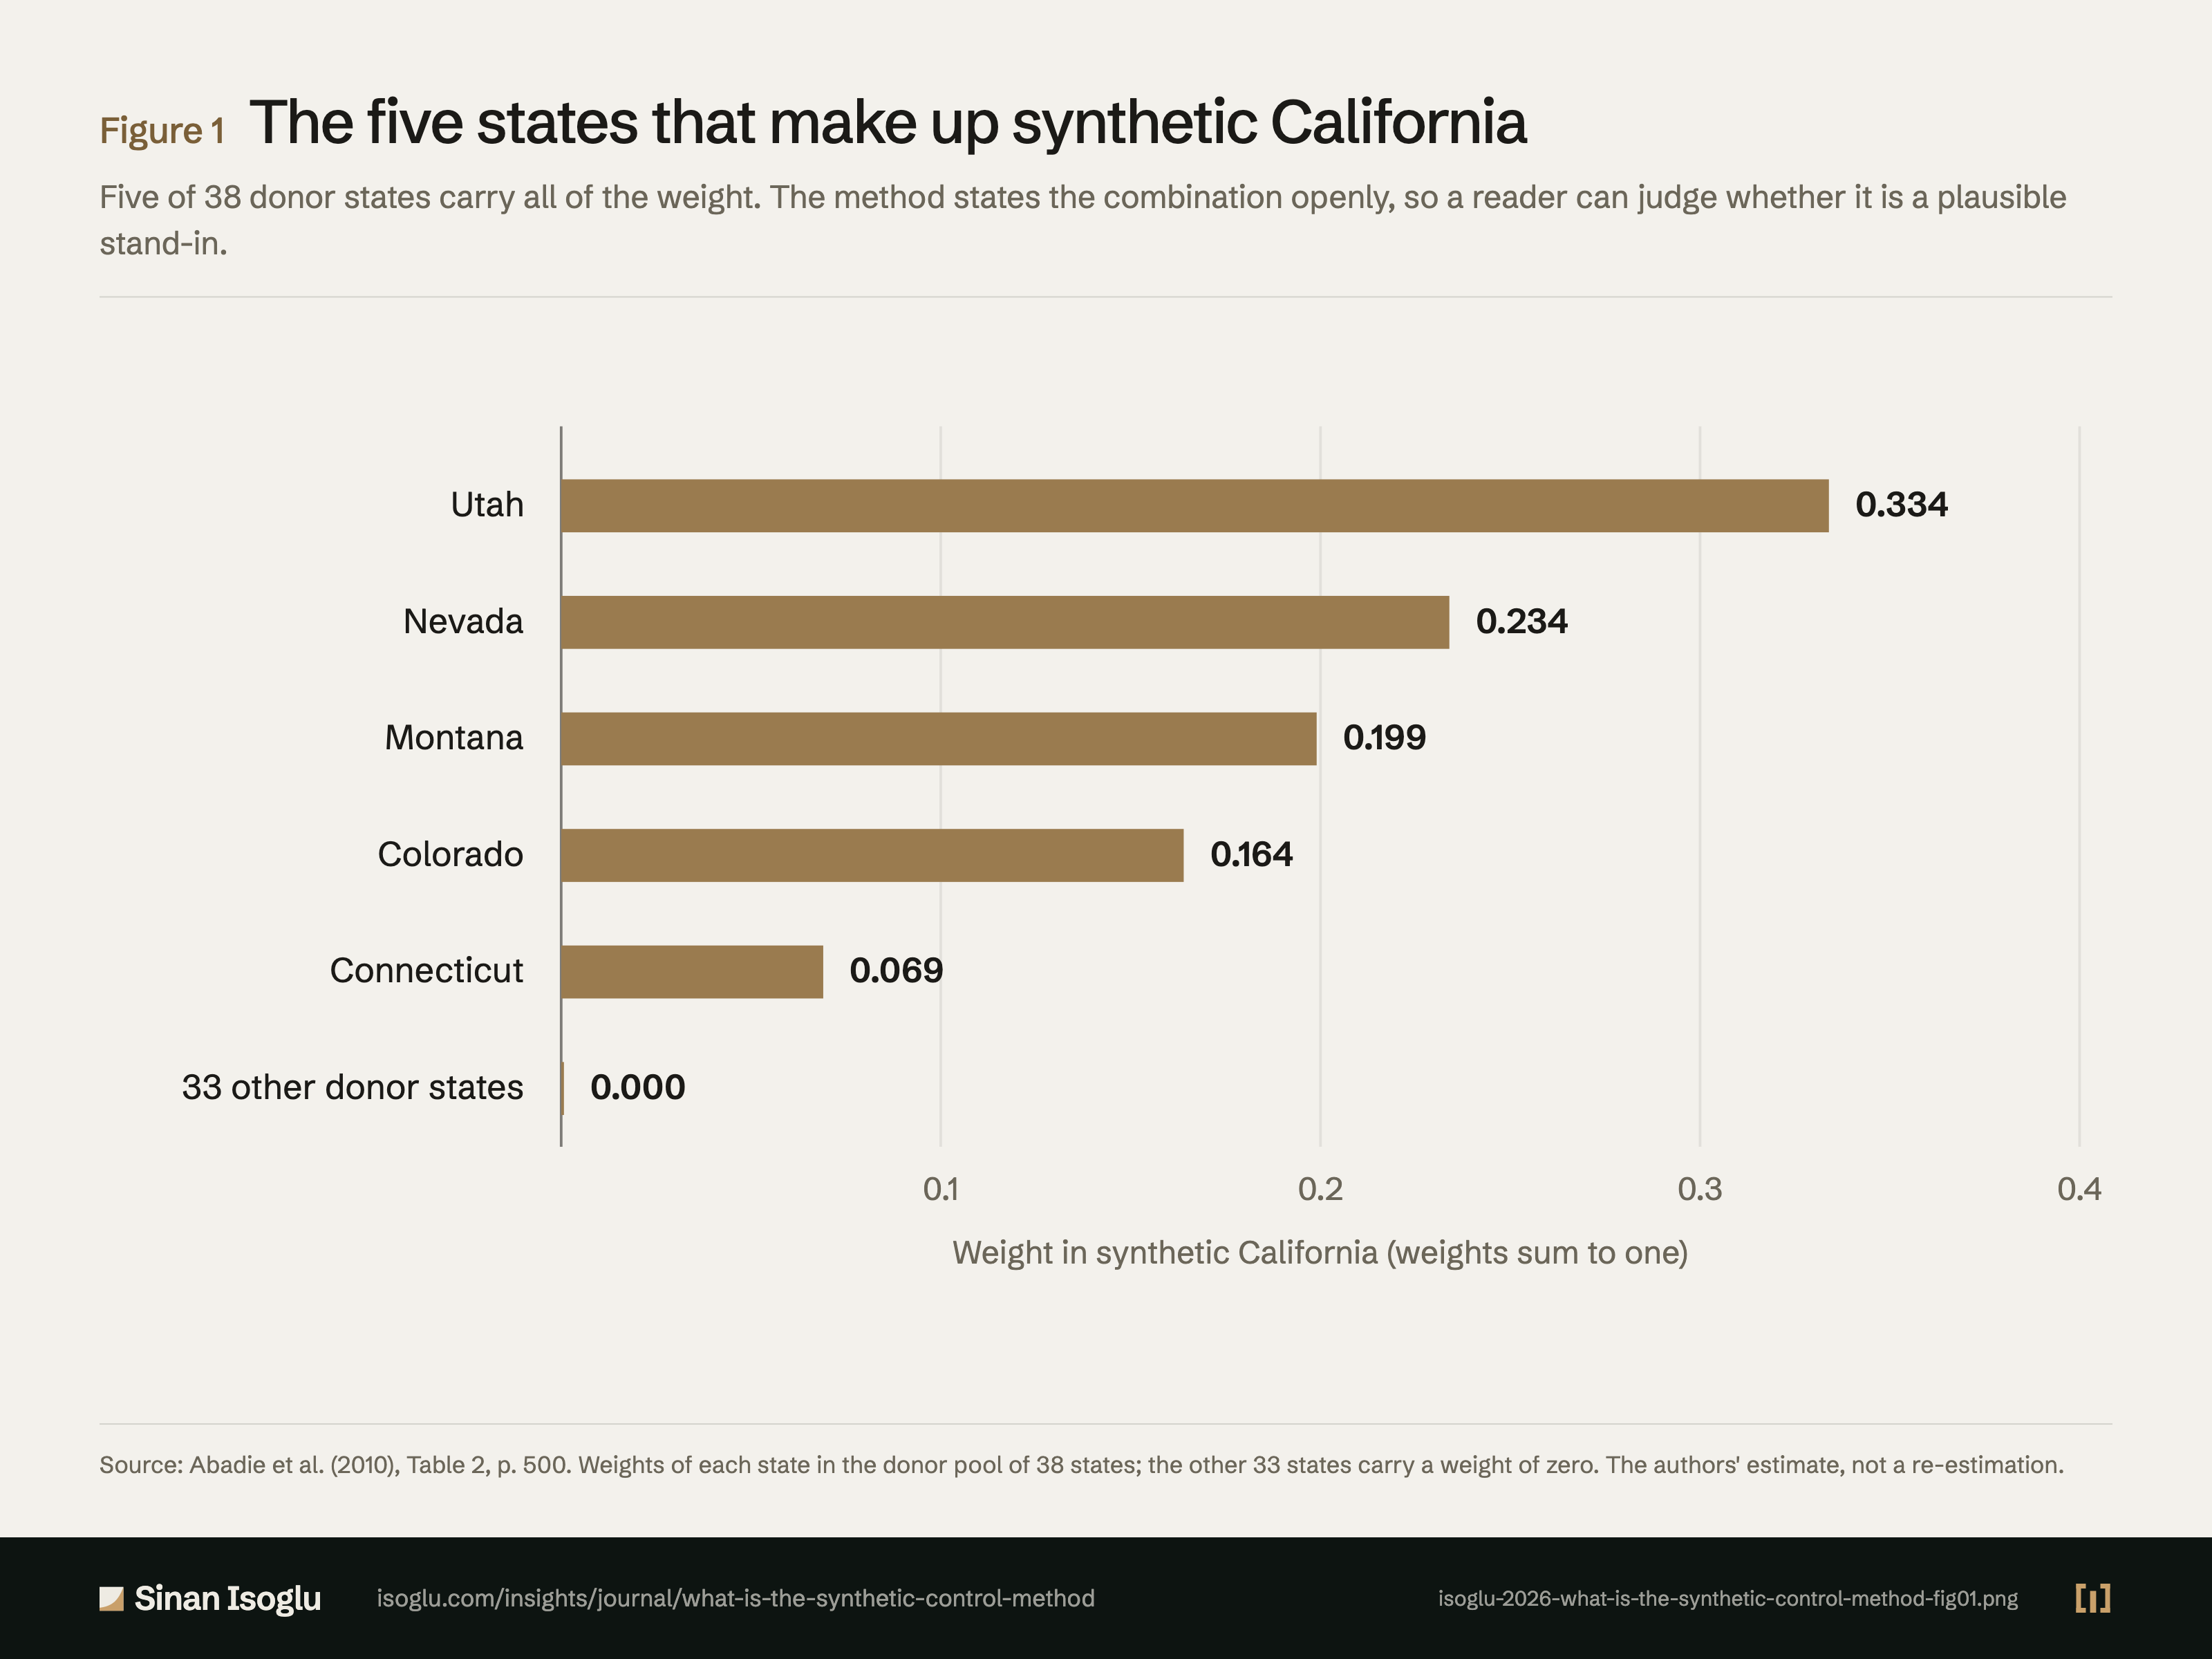
- A ADH10-C6 The population-weighted donor average is not a suitable control; the synthetic version reproduces California's values up to 1988, before Proposition 99; Table 1 gives the predictor means as real California, synthetic California and the population-weighted average of 38 states (GDP per capita in 1997 dollars, described in the appendix as logged per-capita state personal income): Ln(GDP per capita) 10.08, 9.86, 9.86; percent aged 15-24 17.40, 17.40, 17.29; retail price 89.42, 89.41, 87.27; beer consumption 24.28, 24.20, 23.75; cigarette sales 1988 90.10, 91.62, 114.20; 1980 120.20, 120.43, 136.58; 1975 127.10, 126.99, 132.81 (pp. 499, 500, 503): "the population-weighted average of the 38 states in the donor pool"; "GDP per capita is measured in 1997 dollars"; "Per-capita state personal income (logged)"; "does not seem to provide a suitable control group for California"; "the synthetic California accurately reproduces the values that smoking prevalence and smoking prevalence predictor variables had in California prior to the passage of Proposition 99"; "log GDP per capita does not have substantial power predicting the per capita cigarette consumption in California"Abadie, Diamond & Hainmueller. (2010)
Grades: A, verified against the printed page of the primary source · B, primary source, text layer only · C, authoritative secondary · D, reported.
From the essay
From the research bench
What is the synthetic control method?
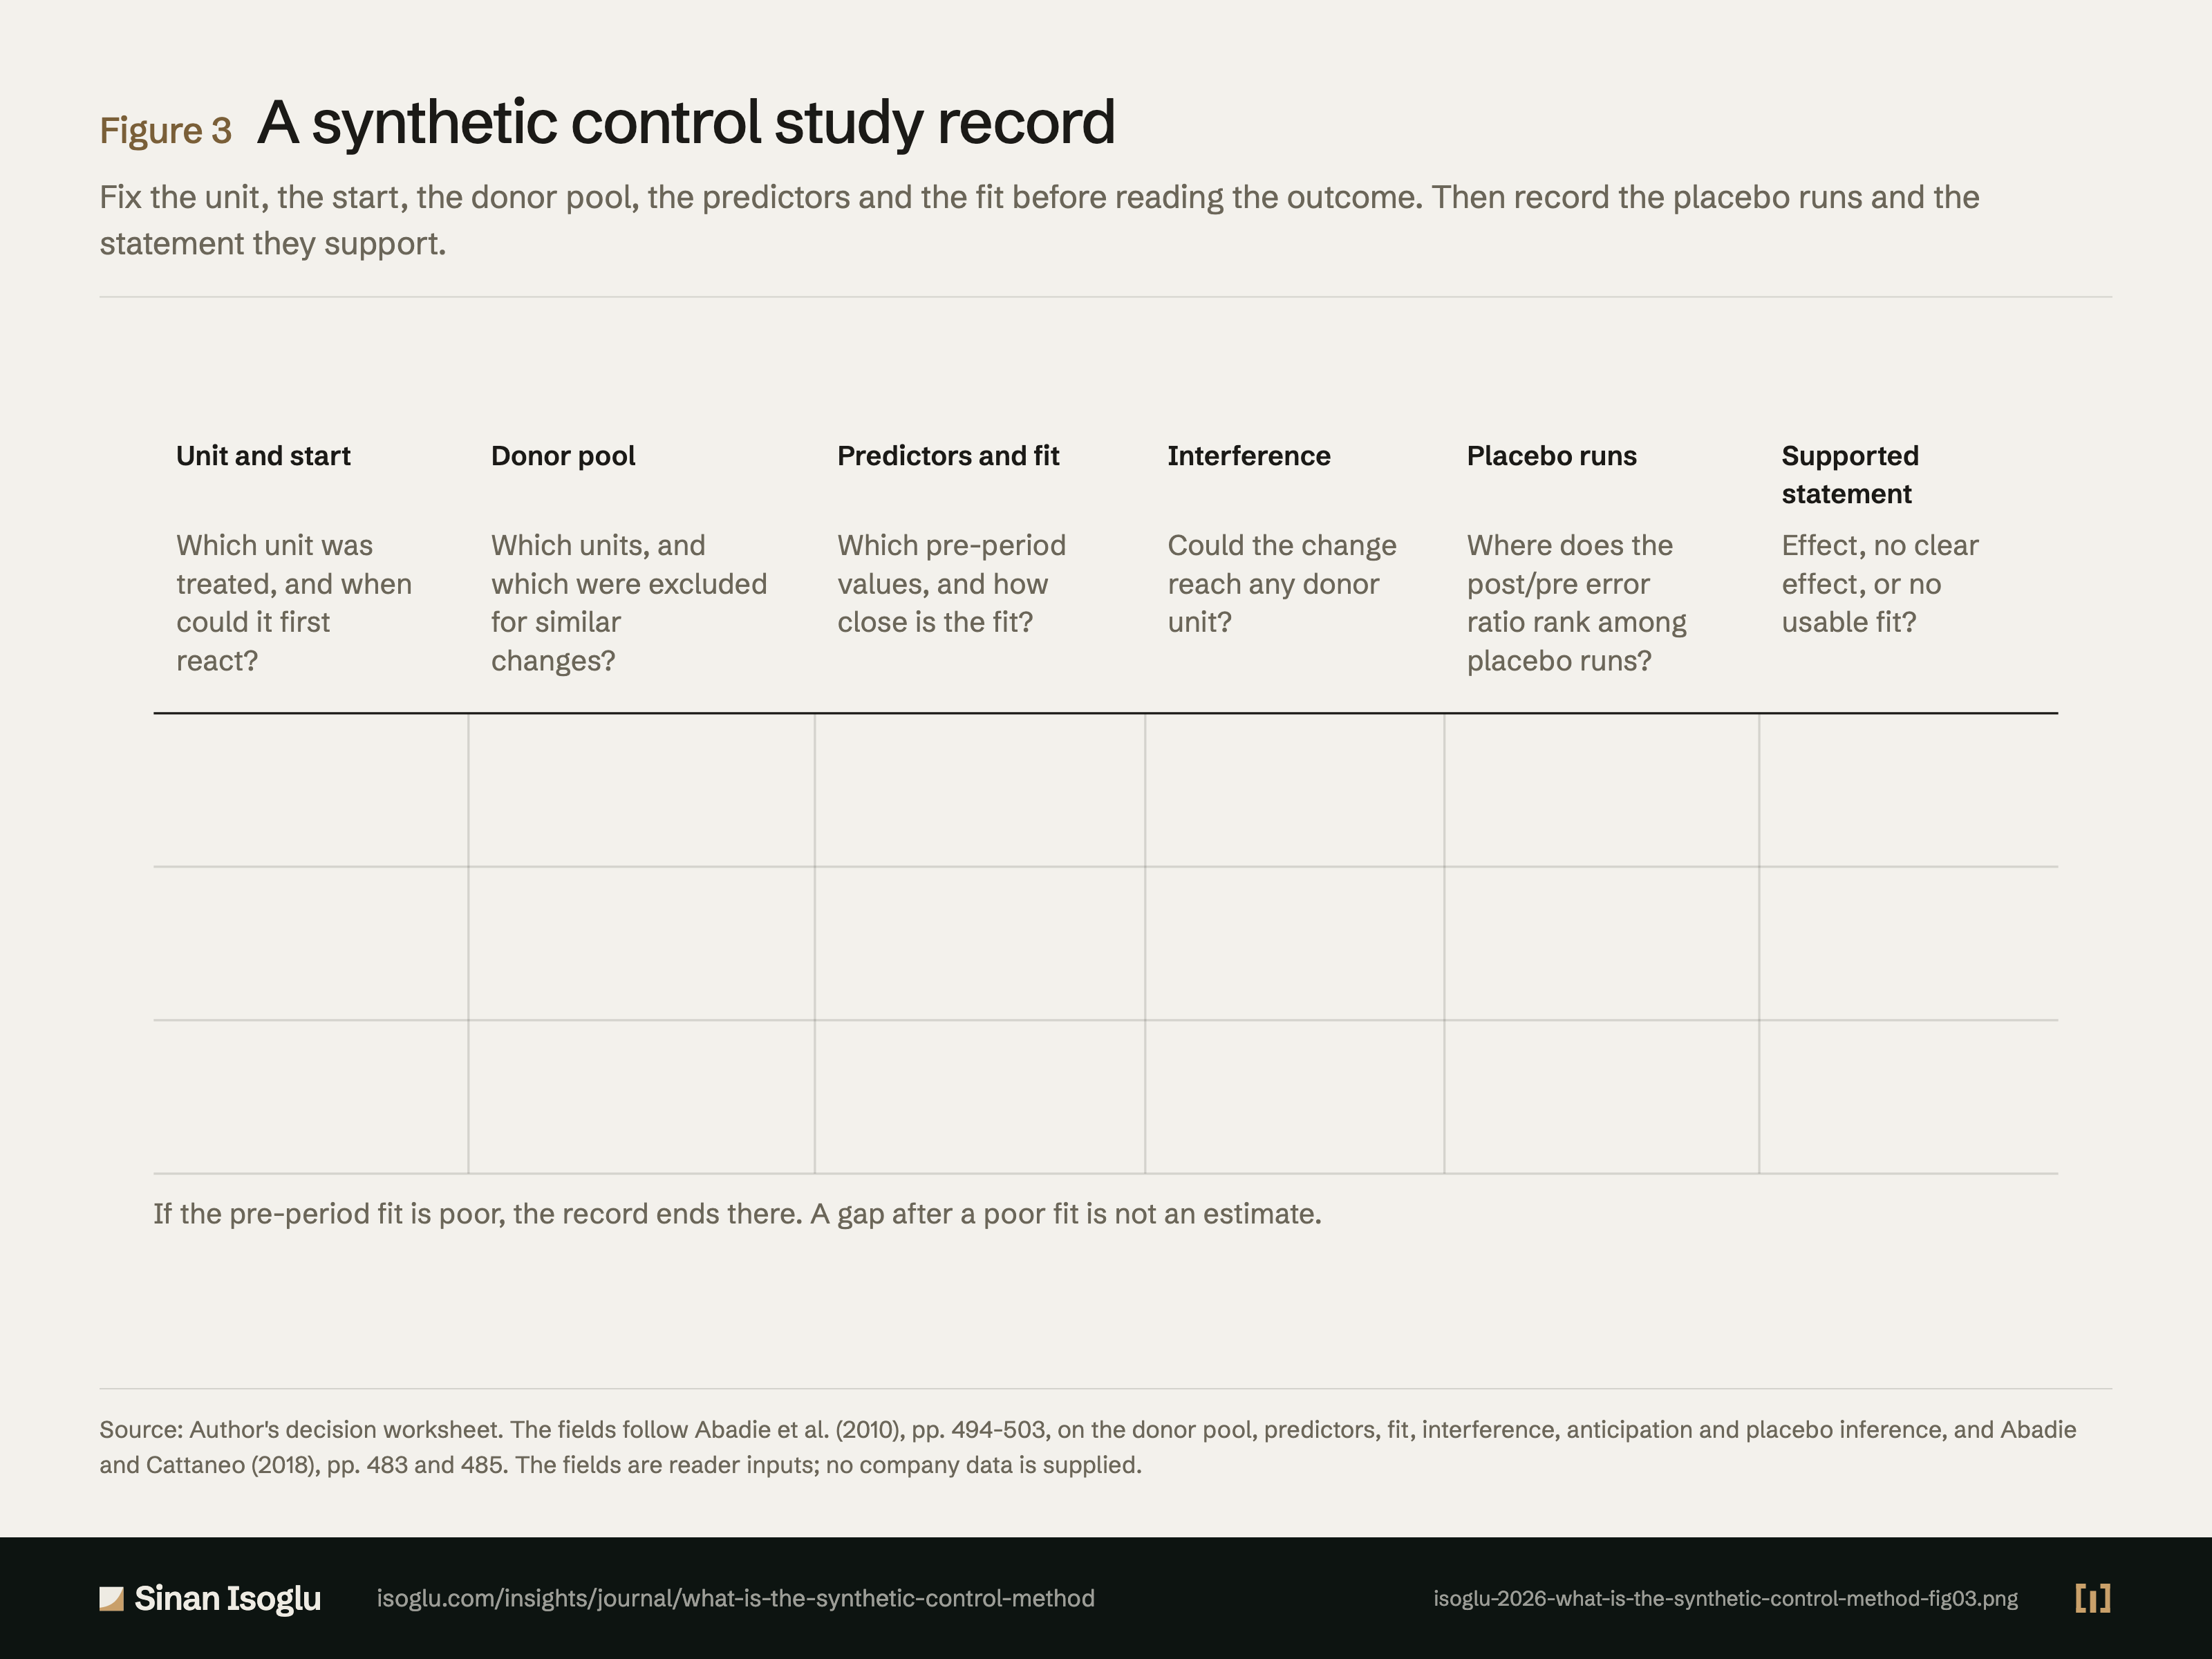
A synthetic control builds the missing comparison for one treated unit from a weighted mix of untreated ones. It only works if the mix fits the past.
Read the essayThis exhibit belongs to an essay: the numbers live here, the argument lives there.
Cite or embed
Contact
Bring the question you're working on.
Research, a guest lecture, or a commercial question.