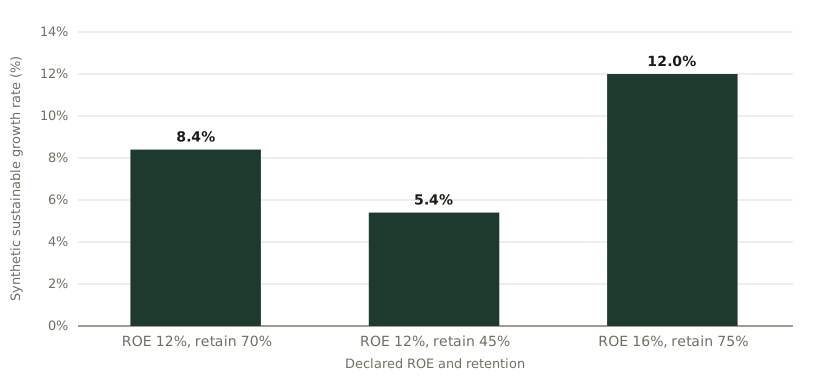
Synthetic sustainable-growth-rate scenarios
SGR changes when ROE or retention changes. The bars show the output of a declared identity, not an operating forecast or universal target.
Reference & Evidence
Source: Author's synthetic SGR scenario model grounded in Robinson (1986) and Hulten and Hao (2008). The identity, assumptions, and values are illustrative; they are not current-company figures, a forecast, or financial advice.
Each line is a claim from the register this journal publishes against, resolved from the register at build time.
- B Sustainable growth rate is a conditional financing identity, commonly return on equity multiplied by retention ratio Author framework grounded in ROB86-C1 and CHS09-C1 ·
G07-OWN-C1 - B ROE, retention, payout, capital base, leverage, and external-financing assumptions must be declared before interpretation Author record design ·
G07-OWN-C2 - B Retention ratio can be represented as one minus payout ratio under the declared convention Author formula ·
G07-OWN-C3
Grades: A, verified against the printed page of the primary source · B, primary source, text layer only · C, authoritative secondary · D, reported.
Related exhibits
-
What does sustainable growth rate mean?
From the essay What is sustainable growth rate? Growth has a financing boundary
-
What do synthetic financing scenarios show?
From the essay What is sustainable growth rate? Growth has a financing boundary
-
Synthetic GTM efficiency ranges
From the essay What is go-to-market efficiency? The denominator across growth and capacity