Figure 3From “What is sales and operations planning (S&OP)?”
S&OP case evidence at Leitax: forecast accuracy and on-time delivery at the 2002 go-live and in fall 2003
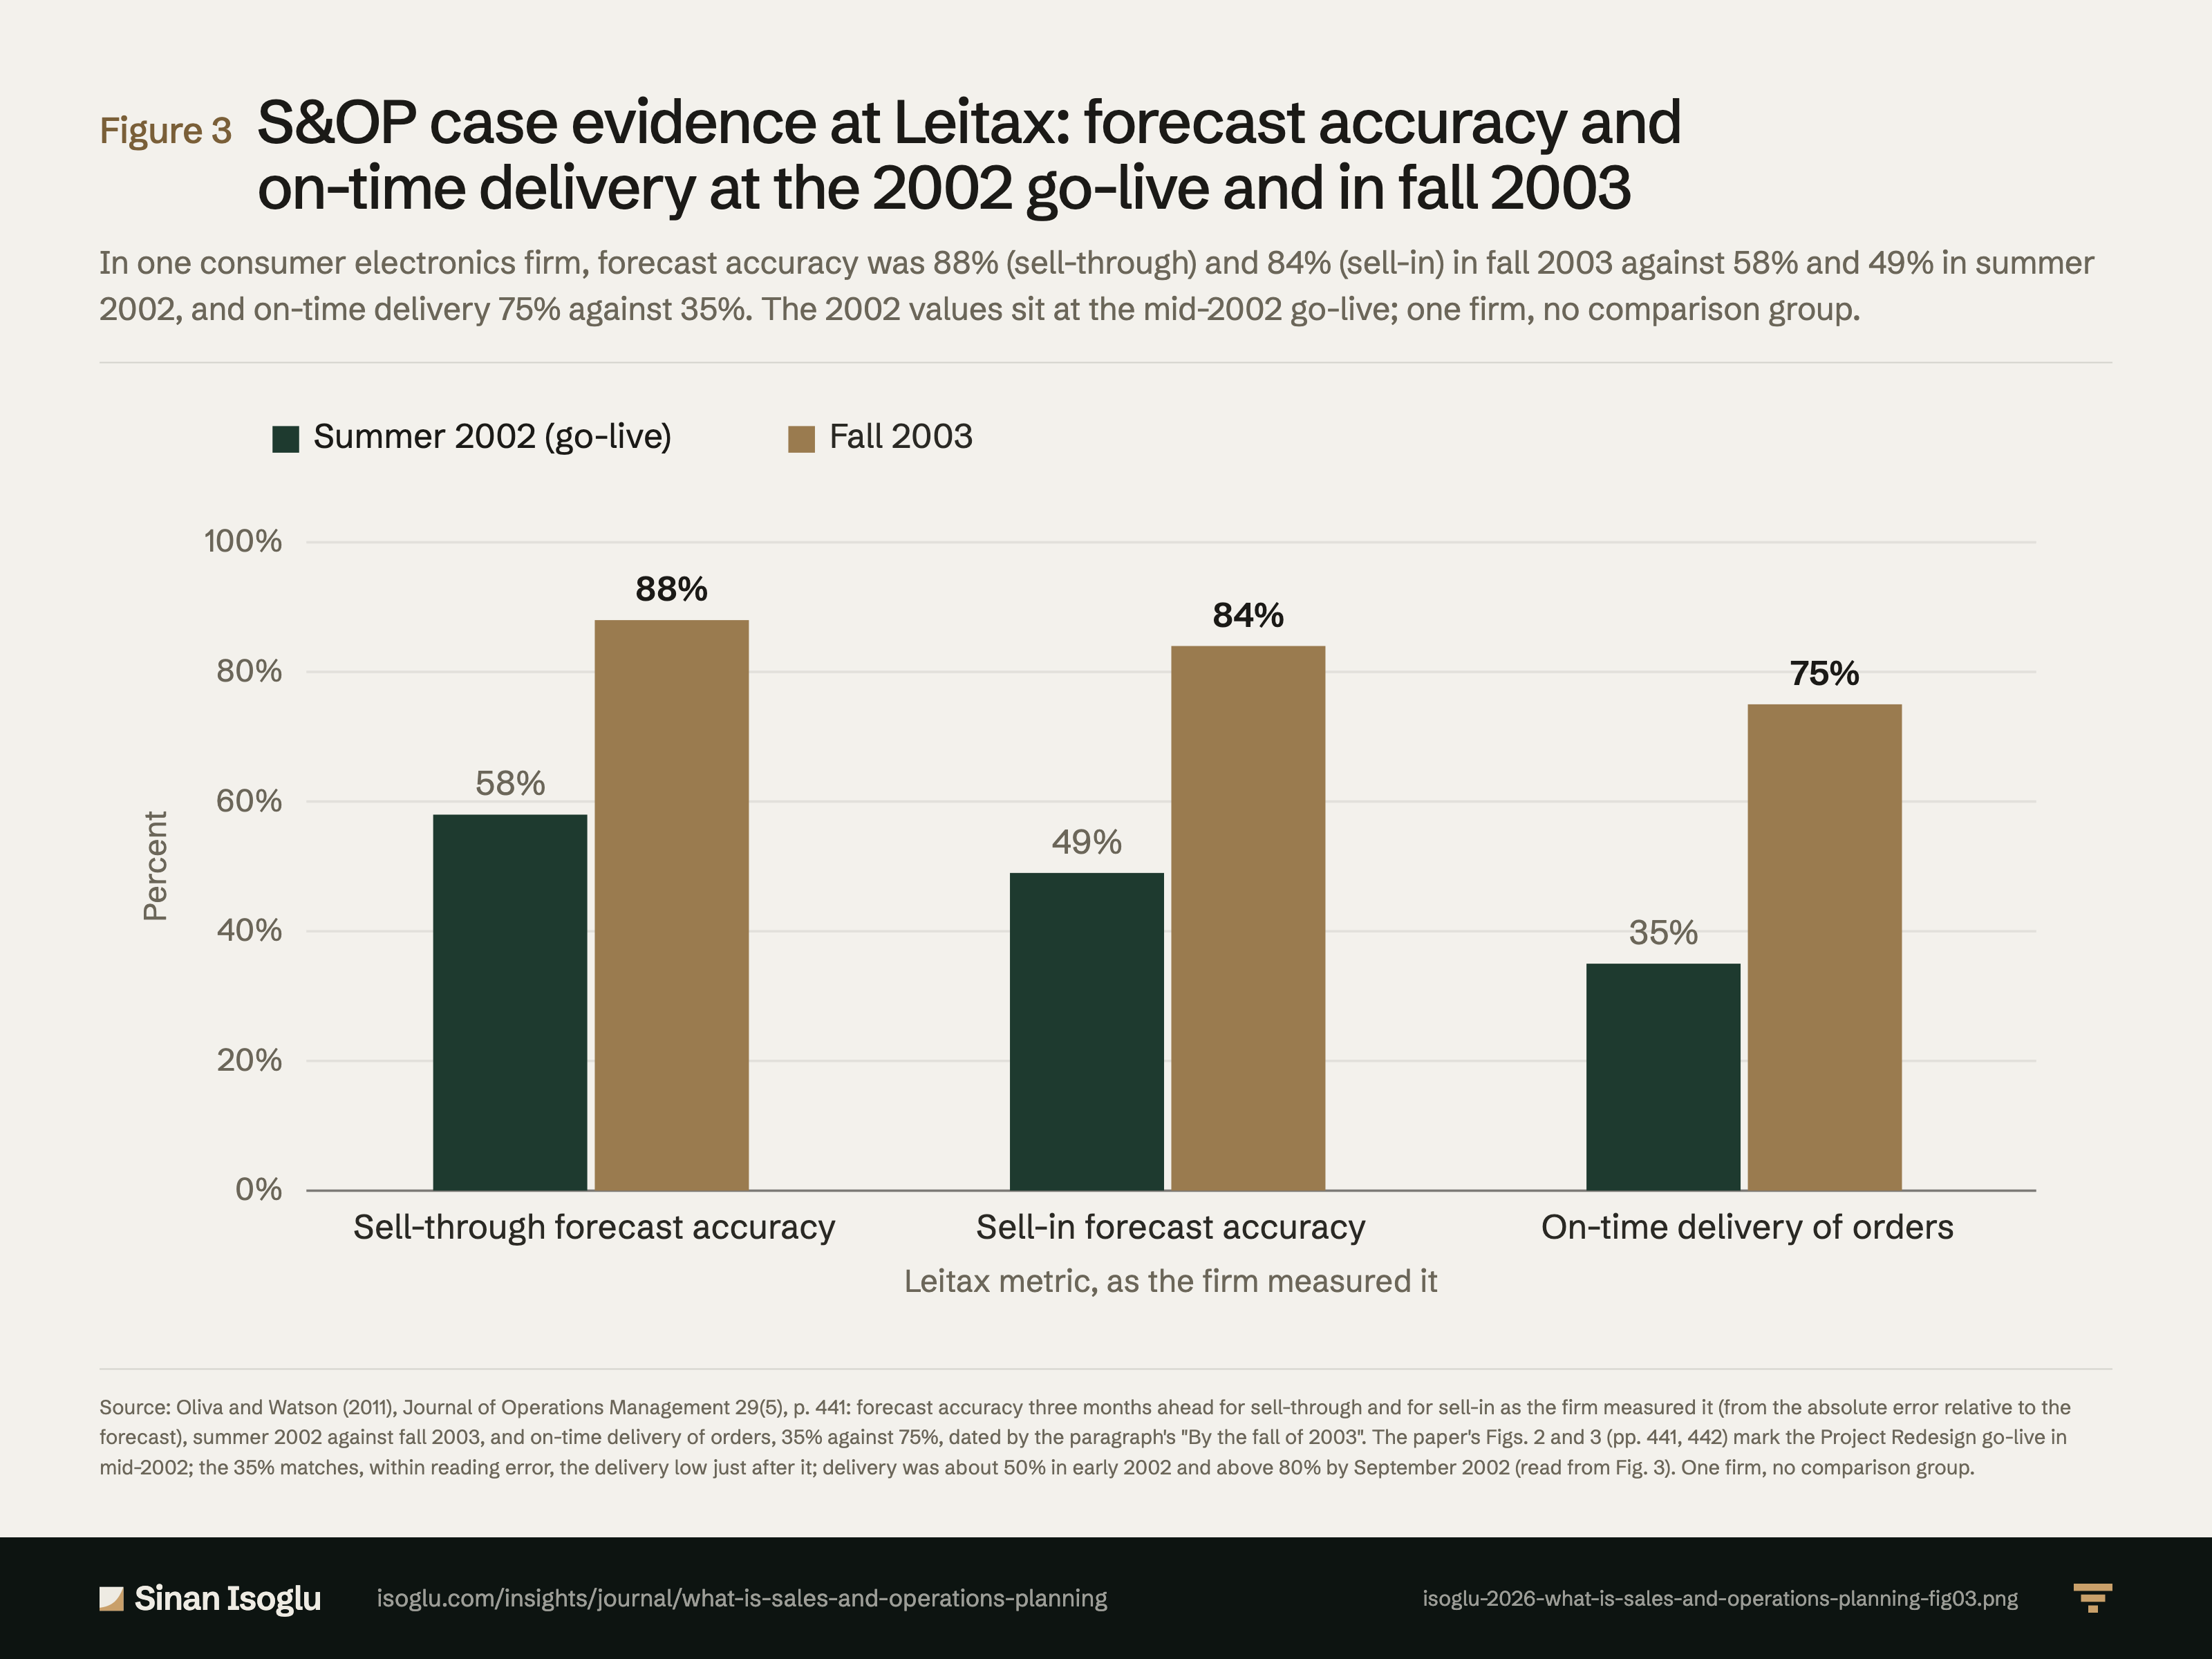
In one consumer electronics firm, forecast accuracy was 88% (sell-through) and 84% (sell-in) in fall 2003 against 58% and 49% in summer 2002, and on-time delivery 75% against 35%. The 2002 values sit at the mid-2002 go-live; one firm, no comparison group.
Figure 3S&OP case evidence at Leitax: forecast accuracy and on-time delivery at the 2002 go-live and in fall 2003
Source: Oliva and Watson (2011), Journal of Operations Management 29(5), p. 441: forecast accuracy three months ahead for sell-through and for sell-in as the firm measured it (from the absolute error relative to the forecast), summer 2002 against fall 2003, and on-time delivery of orders, 35% against 75%, dated by the paragraph's "By the fall of 2003". The paper's Figs. 2 and 3 (pp. 441, 442) mark the Project Redesign go-live in mid-2002; the 35% matches, within reading error, the delivery low just after it; delivery was about 50% in early 2002 and above 80% by September 2002 (read from Fig. 3). One firm, no comparison group.
Source and evidence
Each line names a claim related to this exhibit, its source, and how it was checked.
- A A verified against the printed page of the primary sourceB primary source, text layer onlyC authoritative secondaryD reported Operating figures in fall 2003 against values at the mid-2002 go-live: forecast accuracy three months ahead 88% sell-through and 84% sell-in, up from 58% and 49% in summer 2002; inventory turns 26 in Q4 2003, up from 12 a year earlier; average on-hand inventory $23 million, down from $55 million; on-time delivery 75%, up from 35% (the earlier level matches, within reading error, the post-go-live low in Fig. 3, p. 442); excess and obsolescence costs practically zero in FY 2003 against an average of $3 million in FY 2000–2002; meetings down to two to four hours (p. 441): "Three-months-ahead forecast accuracy (ABS[sales-forecast]/forecast) for sell-through (sell-in) was 88% (84%)"; "up from 58% (49%) in the summer of 2002"; "inventory turns in Q4’03 were 26 (up from 12 the previous year), average on-hand inventory was $23 million (down from $55 million)"; "on-time delivery of orders was 75% (up from 35%)"; "Excess and obsolescence costs were practically zero in fiscal year 2003 (down from an average of $3 million for fiscal years 2000–2002)."; "by the fall of 2003 the meetings were lasting between two and four hours and conversations were cordial". One firm, two dates around a go-live, no comparison group.Oliva & Watson (2011)
- A A verified against the printed page of the primary sourceB primary source, text layer onlyC authoritative secondaryD reported The authors' own limits: unobserved implementation dynamics, improved forecasting methodology and better management cannot be separated; forecasting performance and adherence to plans cannot be separated; the propositions are untested beyond one case (pp. 435, 437, 442, 446): "Although unobserved dynamics during the implementation of the changes in the organization could have influenced operational improvement"; "did not make clear whether performance and forecast accuracy improved solely because of the improved forecasting methodology, or also because the whole organization was being more effectively managed through a coordinated integration effort"; "In fact, during our analysis of the forecasting process, we found it difficult to determine whether the current performance in forecast accuracy was the result of the forecasting processes or of better adherence to the agreed plans."; "Finally, determining when our propositions hold remains an open research question, beyond the scope of a single case study." Repair 2026-11-13: the p. 435 span is quoted from "unobserved": "unobserved dynamics during the implementation of the changes in the organization could have influenced operational improvement".Oliva & Watson (2011)
- B A verified against the printed page of the primary sourceB primary source, text layer onlyC authoritative secondaryD reported The redesign's go-live and the on-time delivery path, read from the paper's charts (not stated in the text): Fig. 3 (p. 442, PDF p. 9, rendered) marks the chart label Project Redesign Go-Live at about June 2002; on-time delivery was about 50% in February 2002, about 33% in July 2002 (matching, within reading error, the 35% the text reports), about 83% in September 2002, and between about 67% and 89% from October 2002 to November 2003; Fig. 2 (p. 441, PDF p. 8) marks the go-live in the firm's Q4'02, the quarter of the 12 the previous year turns and the $55 million inventory. Values are chart readings to the nearest few points; the chart labels are not in the PDF text layer. The text's own figures, which the chart readings must agree with (p. 441): "inventory turns in Q4’03 were 26 (up from 12 the previous year)"; "on-time delivery of orders was 75% (up from 35%) (see Fig. 3)".Oliva & Watson (2011)
From the essay
Revenue operations & AI
What is sales and operations planning (S&OP)?
S&OP is the process, run at least monthly, in which sales, operations and finance turn an unconstrained demand view into one approved, deliverable plan.
Read the essayThis exhibit belongs to an essay: the numbers live here, the argument lives there.
Cite or embed
Related exhibits
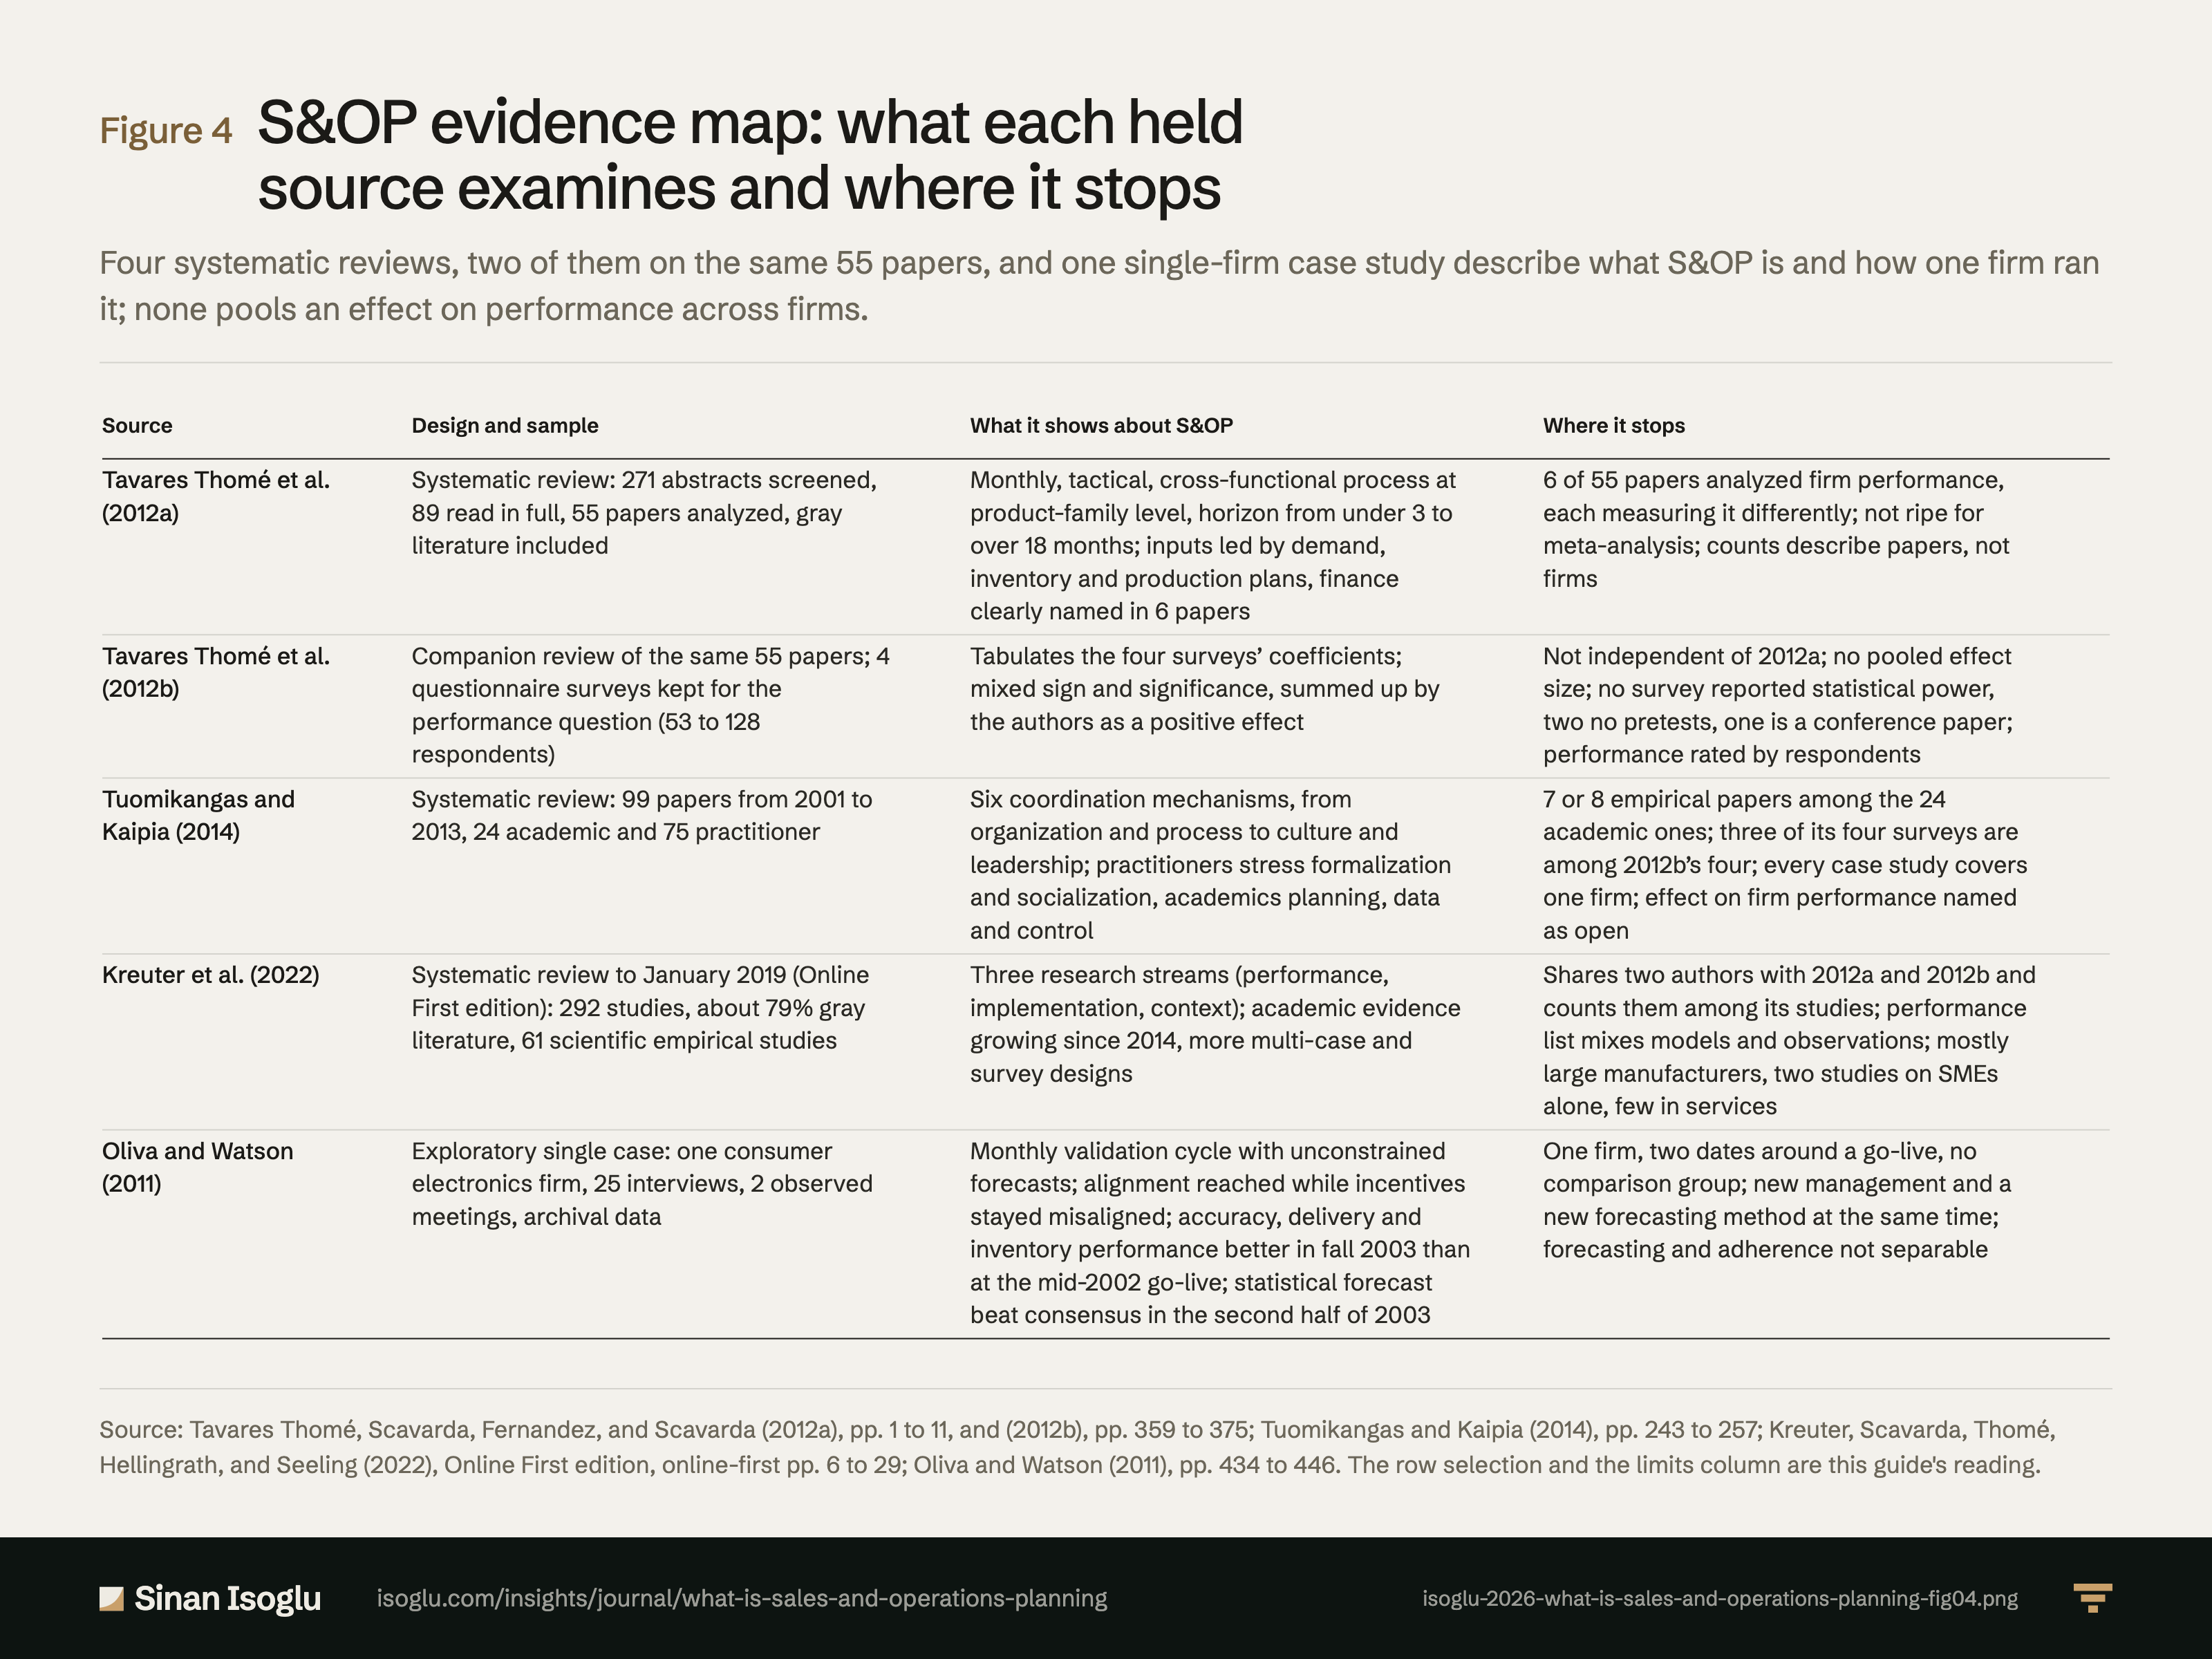
Figure 4Figure
S&OP evidence map: what each held source examines and where it stops
What is sales and operations planning (S&OP)?
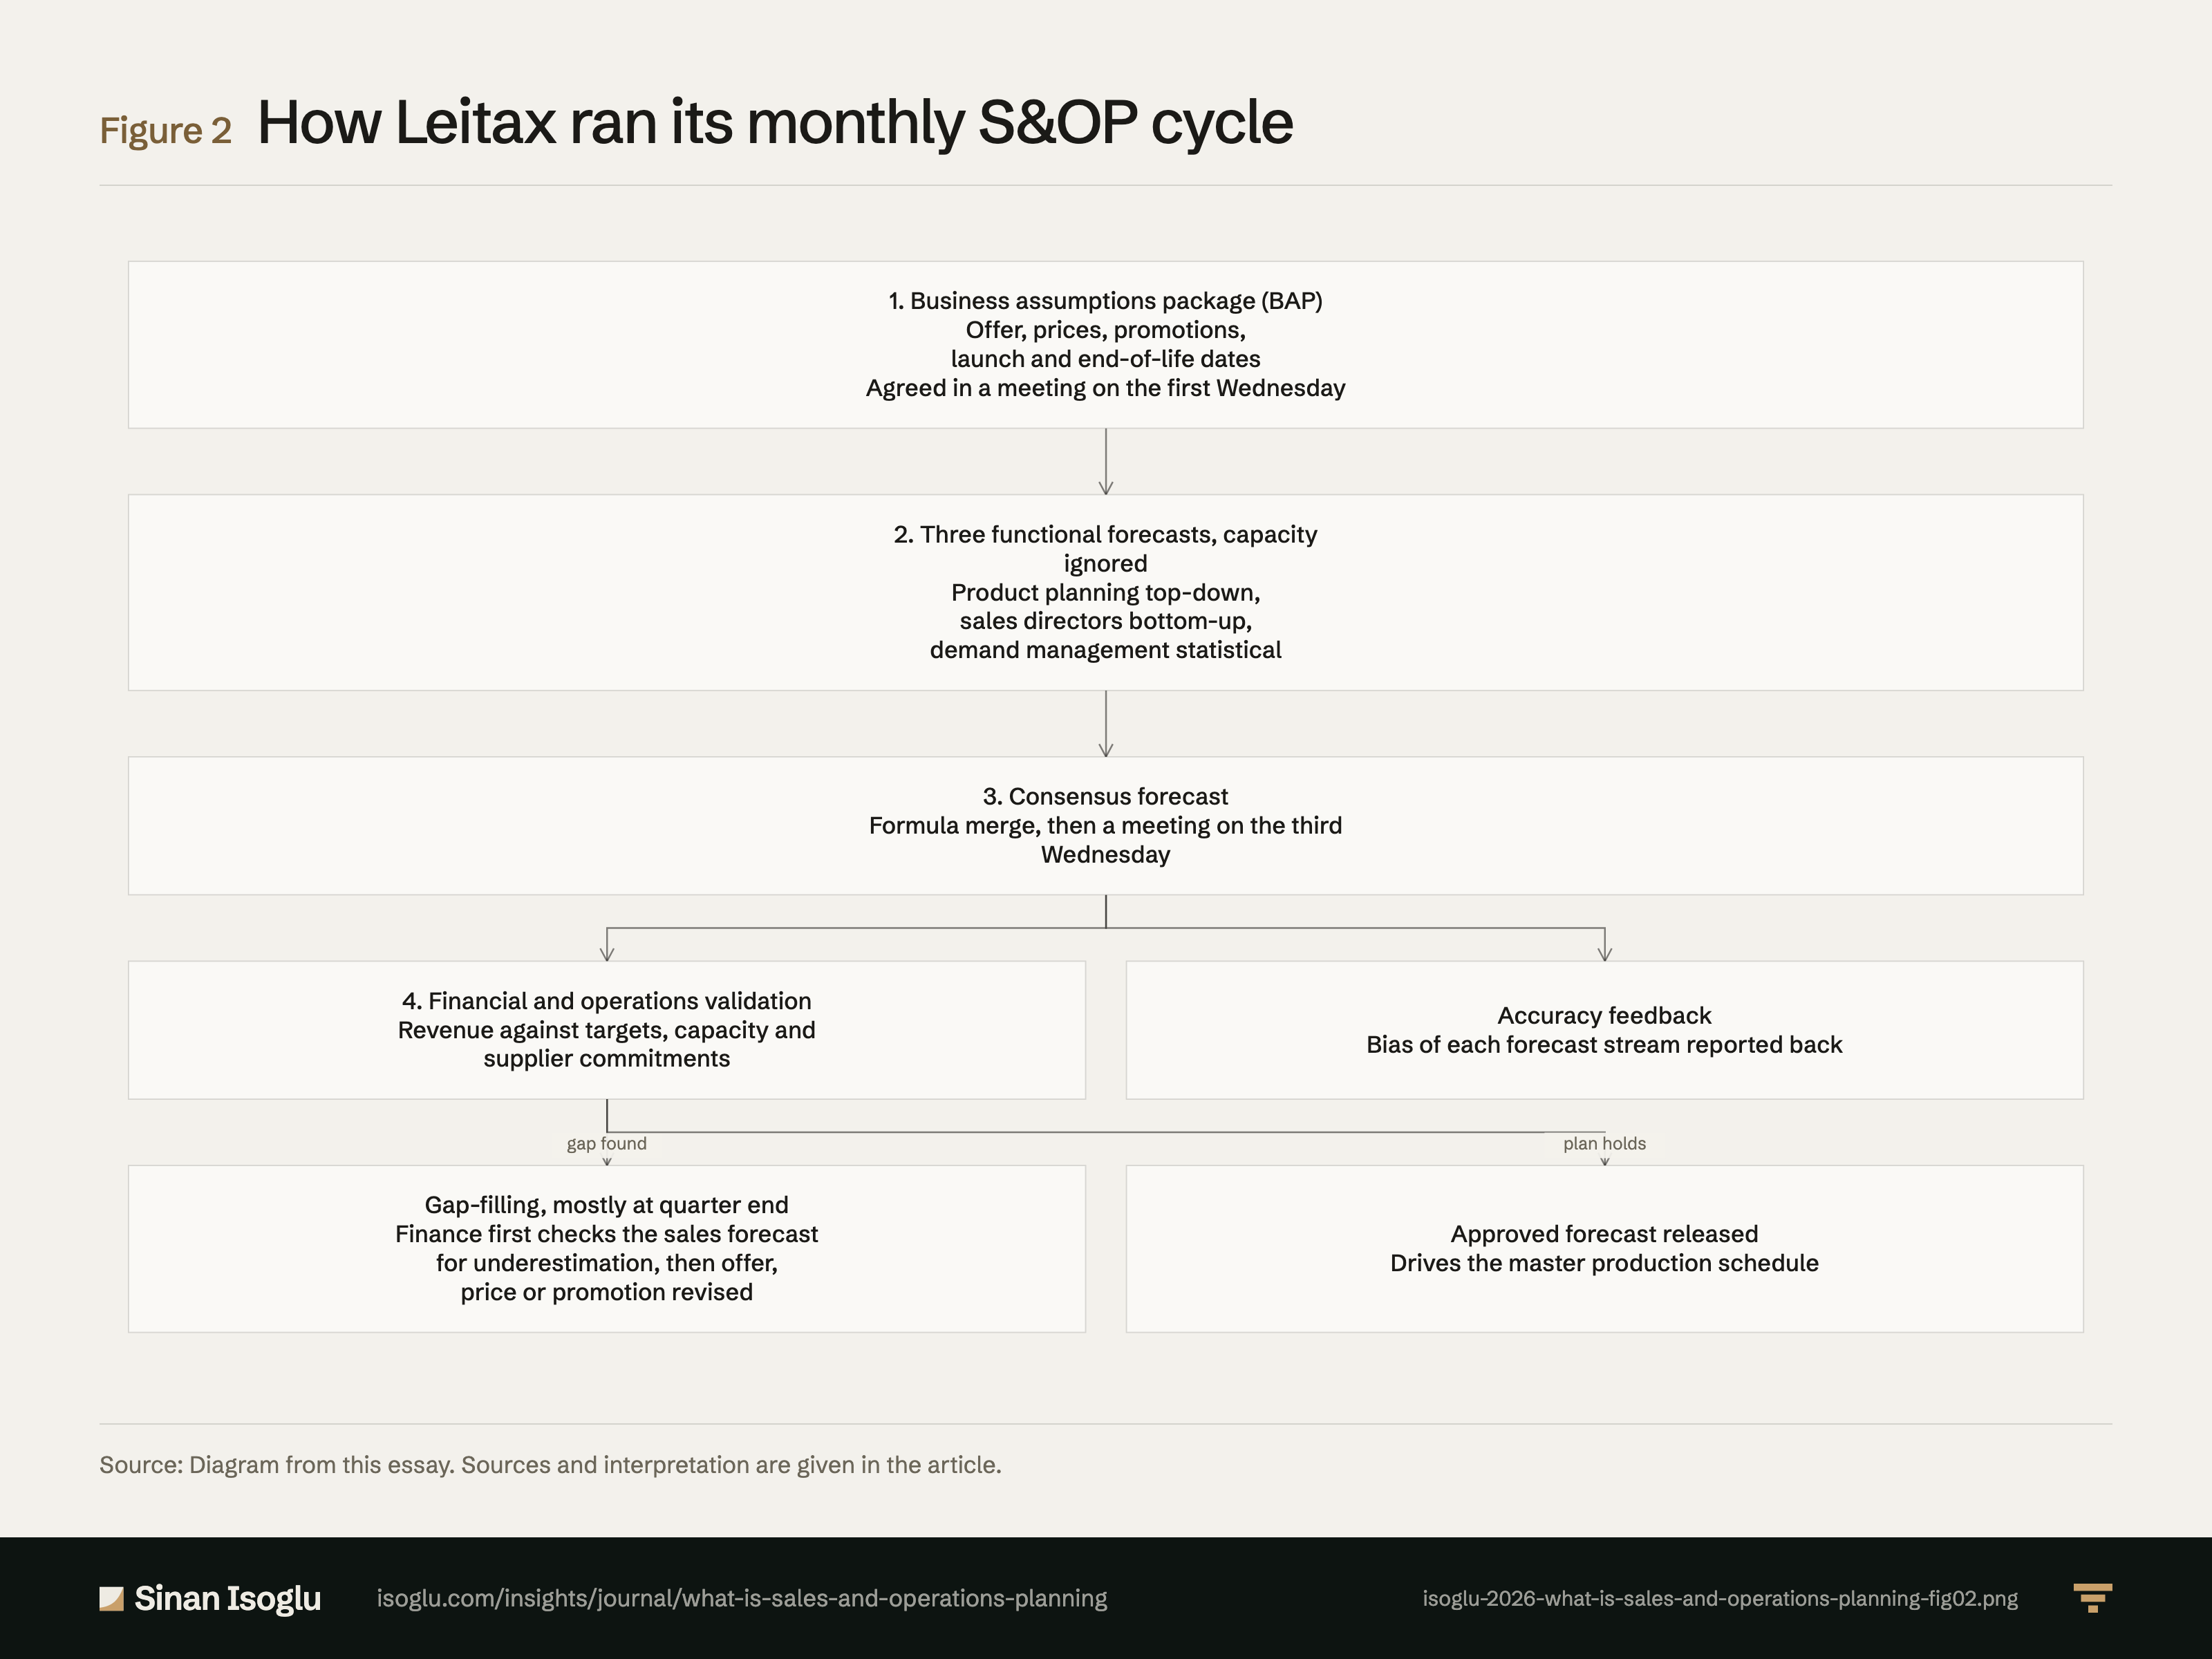
Figure 2Figure
How Leitax ran its monthly S&OP cycle
What is sales and operations planning (S&OP)?
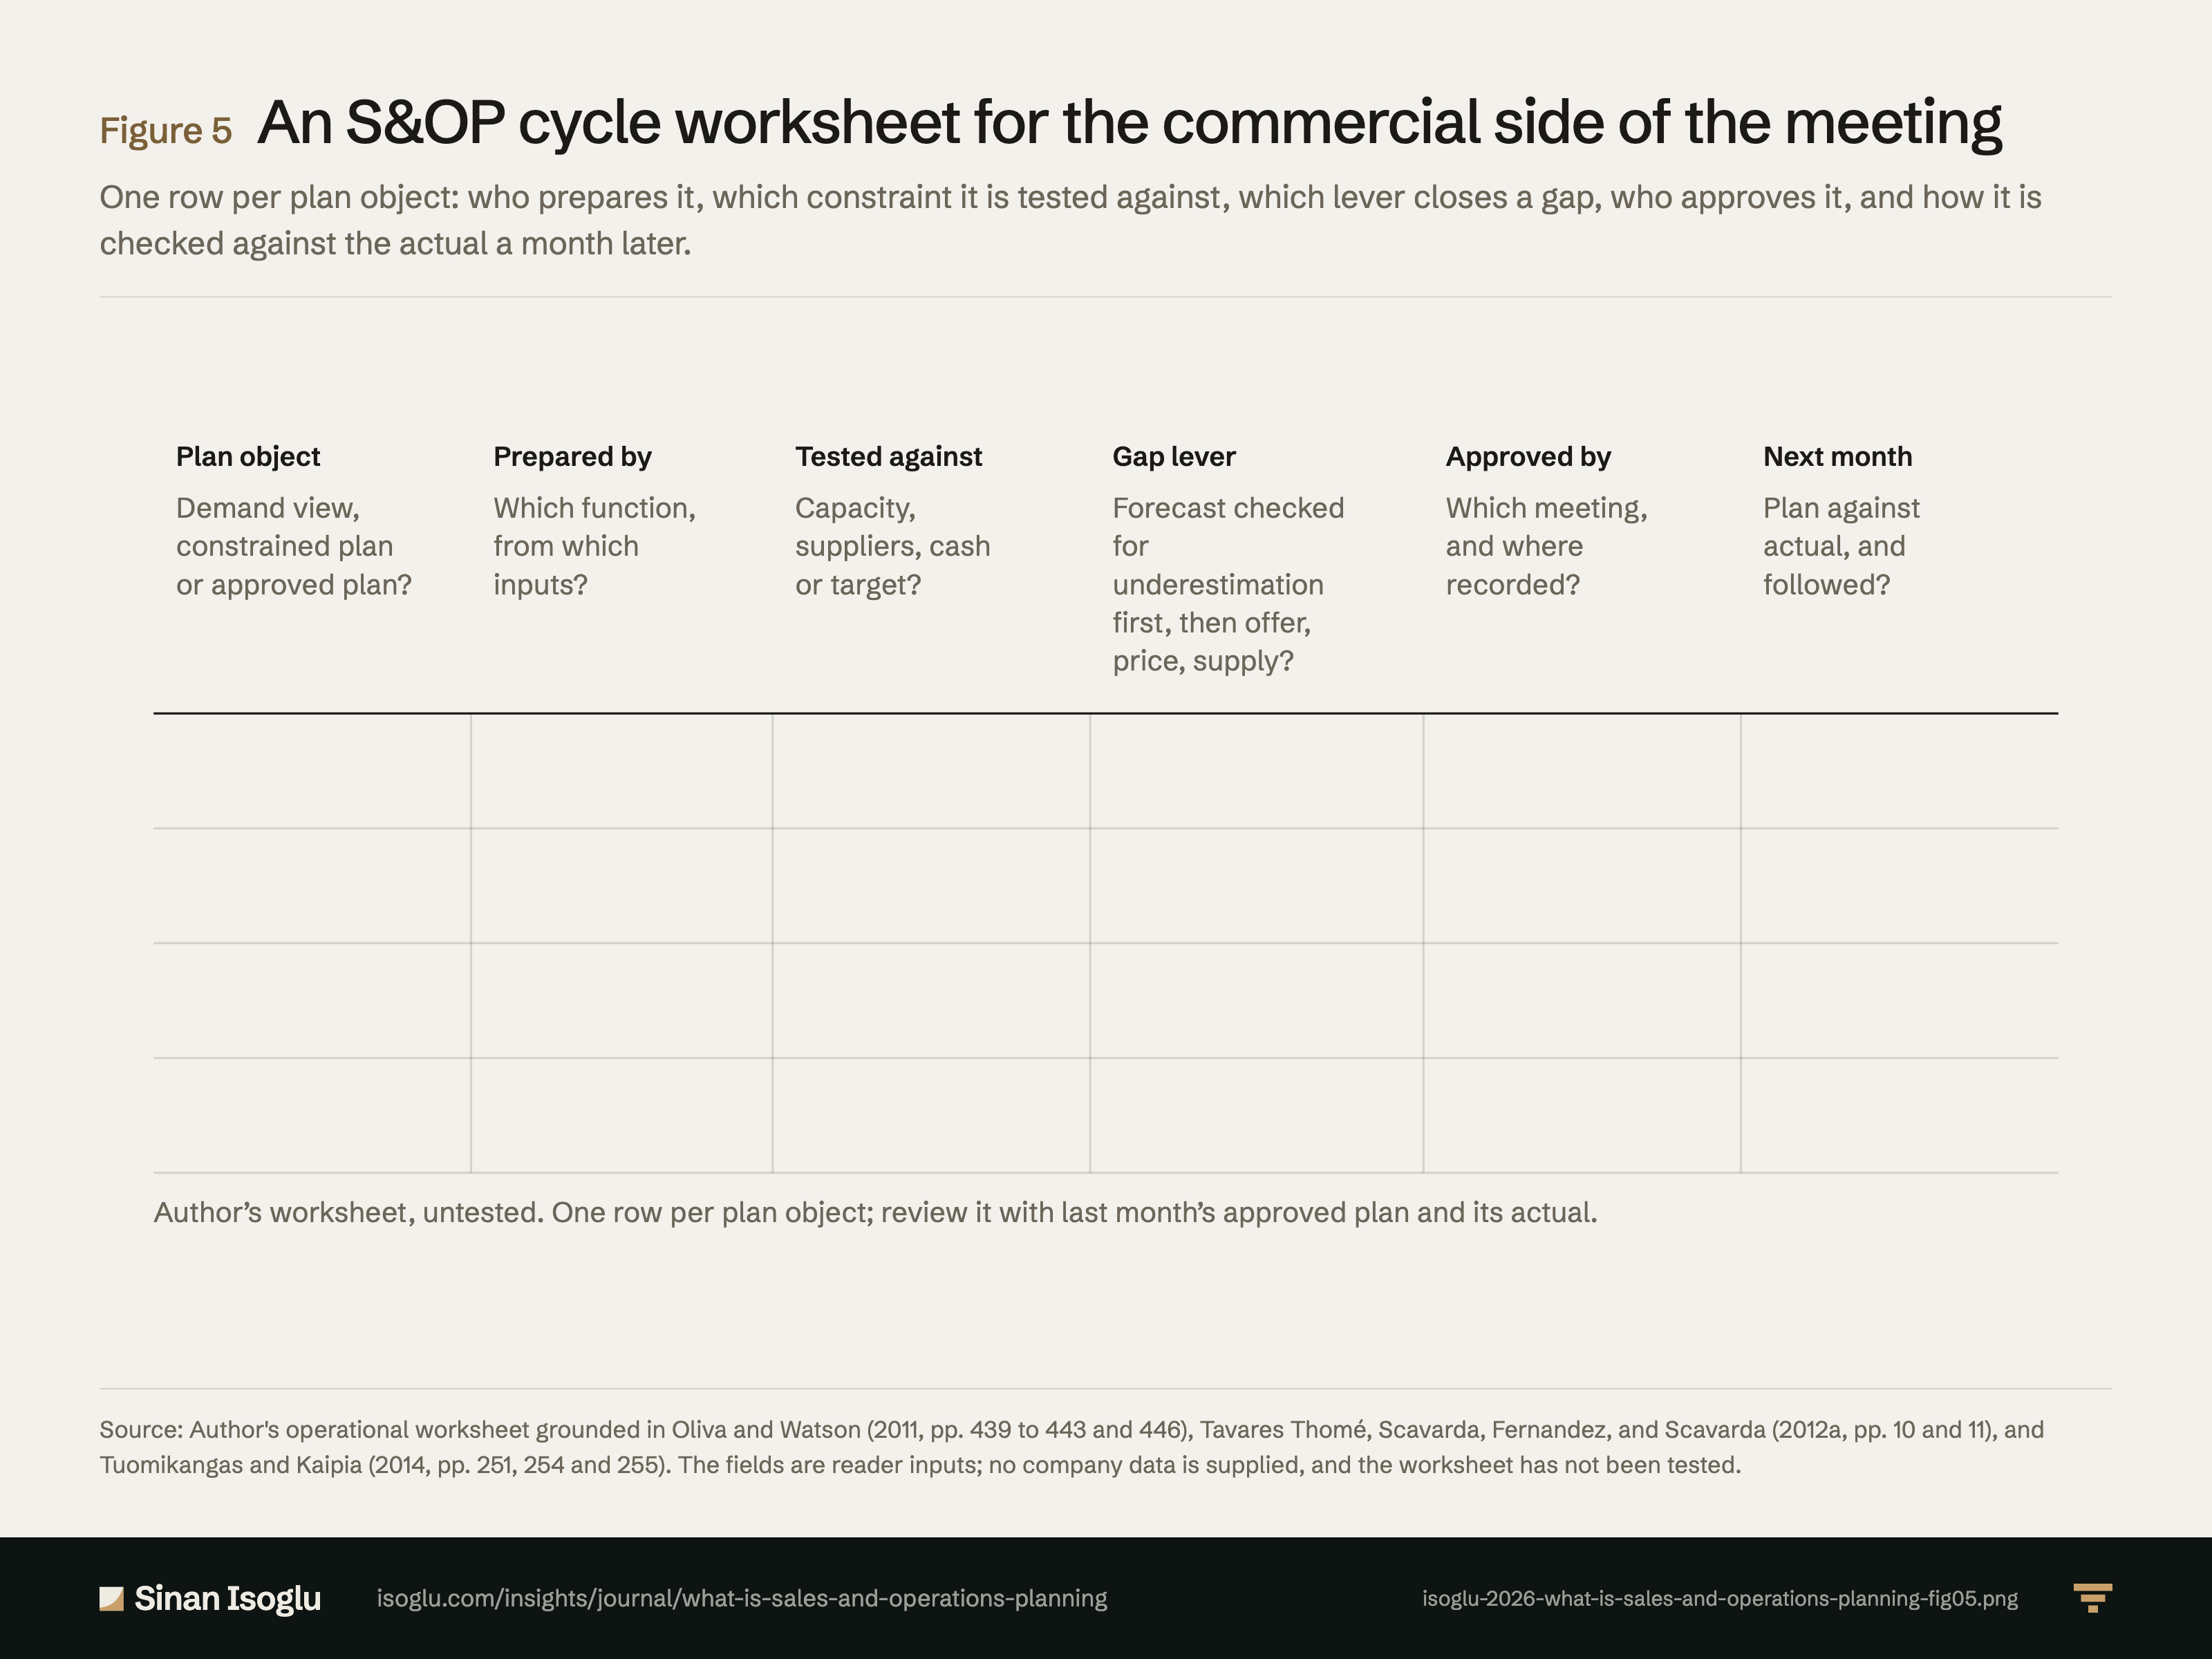
Figure 5Figure
An S&OP cycle worksheet for the commercial side of the meeting
What is sales and operations planning (S&OP)?
Contact
Bring the question you're working on.
Research, a guest lecture, or a commercial question.