Abbildung 3Aus „Was ist Sales and Operations Planning (S&OP)?“
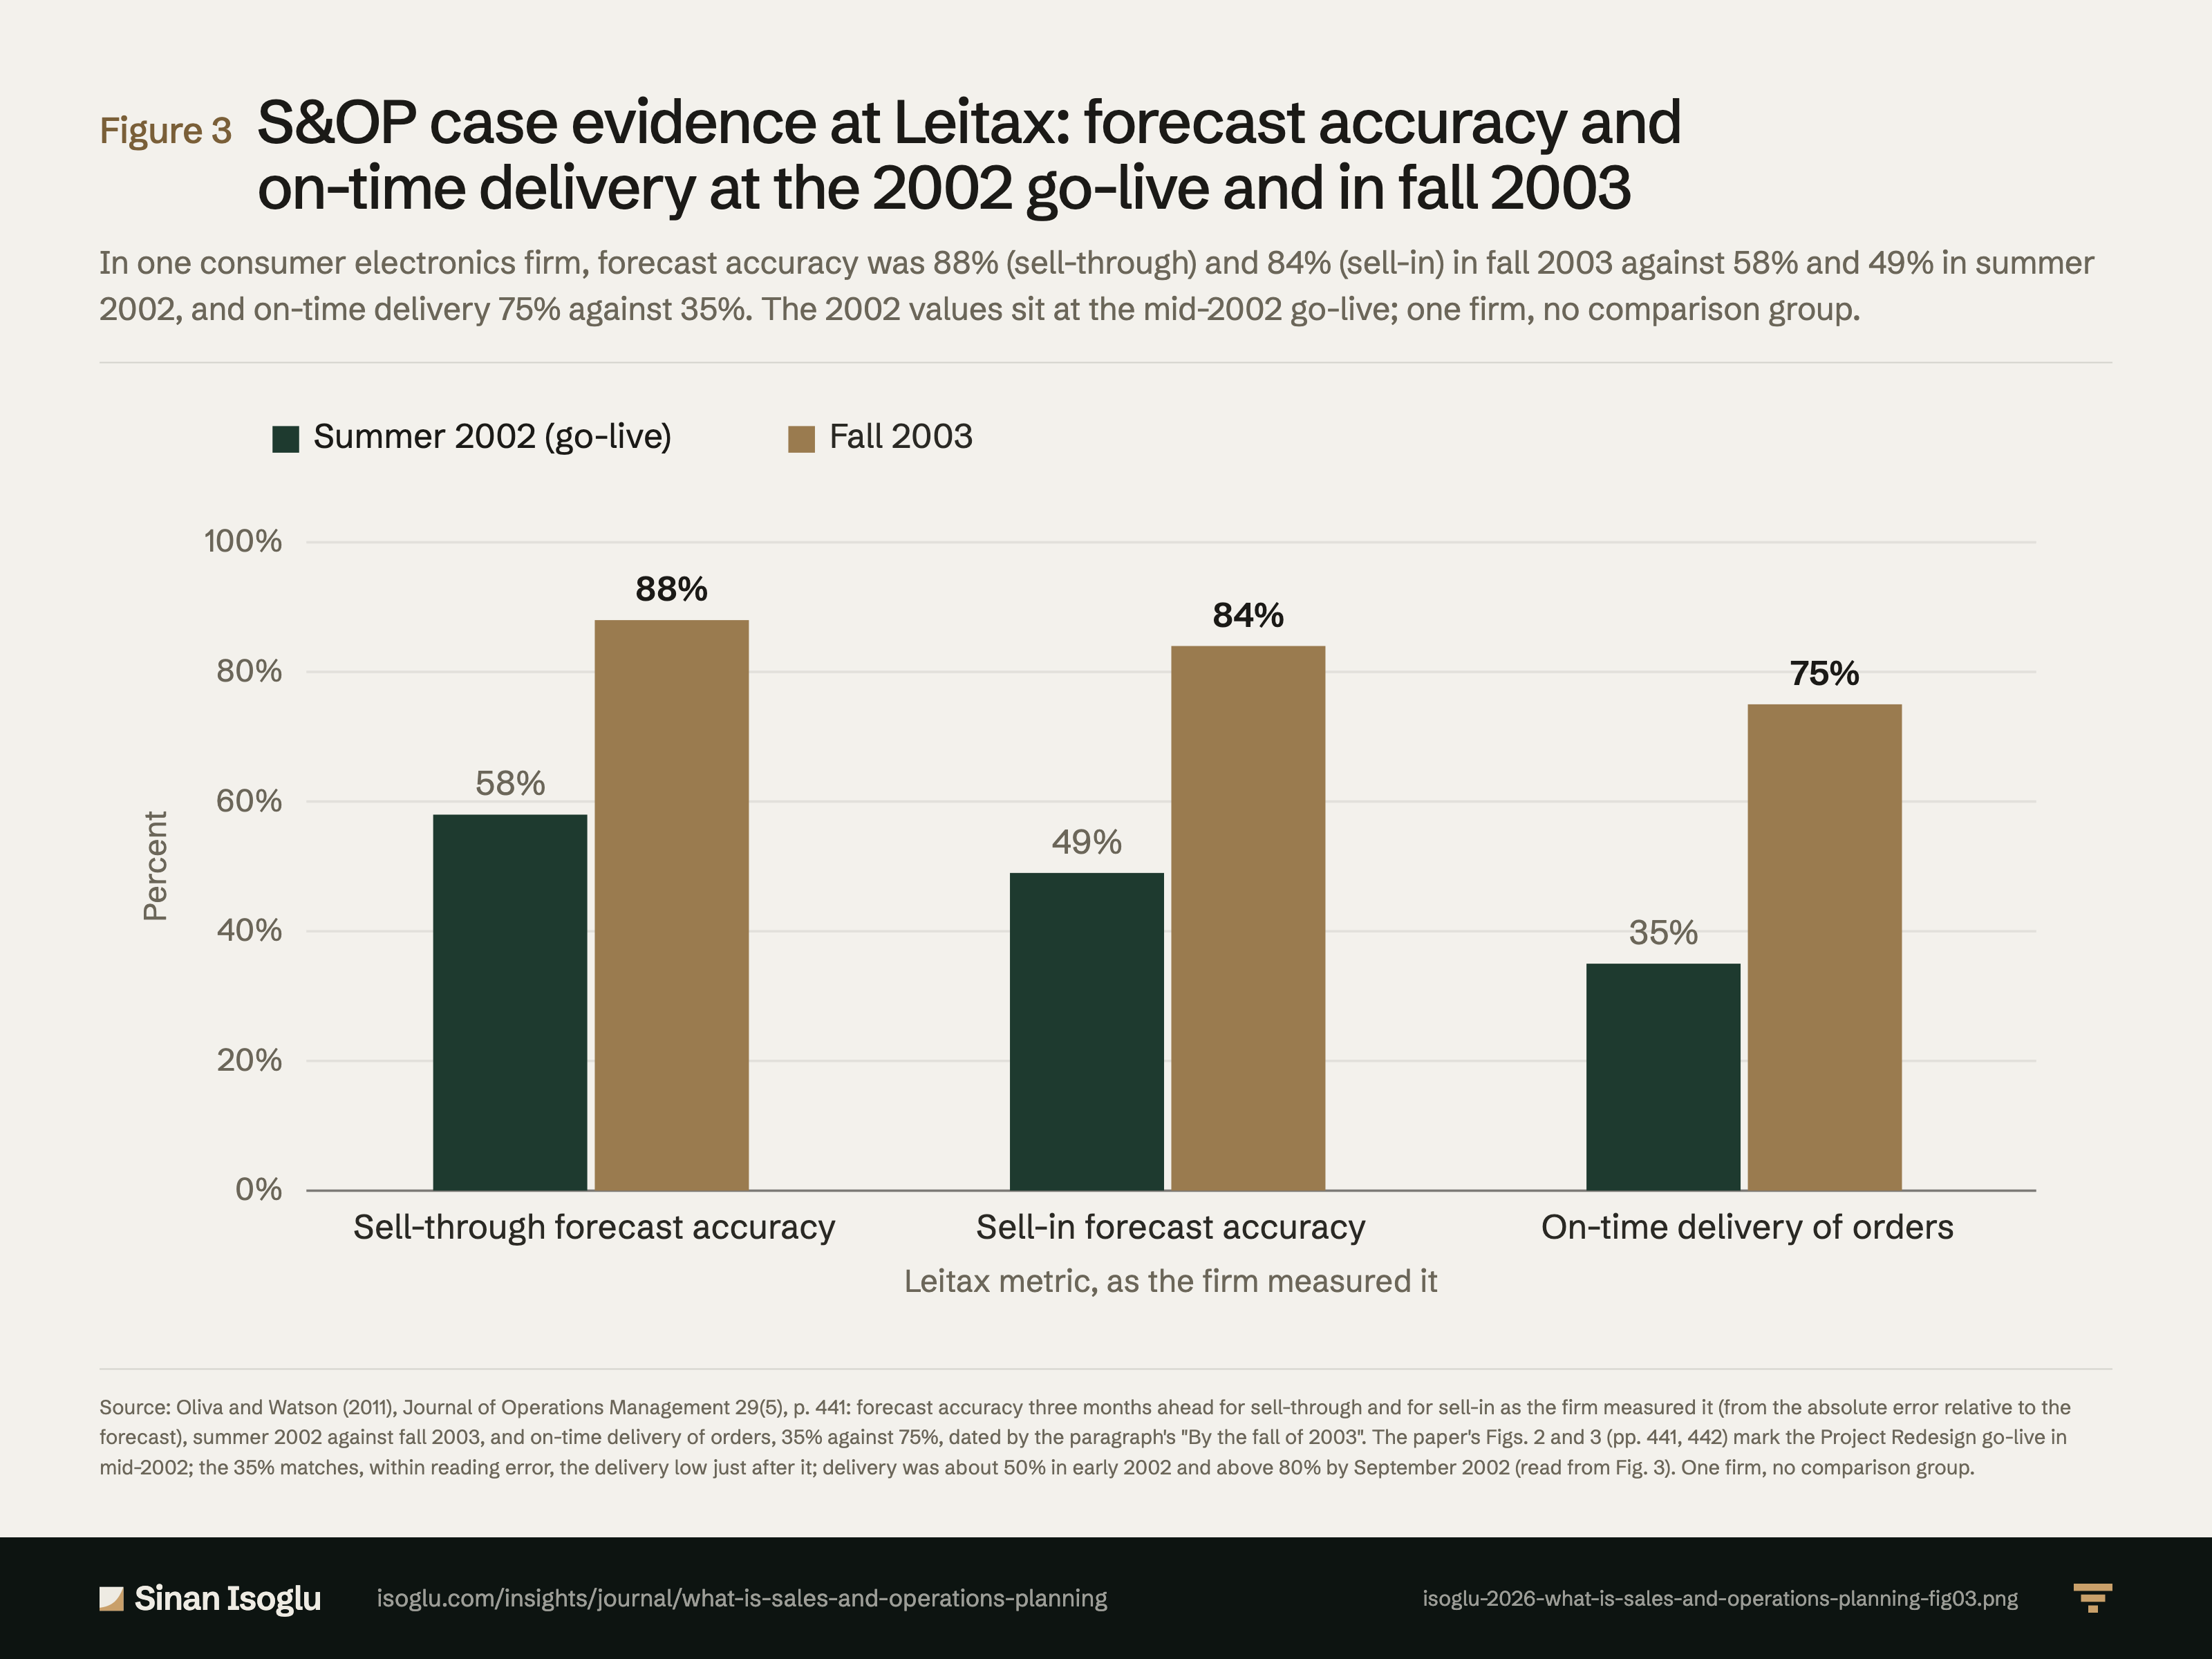
S&OP-Fallevidenz bei Leitax: Prognosegenauigkeit und Liefertreue zum Start 2002 und im Herbst 2003
Bei einem Hersteller von Unterhaltungselektronik lag die Prognosegenauigkeit im Herbst 2003 bei 88 Prozent (Sell-through) und 84 Prozent (Sell-in) gegenüber 58 und 49 Prozent im Sommer 2002, die Liefertreue bei 75 gegenüber 35 Prozent. Die Werte von 2002 liegen am Start Mitte 2002; ein Unternehmen, keine Vergleichsgruppe.
Abbildung 3S&OP-Fallevidenz bei Leitax: Prognosegenauigkeit und Liefertreue zum Start 2002 und im Herbst 2003
Quelle: Oliva und Watson (2011), Journal of Operations Management 29(5), S. 441: Prognosegenauigkeit drei Monate im Voraus für Sell-through und für Sell-in, wie das Unternehmen sie maß (über den absoluten Fehler im Verhältnis zur Prognose), Sommer 2002 gegen Herbst 2003, sowie Liefertreue, 35 gegen 75 Prozent, datiert durch die Angabe des Absatzes zum Herbst 2003. Abb. 2 und 3 des Aufsatzes (S. 441, 442) markieren den Start des Projekts Redesign Mitte 2002; die 35 Prozent entsprechen im Rahmen der Ablesegenauigkeit dem Tiefstand kurz danach; Anfang 2002 lag die Liefertreue bei etwa 50 Prozent, im September 2002 über 80 Prozent (nach Abb. 3 abgelesen). Ein Unternehmen, keine Vergleichsgruppe.
Quelle und Evidenz
Jede Zeile nennt eine Aussage zu dieser Abbildung, ihre Quelle und die Art ihrer Prüfung.
- A A gegen die gedruckte Seite der Primärquelle geprüftB Primärquelle, nur TextebeneC belastbare SekundärquelleD berichtet Operating figures in fall 2003 against values at the mid-2002 go-live: forecast accuracy three months ahead 88% sell-through and 84% sell-in, up from 58% and 49% in summer 2002; inventory turns 26 in Q4 2003, up from 12 a year earlier; average on-hand inventory $23 million, down from $55 million; on-time delivery 75%, up from 35% (the earlier level matches, within reading error, the post-go-live low in Fig. 3, p. 442); excess and obsolescence costs practically zero in FY 2003 against an average of $3 million in FY 2000–2002; meetings down to two to four hours (p. 441): "Three-months-ahead forecast accuracy (ABS[sales-forecast]/forecast) for sell-through (sell-in) was 88% (84%)"; "up from 58% (49%) in the summer of 2002"; "inventory turns in Q4’03 were 26 (up from 12 the previous year), average on-hand inventory was $23 million (down from $55 million)"; "on-time delivery of orders was 75% (up from 35%)"; "Excess and obsolescence costs were practically zero in fiscal year 2003 (down from an average of $3 million for fiscal years 2000–2002)."; "by the fall of 2003 the meetings were lasting between two and four hours and conversations were cordial". One firm, two dates around a go-live, no comparison group.Oliva & Watson (2011)
- A A gegen die gedruckte Seite der Primärquelle geprüftB Primärquelle, nur TextebeneC belastbare SekundärquelleD berichtet The authors' own limits: unobserved implementation dynamics, improved forecasting methodology and better management cannot be separated; forecasting performance and adherence to plans cannot be separated; the propositions are untested beyond one case (pp. 435, 437, 442, 446): "Although unobserved dynamics during the implementation of the changes in the organization could have influenced operational improvement"; "did not make clear whether performance and forecast accuracy improved solely because of the improved forecasting methodology, or also because the whole organization was being more effectively managed through a coordinated integration effort"; "In fact, during our analysis of the forecasting process, we found it difficult to determine whether the current performance in forecast accuracy was the result of the forecasting processes or of better adherence to the agreed plans."; "Finally, determining when our propositions hold remains an open research question, beyond the scope of a single case study." Repair 2026-11-13: the p. 435 span is quoted from "unobserved": "unobserved dynamics during the implementation of the changes in the organization could have influenced operational improvement".Oliva & Watson (2011)
- B A gegen die gedruckte Seite der Primärquelle geprüftB Primärquelle, nur TextebeneC belastbare SekundärquelleD berichtet The redesign's go-live and the on-time delivery path, read from the paper's charts (not stated in the text): Fig. 3 (p. 442, PDF p. 9, rendered) marks the chart label Project Redesign Go-Live at about June 2002; on-time delivery was about 50% in February 2002, about 33% in July 2002 (matching, within reading error, the 35% the text reports), about 83% in September 2002, and between about 67% and 89% from October 2002 to November 2003; Fig. 2 (p. 441, PDF p. 8) marks the go-live in the firm's Q4'02, the quarter of the 12 the previous year turns and the $55 million inventory. Values are chart readings to the nearest few points; the chart labels are not in the PDF text layer. The text's own figures, which the chart readings must agree with (p. 441): "inventory turns in Q4’03 were 26 (up from 12 the previous year)"; "on-time delivery of orders was 75% (up from 35%) (see Fig. 3)".Oliva & Watson (2011)
Aus dem Beitrag
Revenue Operations & KI
Was ist Sales and Operations Planning (S&OP)?
In S&OP beschließen Vertrieb, Operations und Finanzen mindestens monatlich aus einer Nachfragesicht ohne Kapazitätsgrenzen einen lieferbaren Plan.
Den Beitrag lesenDiese Abbildung gehört zu einem Essay: Die Zahlen stehen hier, das Argument dort.
Zitieren oder einbetten
Verwandte Abbildungen
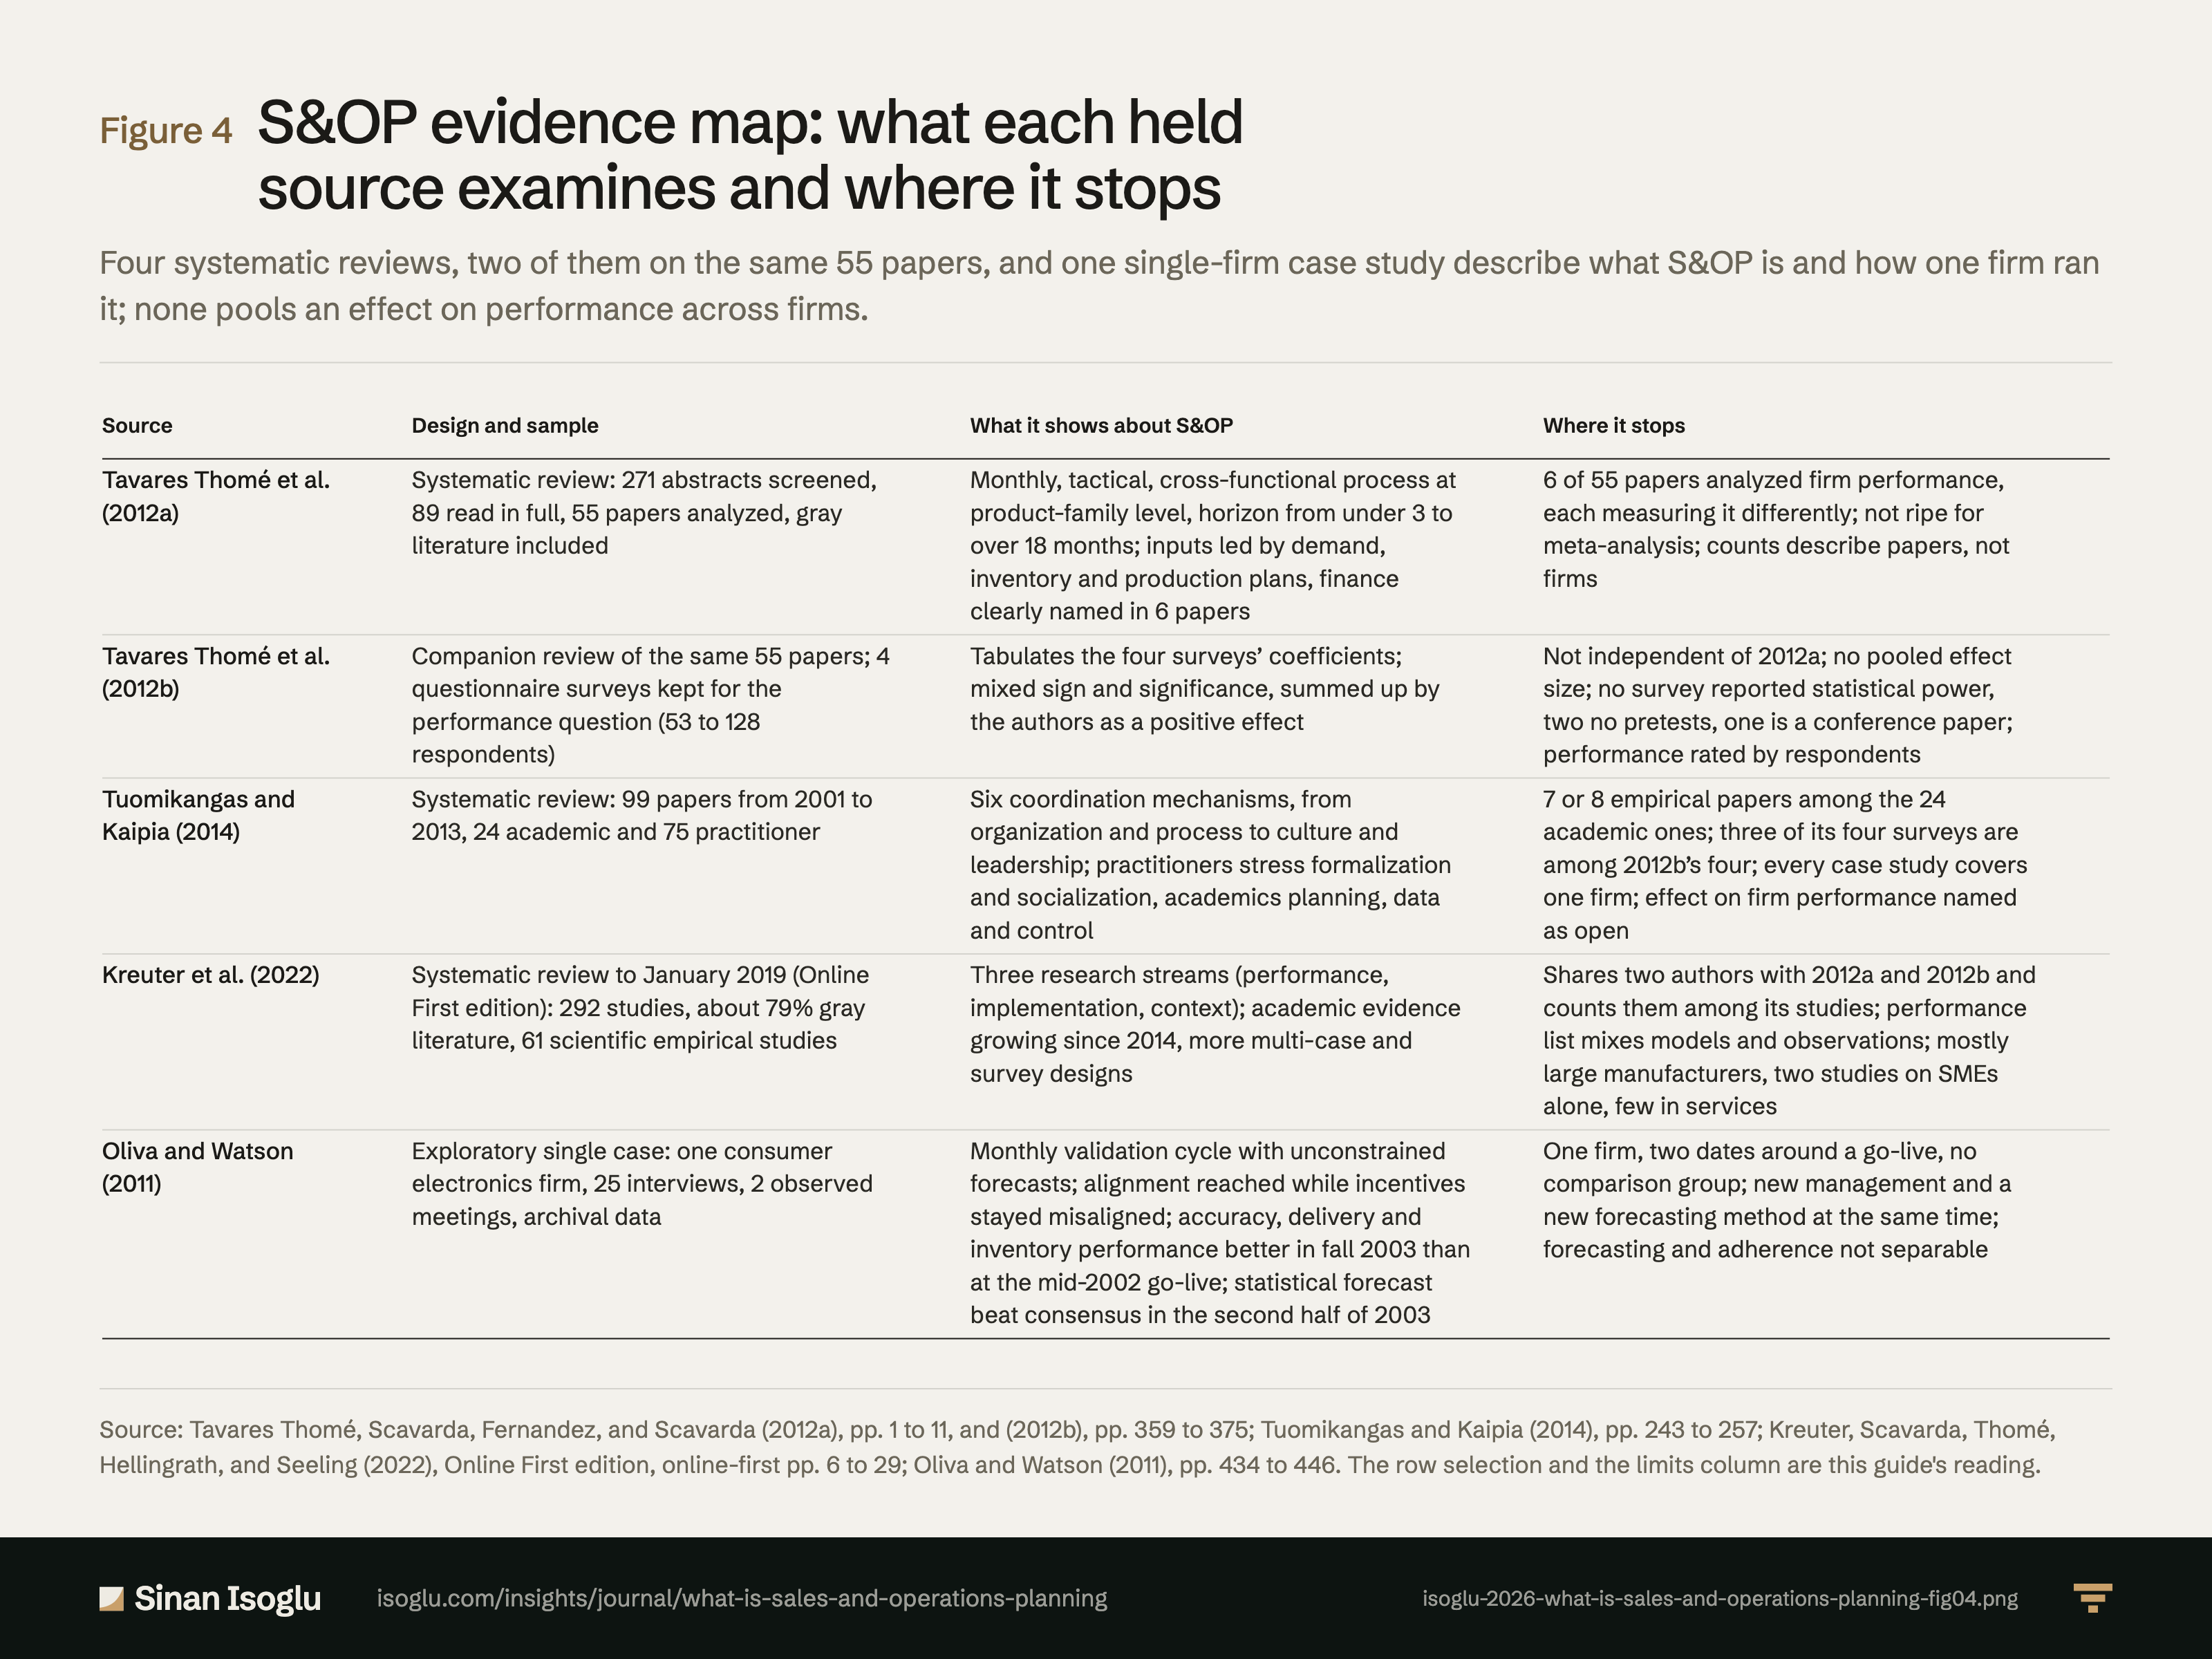
Abbildung 4Grafik
S&OP-Evidenzkarte: was jede vorliegende Quelle untersucht und wo sie endet
Was ist Sales and Operations Planning (S&OP)?
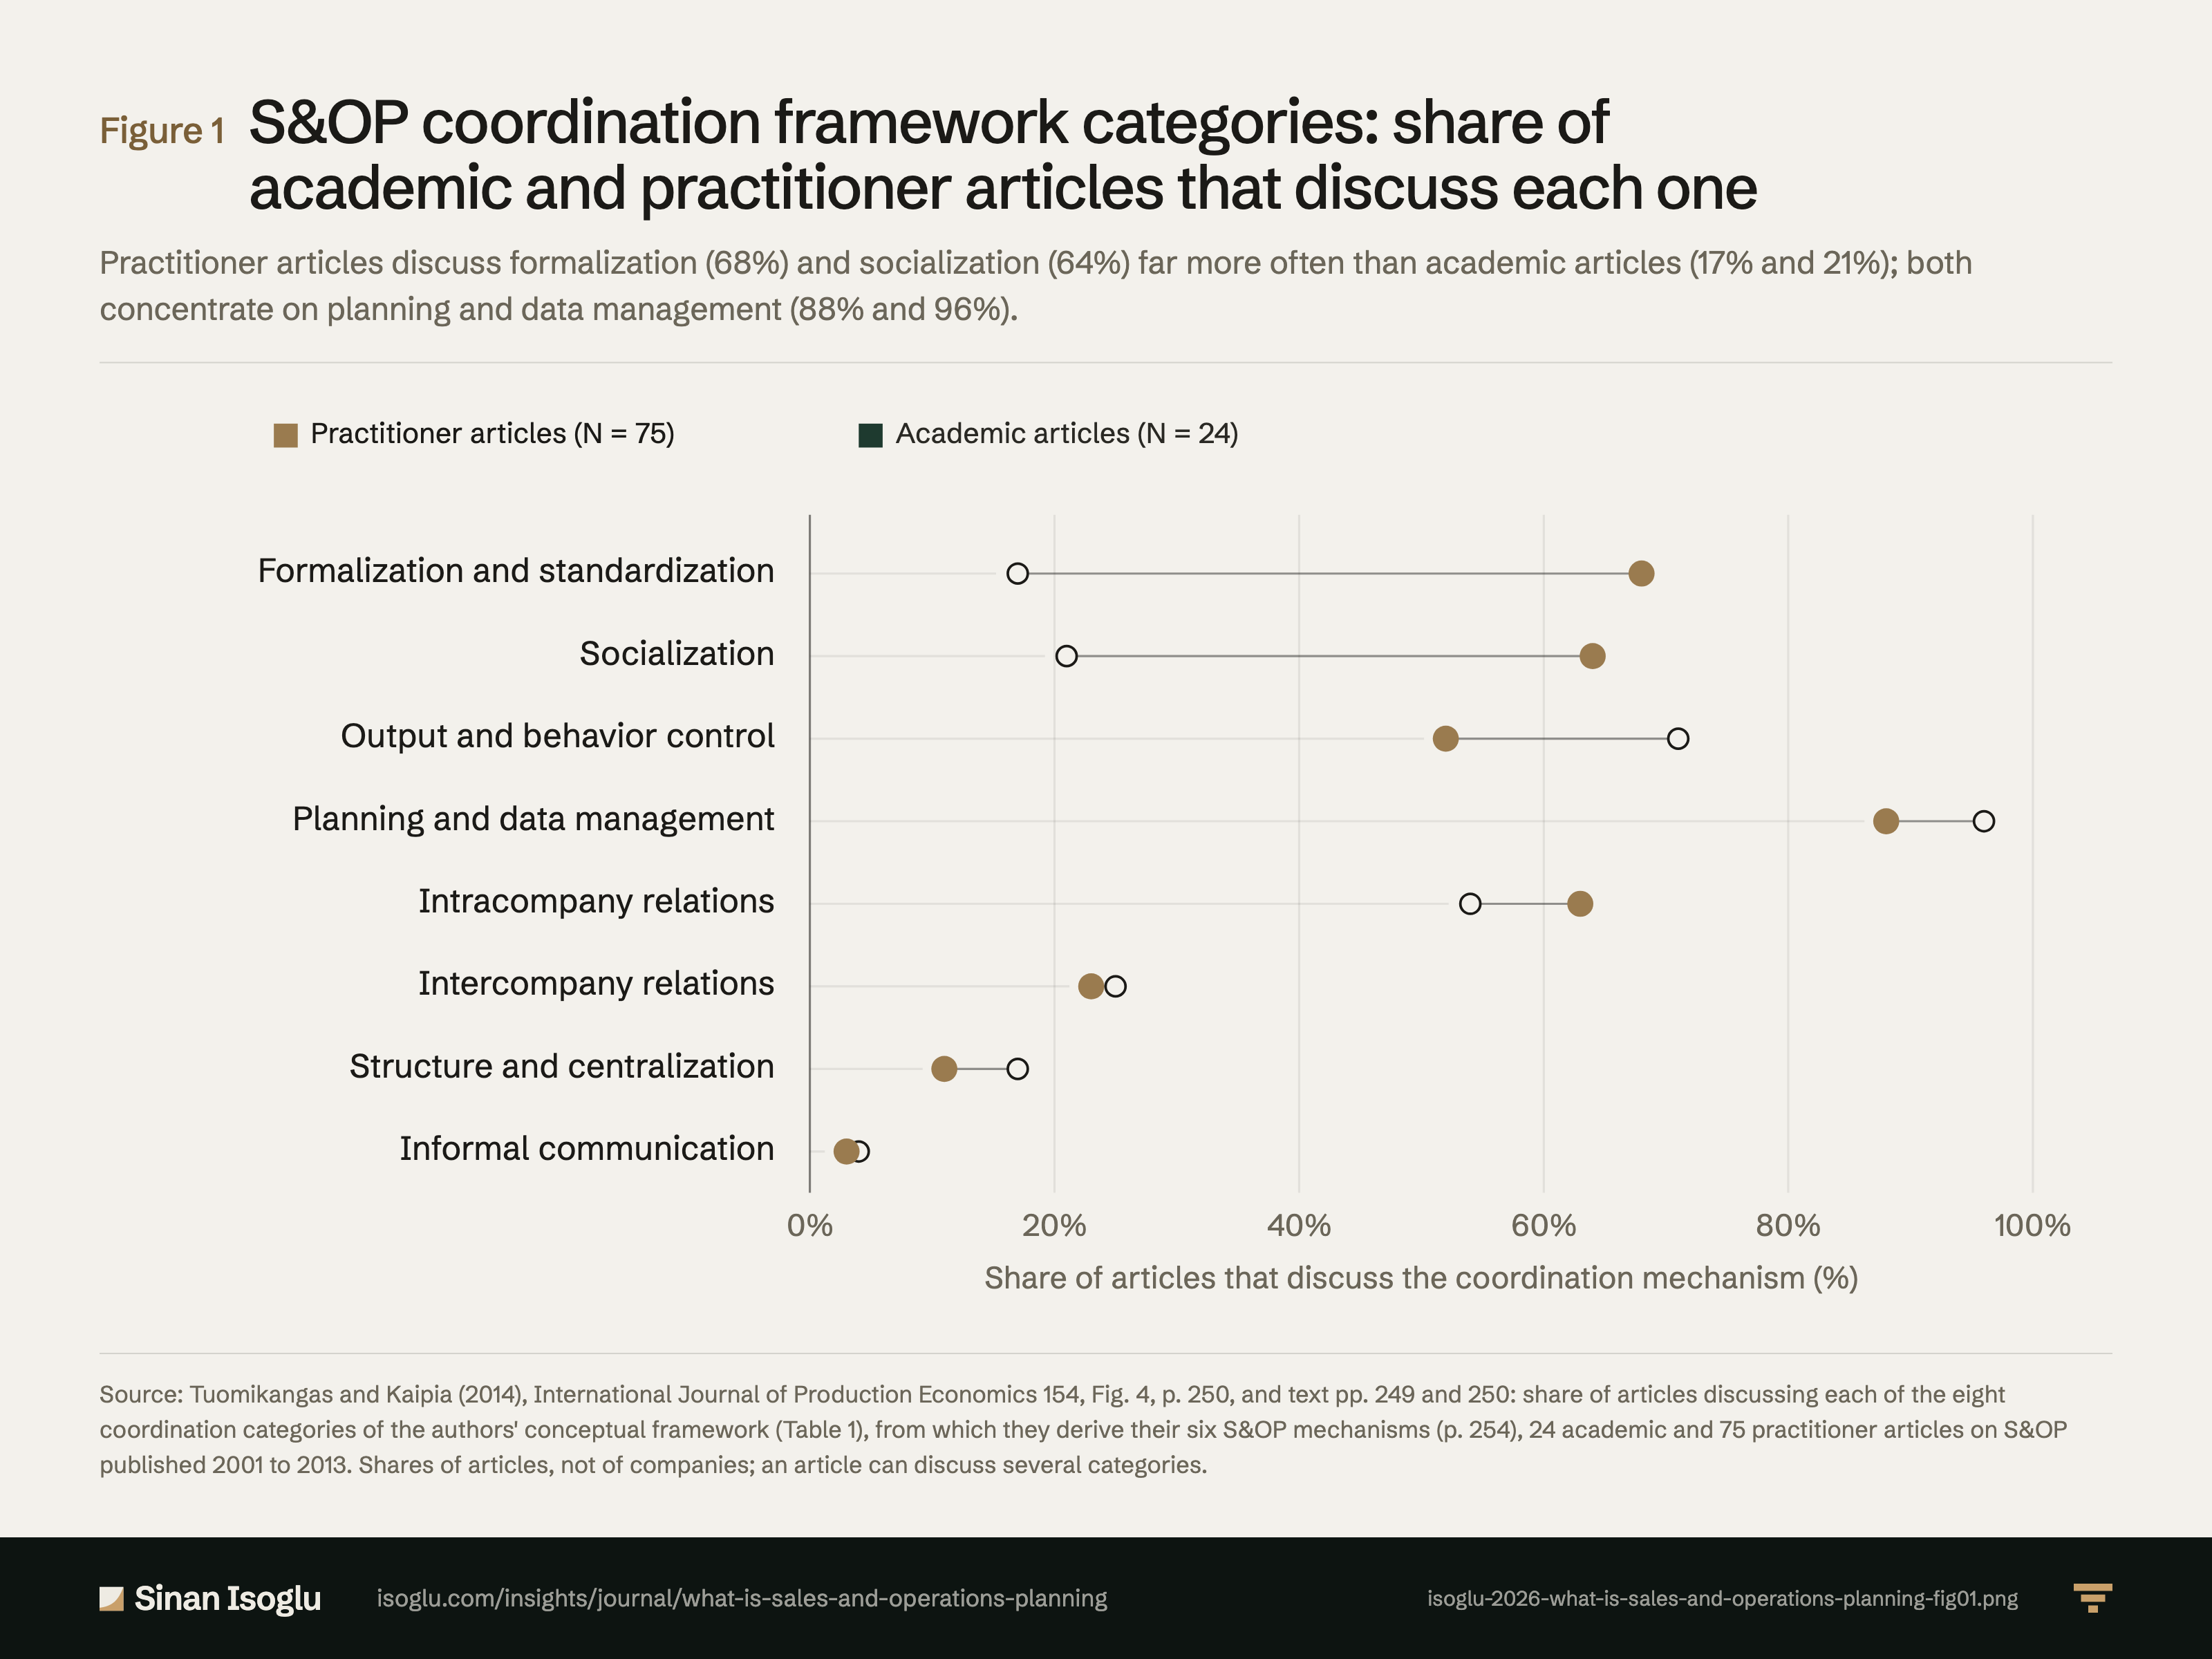
Abbildung 1Grafik
S&OP-Koordinationskategorien: Anteil wissenschaftlicher und praxisorientierter Artikel, die jede behandeln
Was ist Sales and Operations Planning (S&OP)?
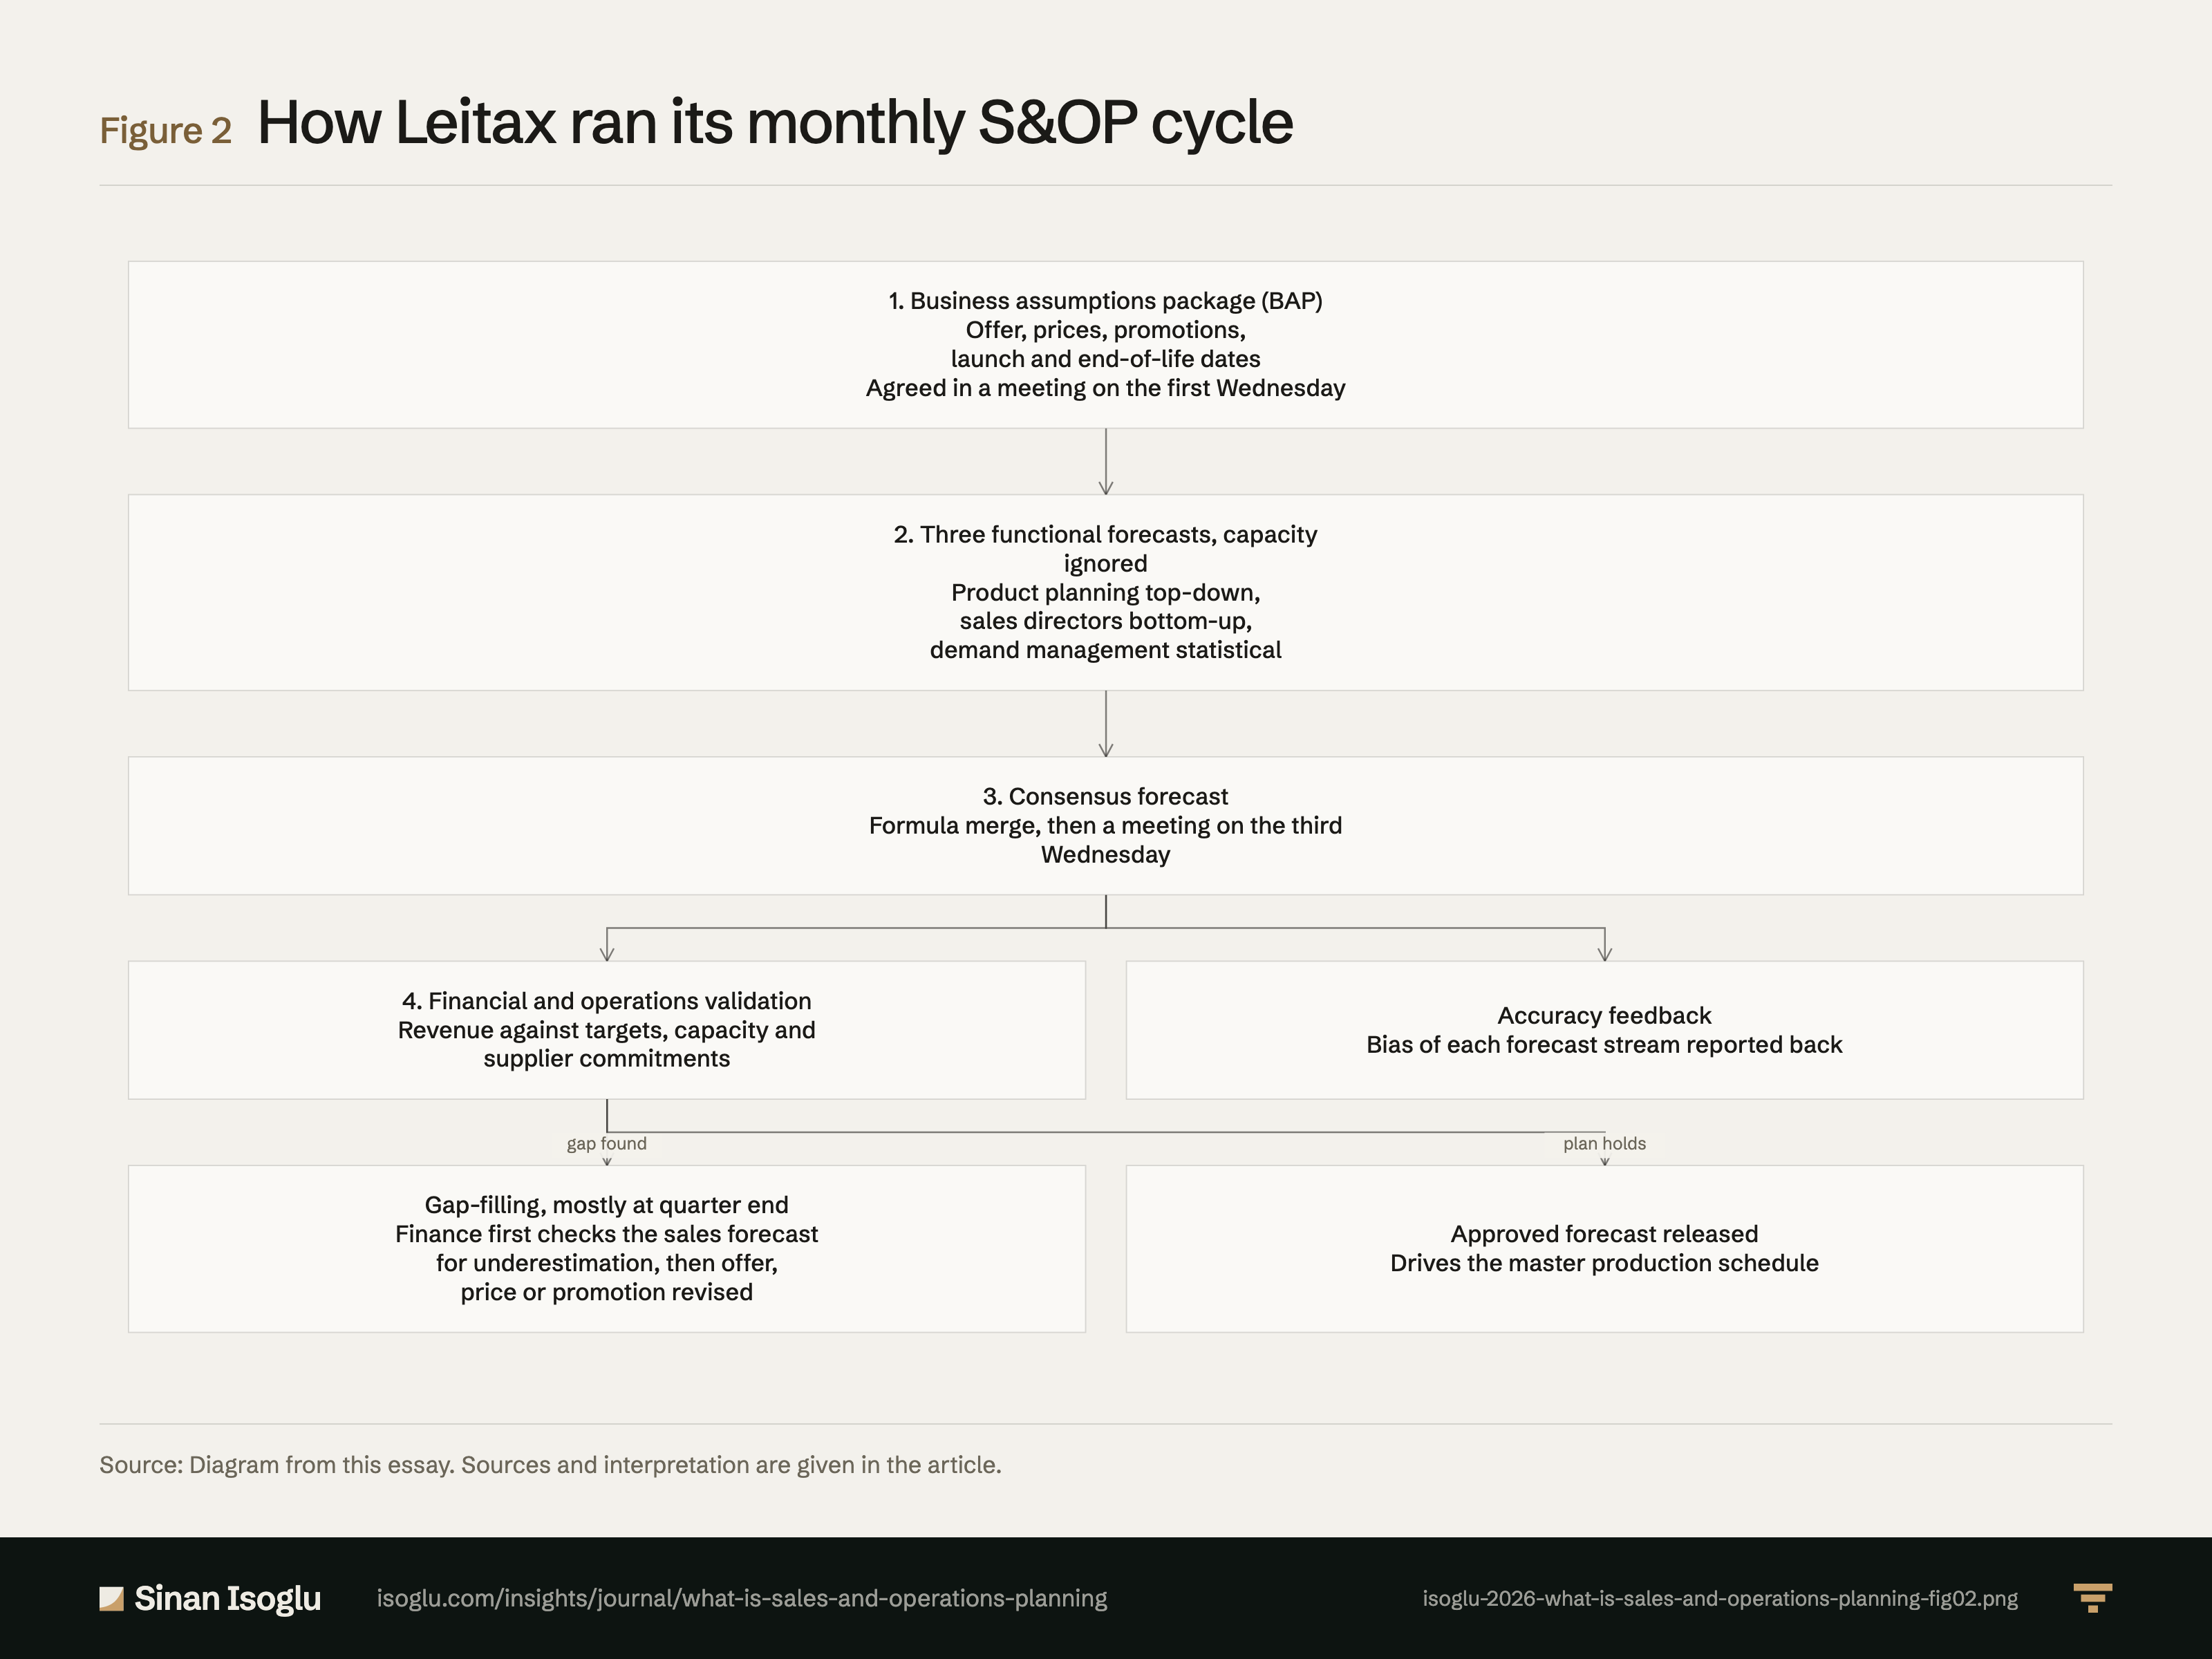
Abbildung 2Grafik
Wie Leitax seinen monatlichen S&OP-Zyklus organisierte
Was ist Sales and Operations Planning (S&OP)?
Kontakt
Schicken Sie die Frage, an der Sie arbeiten.
Forschung, ein Gastvortrag oder eine Frage aus der Praxis.