← Every exhibit
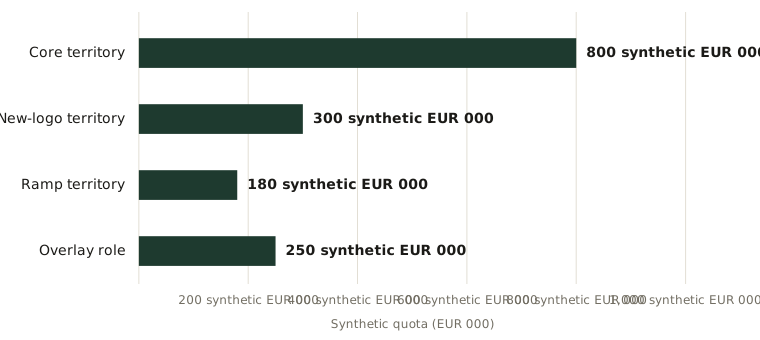
The synthetic capacity-to-quota comparison
A quota is reviewable when role time, opportunity capacity, realized value, period, and target construction remain visible together.
Reference & Evidence
Source: Author's synthetic quota worksheet grounded in Piercy, Cravens and Morgan (1999) and Oyer (1998). Role inputs, opportunity counts, values, and targets are illustrative, not benchmarks or company data.
Each line is a claim from the register this journal publishes against, resolved from the register at build time.
- B Quota setting translates declared strategy and capacity into a target for a named role, territory, period, ramp, and credit rule Author framework grounded in PM99-C1 and OYER98-C1 ·
V10-OWN-C1 - B Capacity, quota, attainment, forecast, and compensation are separate objects with different denominators Author taxonomy ·
V10-OWN-C2 - B Available selling time and working quota can be represented by declared role-time, non-selling-time, opportunity, yield, and value assumptions Author formula ·
V10-OWN-C3
Grades: A, verified against the printed page of the primary source · B, primary source, text layer only · C, authoritative secondary · D, reported.