Table 5From “What is activation rate? The first value event must be observable”
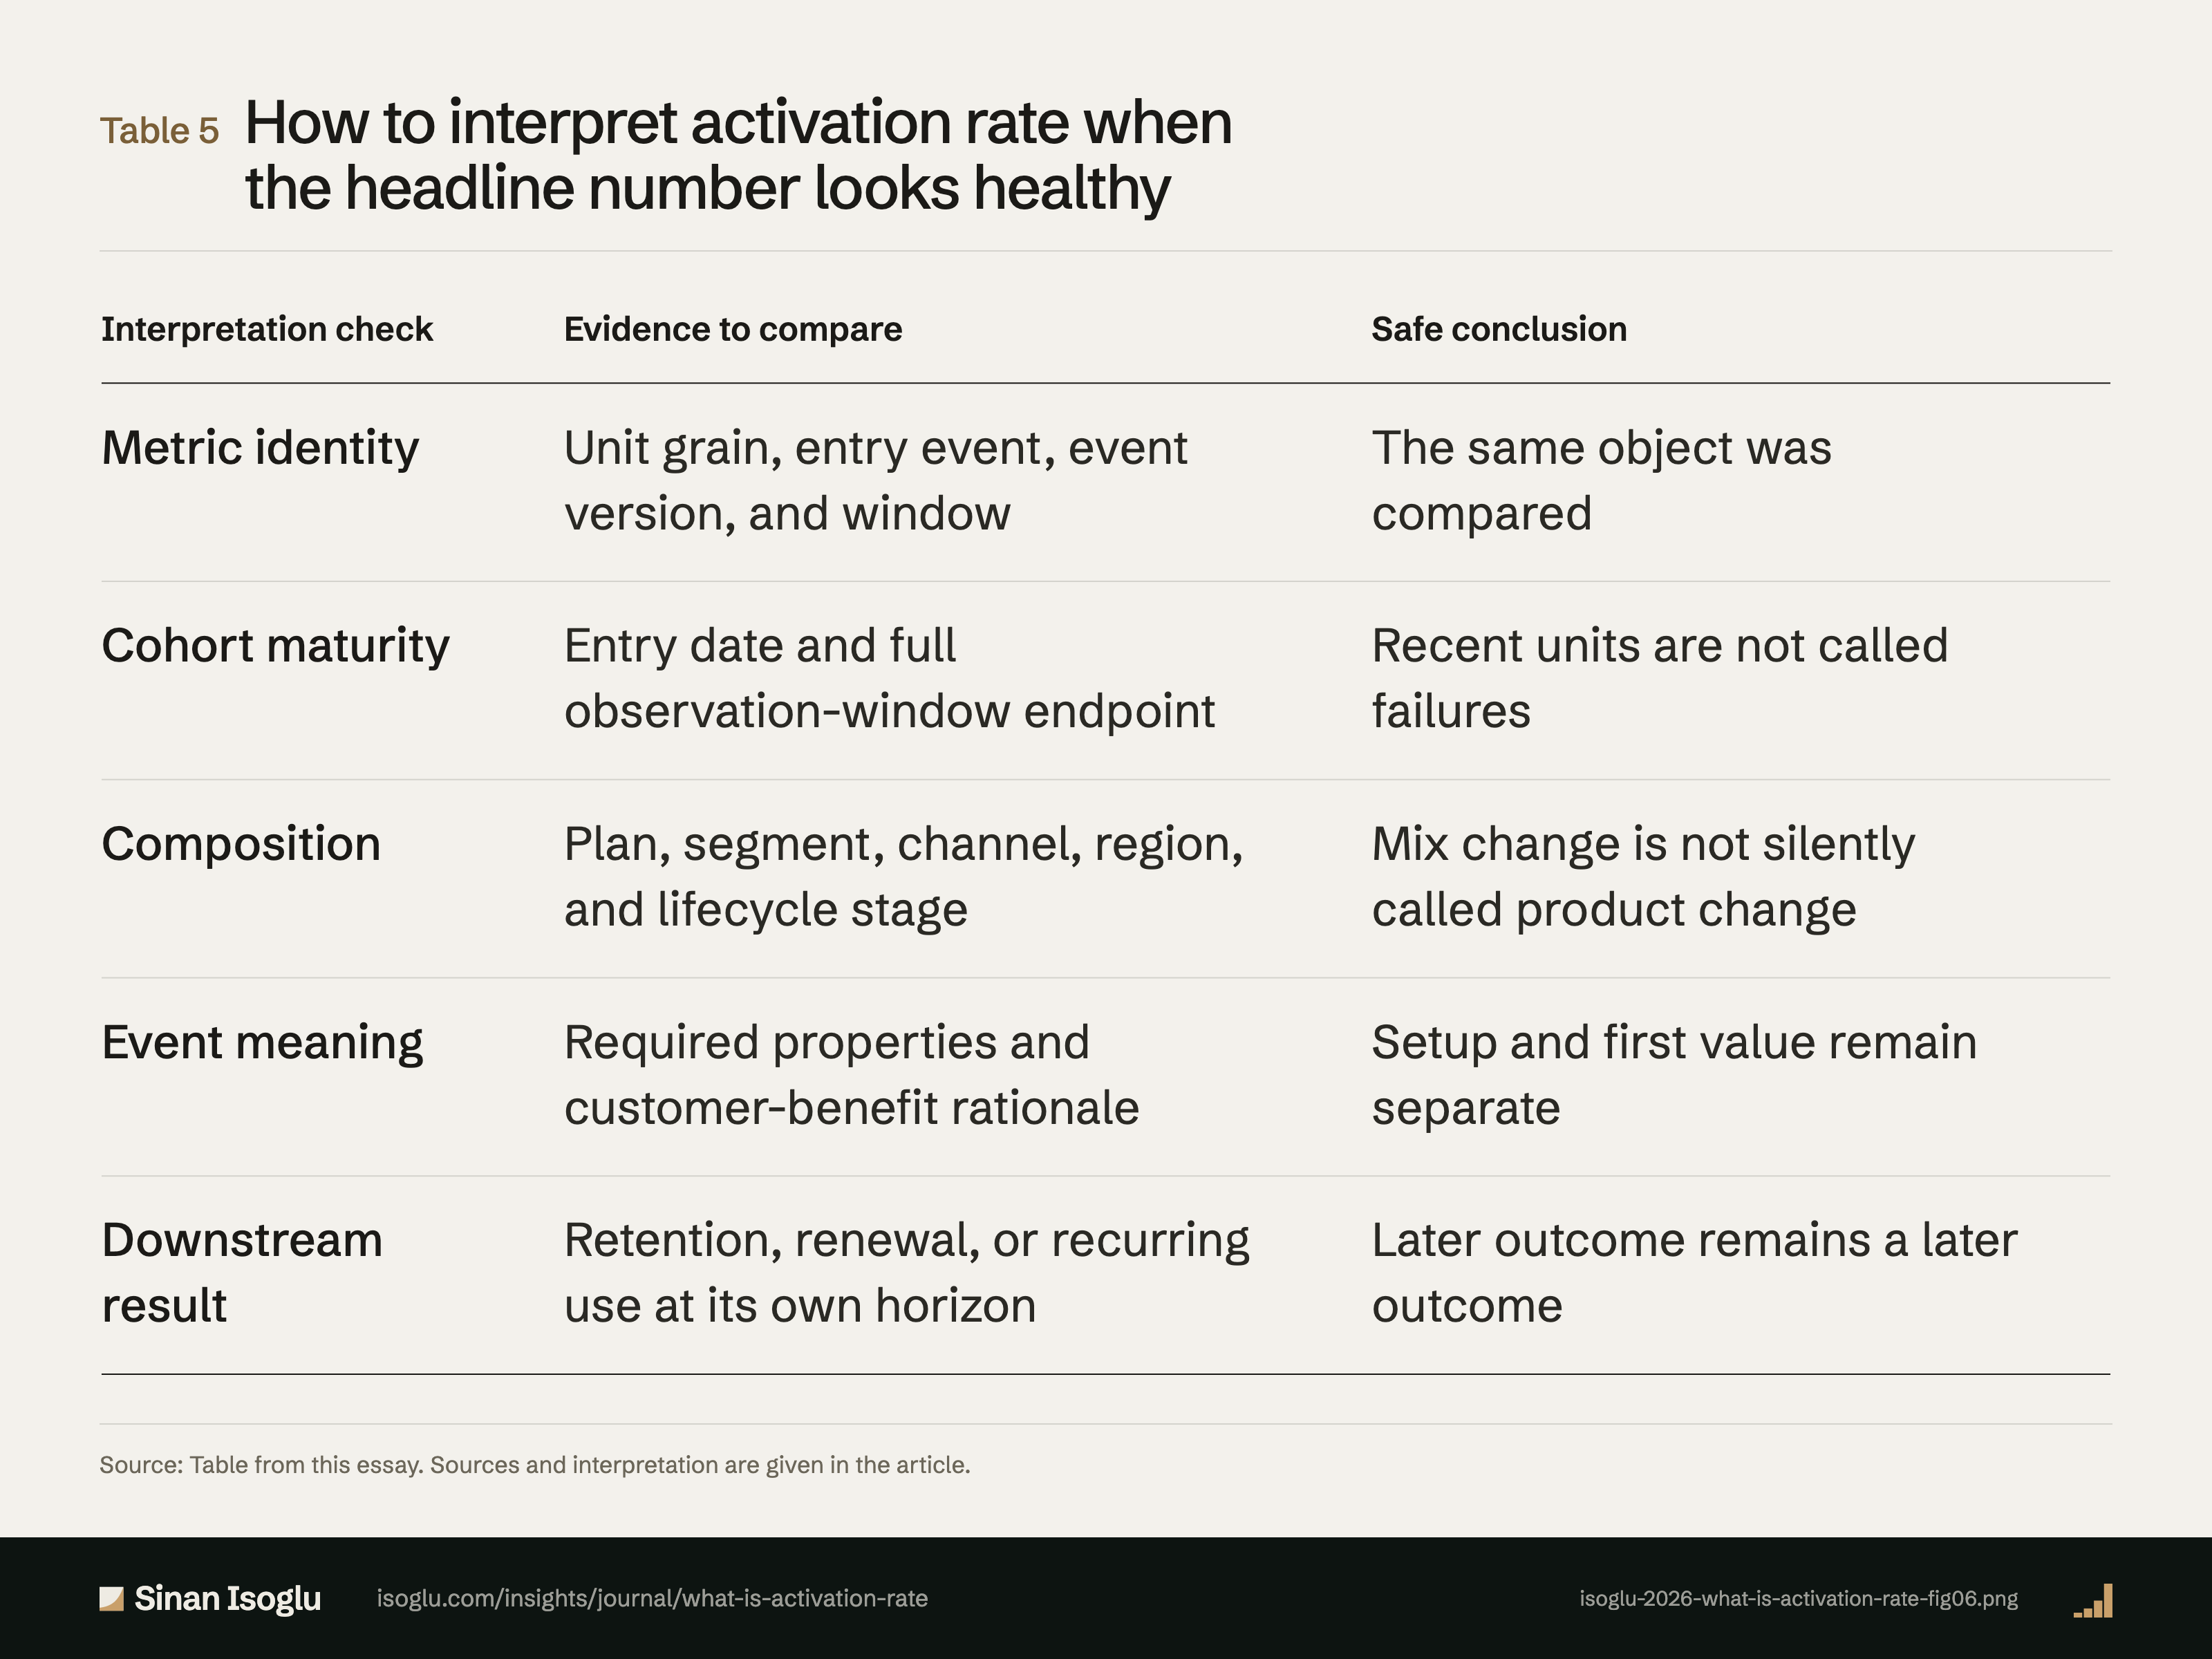
How to interpret activation rate when the headline number looks healthy
Table 5How to interpret activation rate when the headline number looks healthy
| Interpretation check | Evidence to compare | Safe conclusion |
|---|---|---|
| Metric identity | Unit grain, entry event, event version, and window | The same object was compared |
| Cohort maturity | Entry date and full observation-window endpoint | Recent units are not called failures |
| Composition | Plan, segment, channel, region, and lifecycle stage | Mix change is not silently called product change |
| Event meaning | Required properties and customer-benefit rationale | Setup and first value remain separate |
| Downstream result | Retention, renewal, or recurring use at its own horizon | Later outcome remains a later outcome |
Swipe or scroll horizontally if the table is wider than your screen.
Source: Table from this essay. Sources and interpretation are given in the article.
From the essay
Growth that compounds
What is activation rate? The first value event must be observable
Activation rate is the share of an eligible cohort reaching a declared first-value event inside a fixed window. Define the event first.
Read the essayThis exhibit belongs to an essay: the numbers live here, the argument lives there.
Cite or embed
Related exhibits
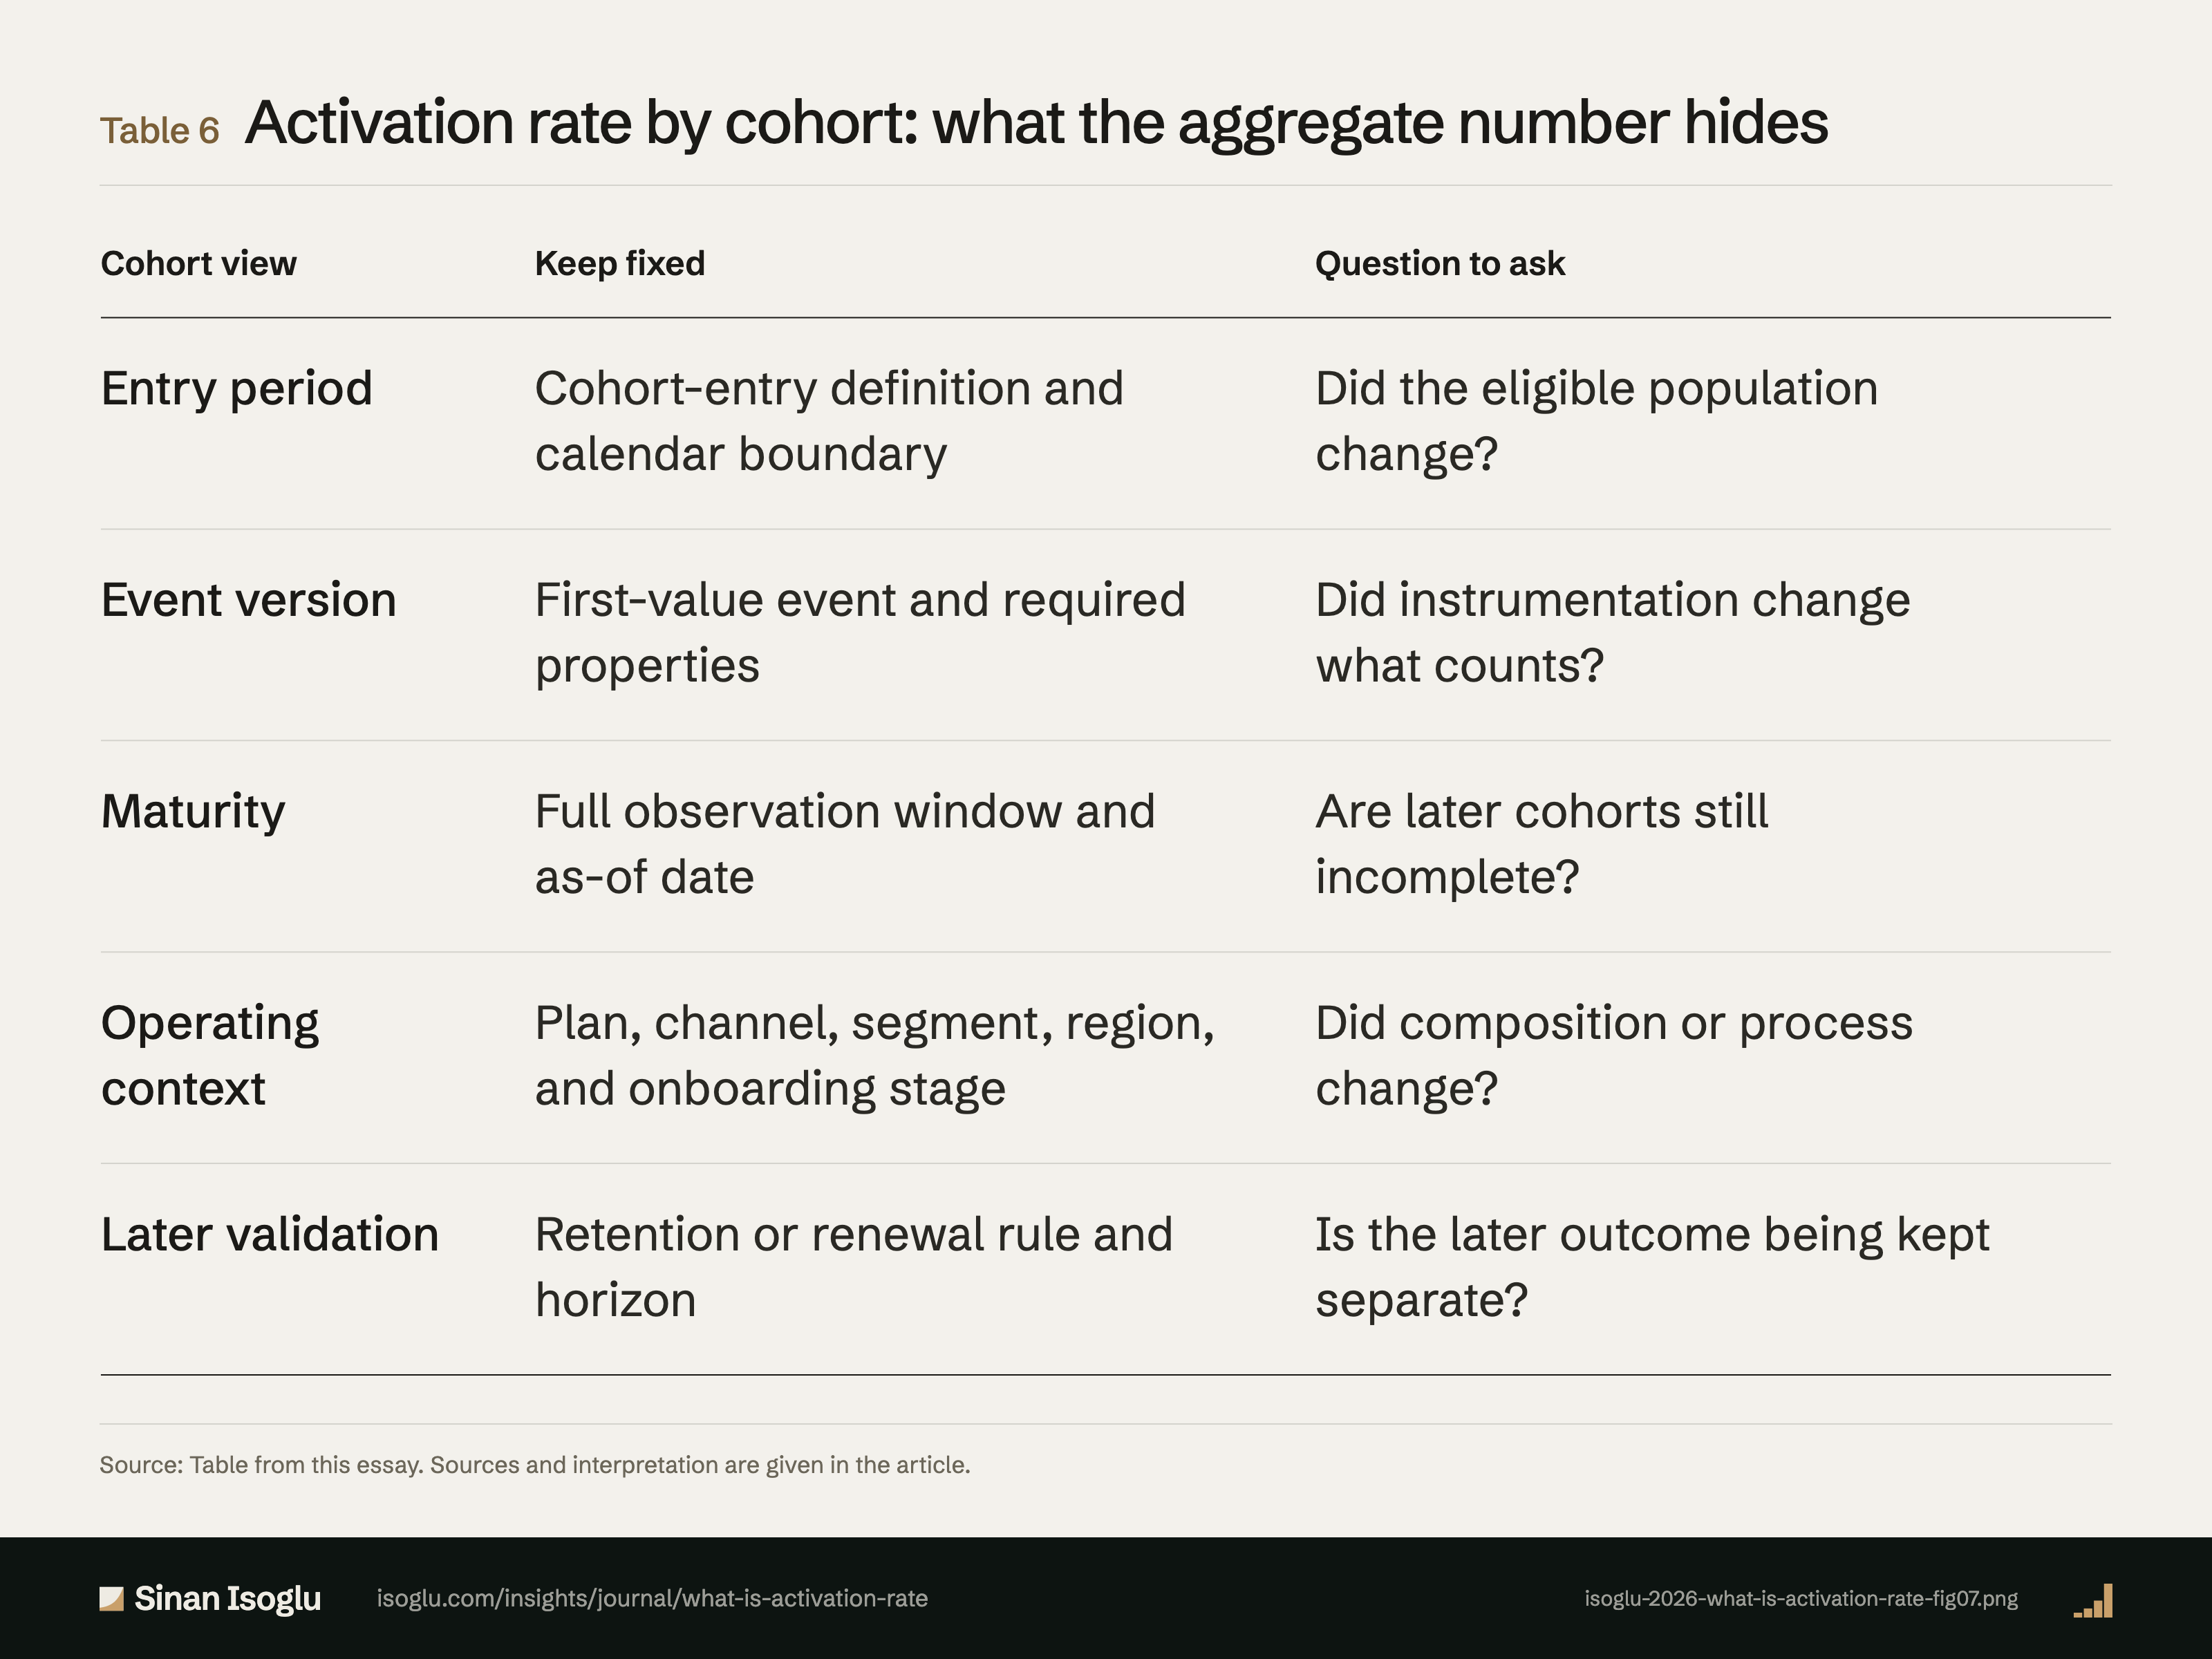
Table 6Table
Activation rate by cohort: what the aggregate number hides
What is activation rate? The first value event must be observable
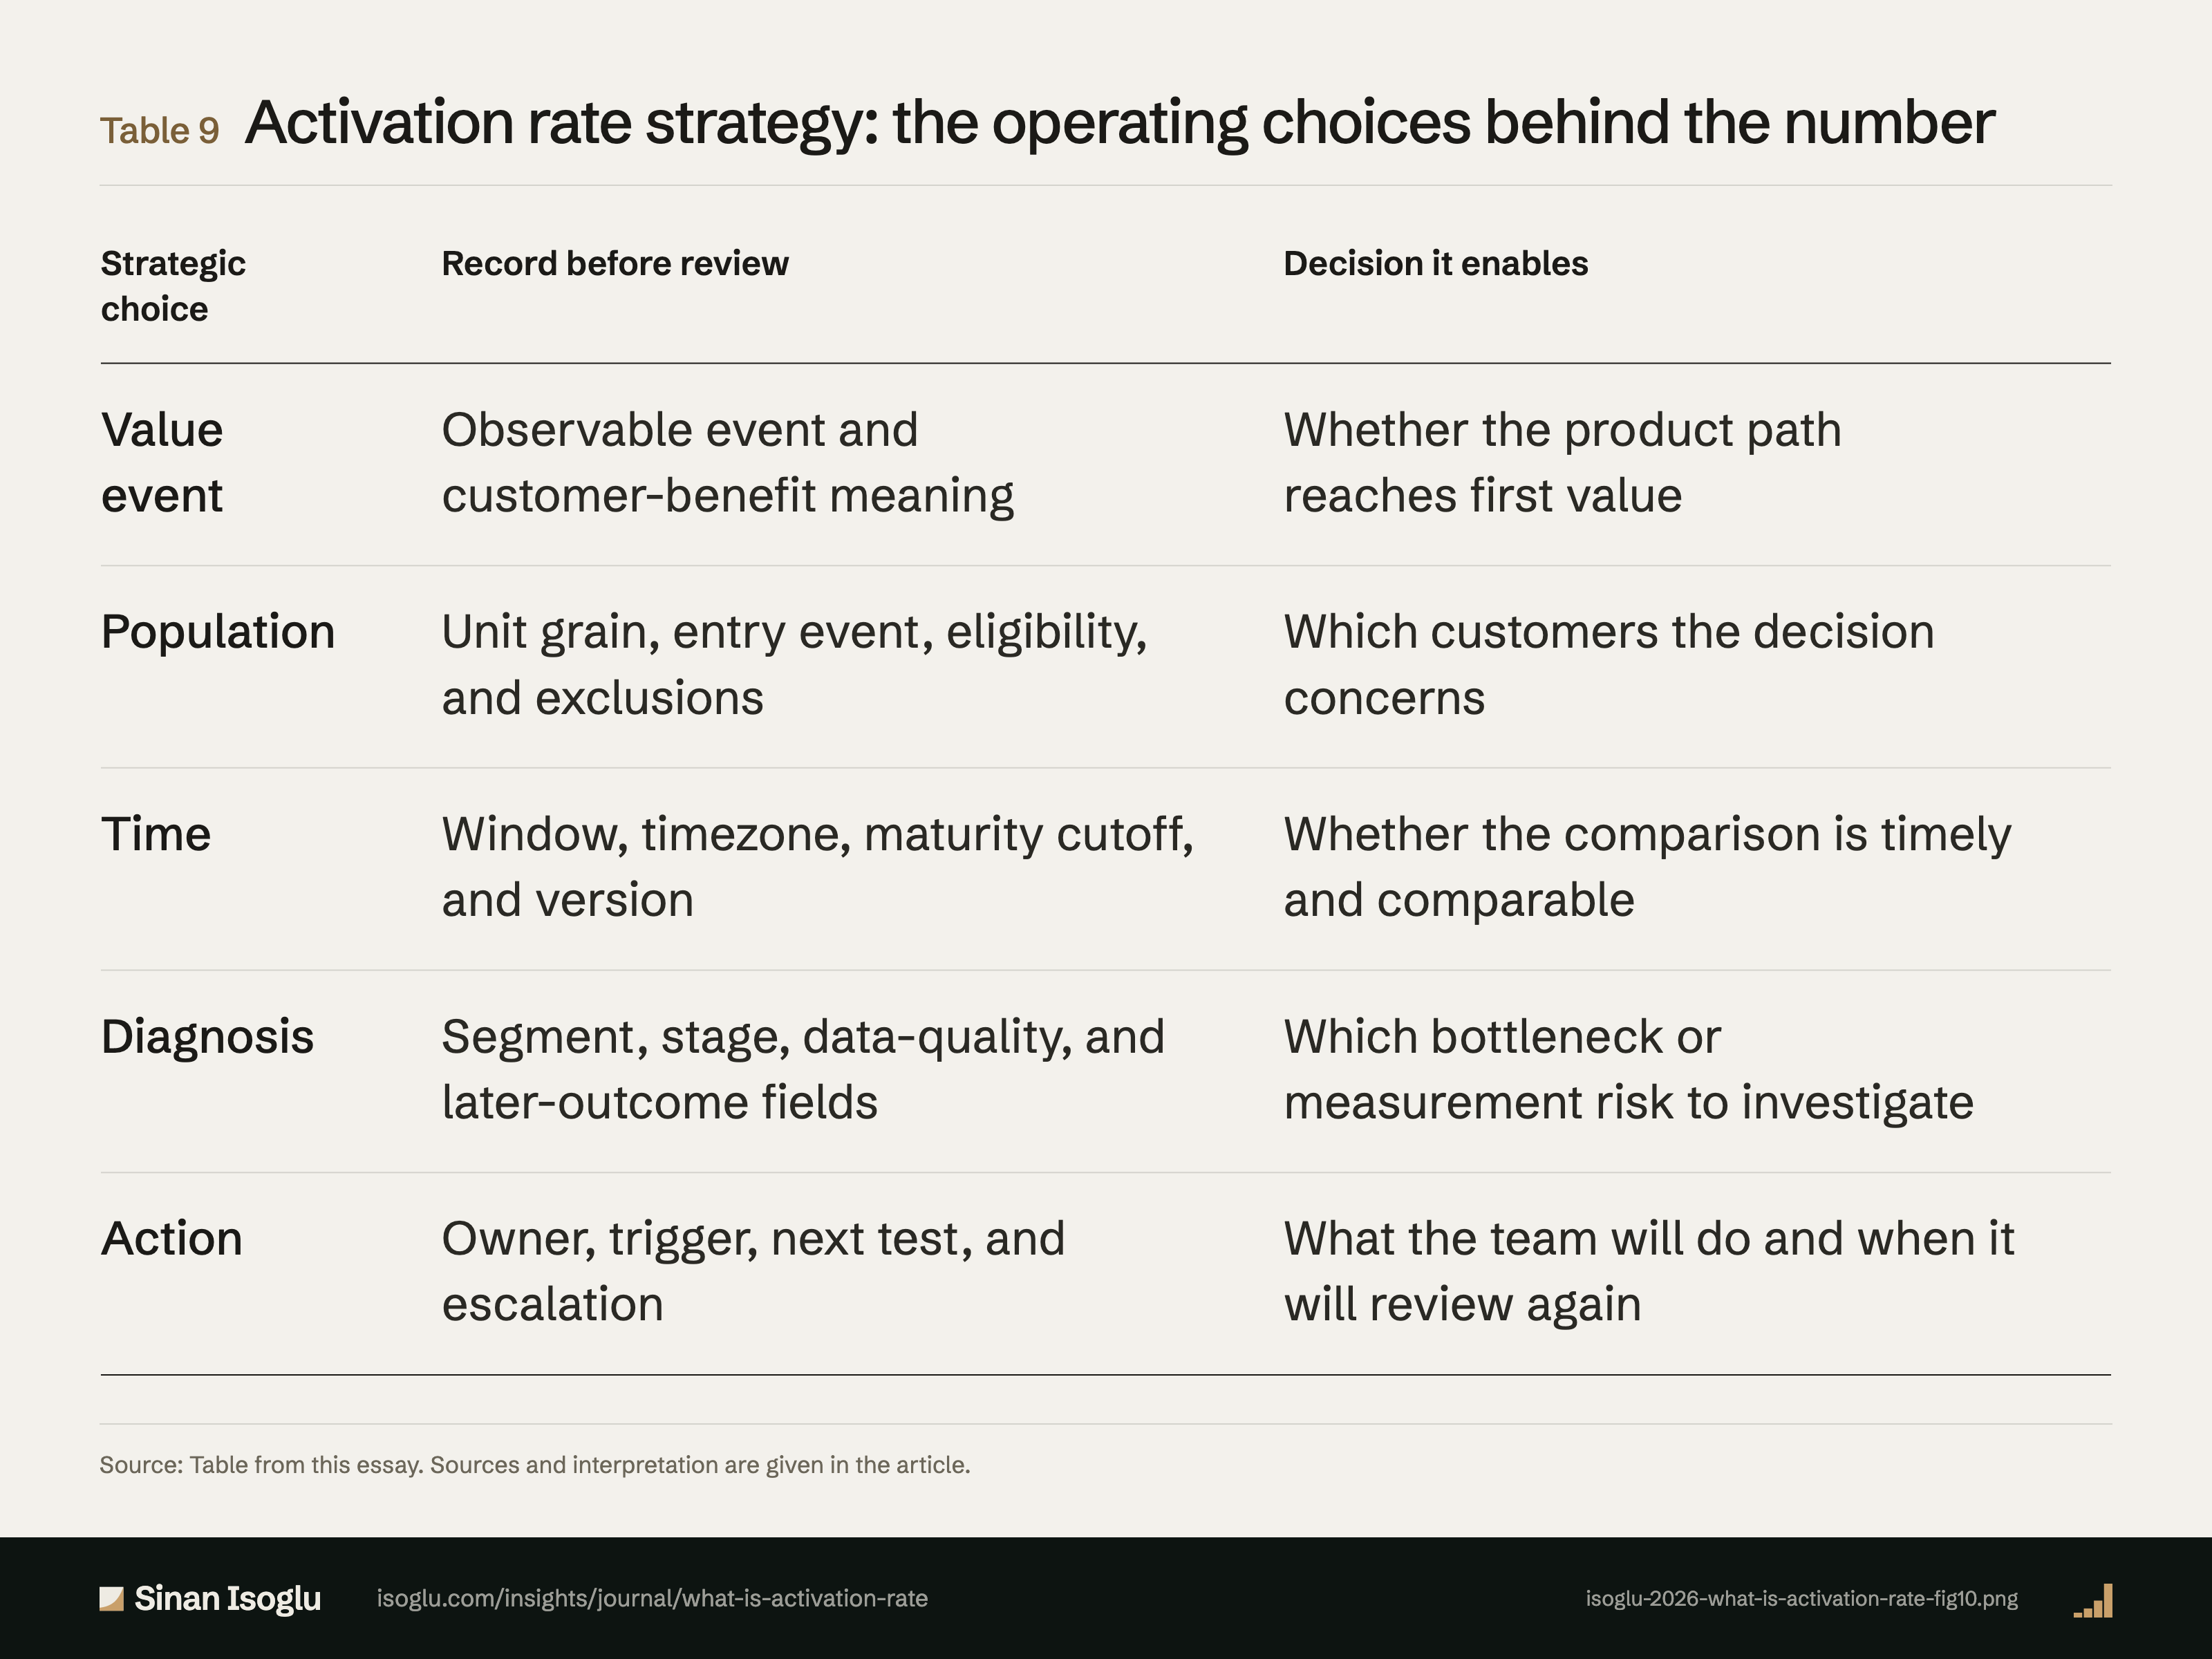
Table 9Table
Activation rate strategy: the operating choices behind the number
What is activation rate? The first value event must be observable
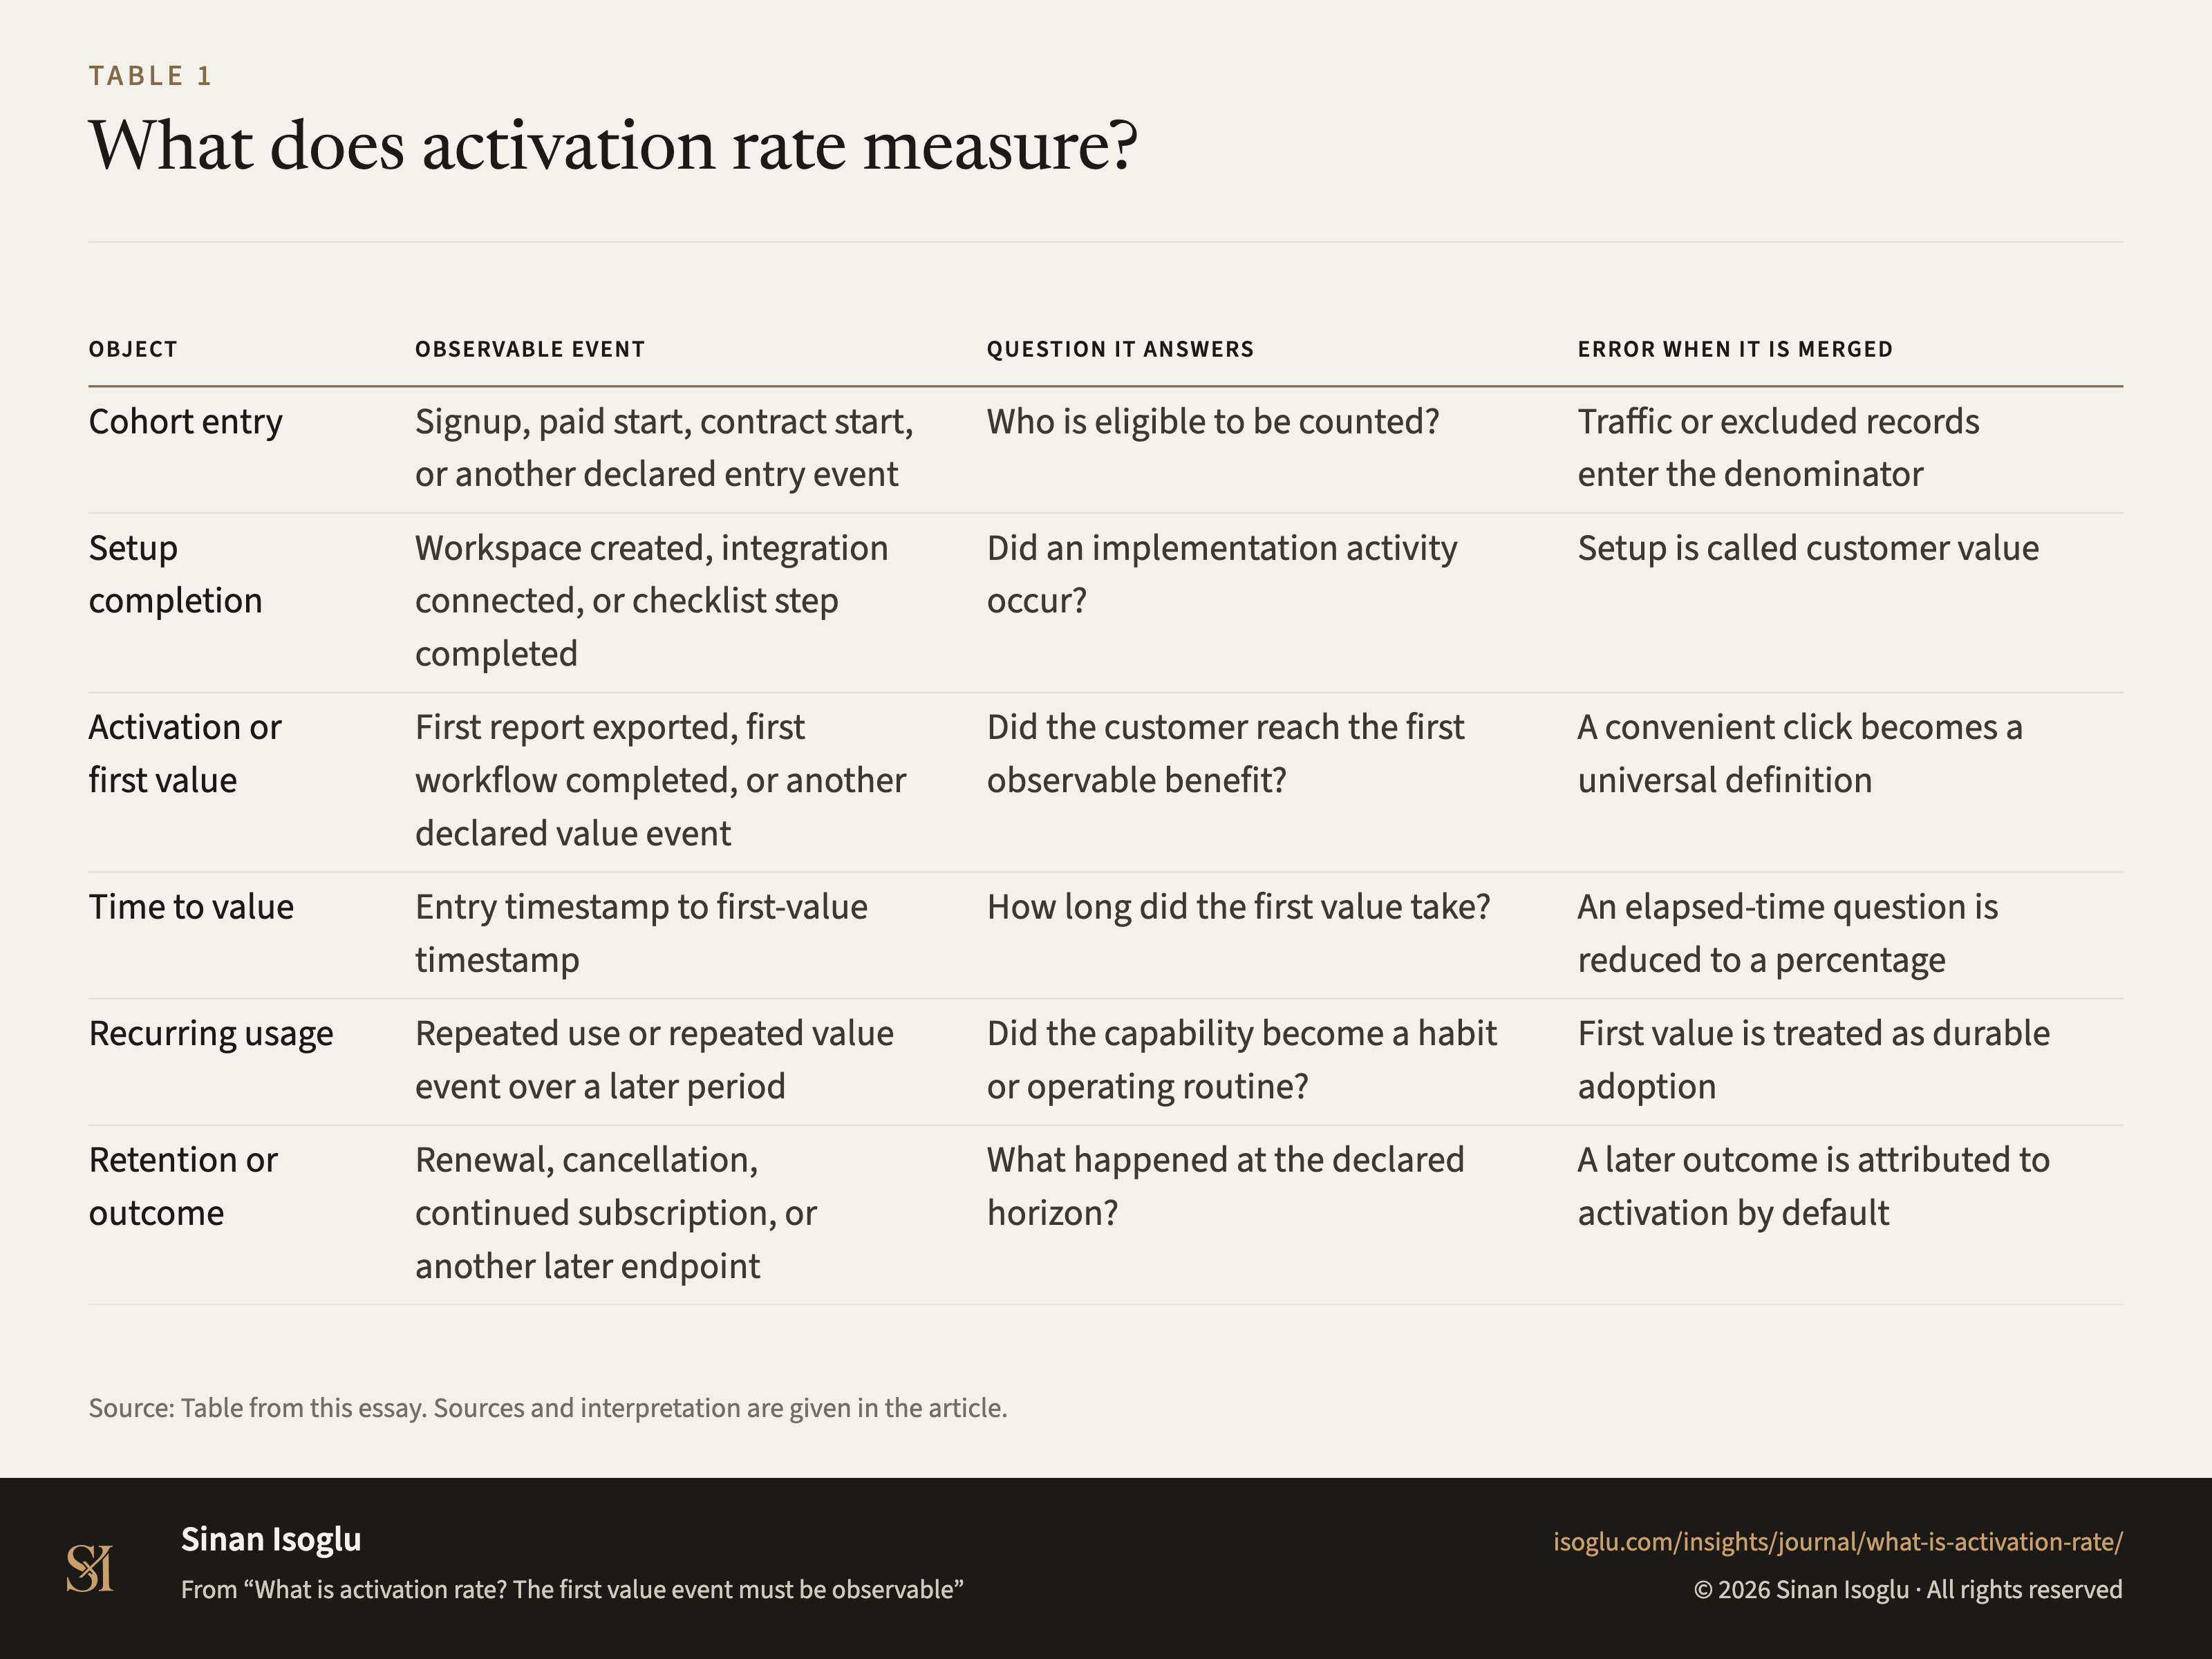
Table 1Table
What does activation rate measure?
What is activation rate? The first value event must be observable
Contact
Bring the question you're working on.
Research, a guest lecture, or a commercial question.