Table 8From “What are sales enablement metrics? Measure behavior change before activity”
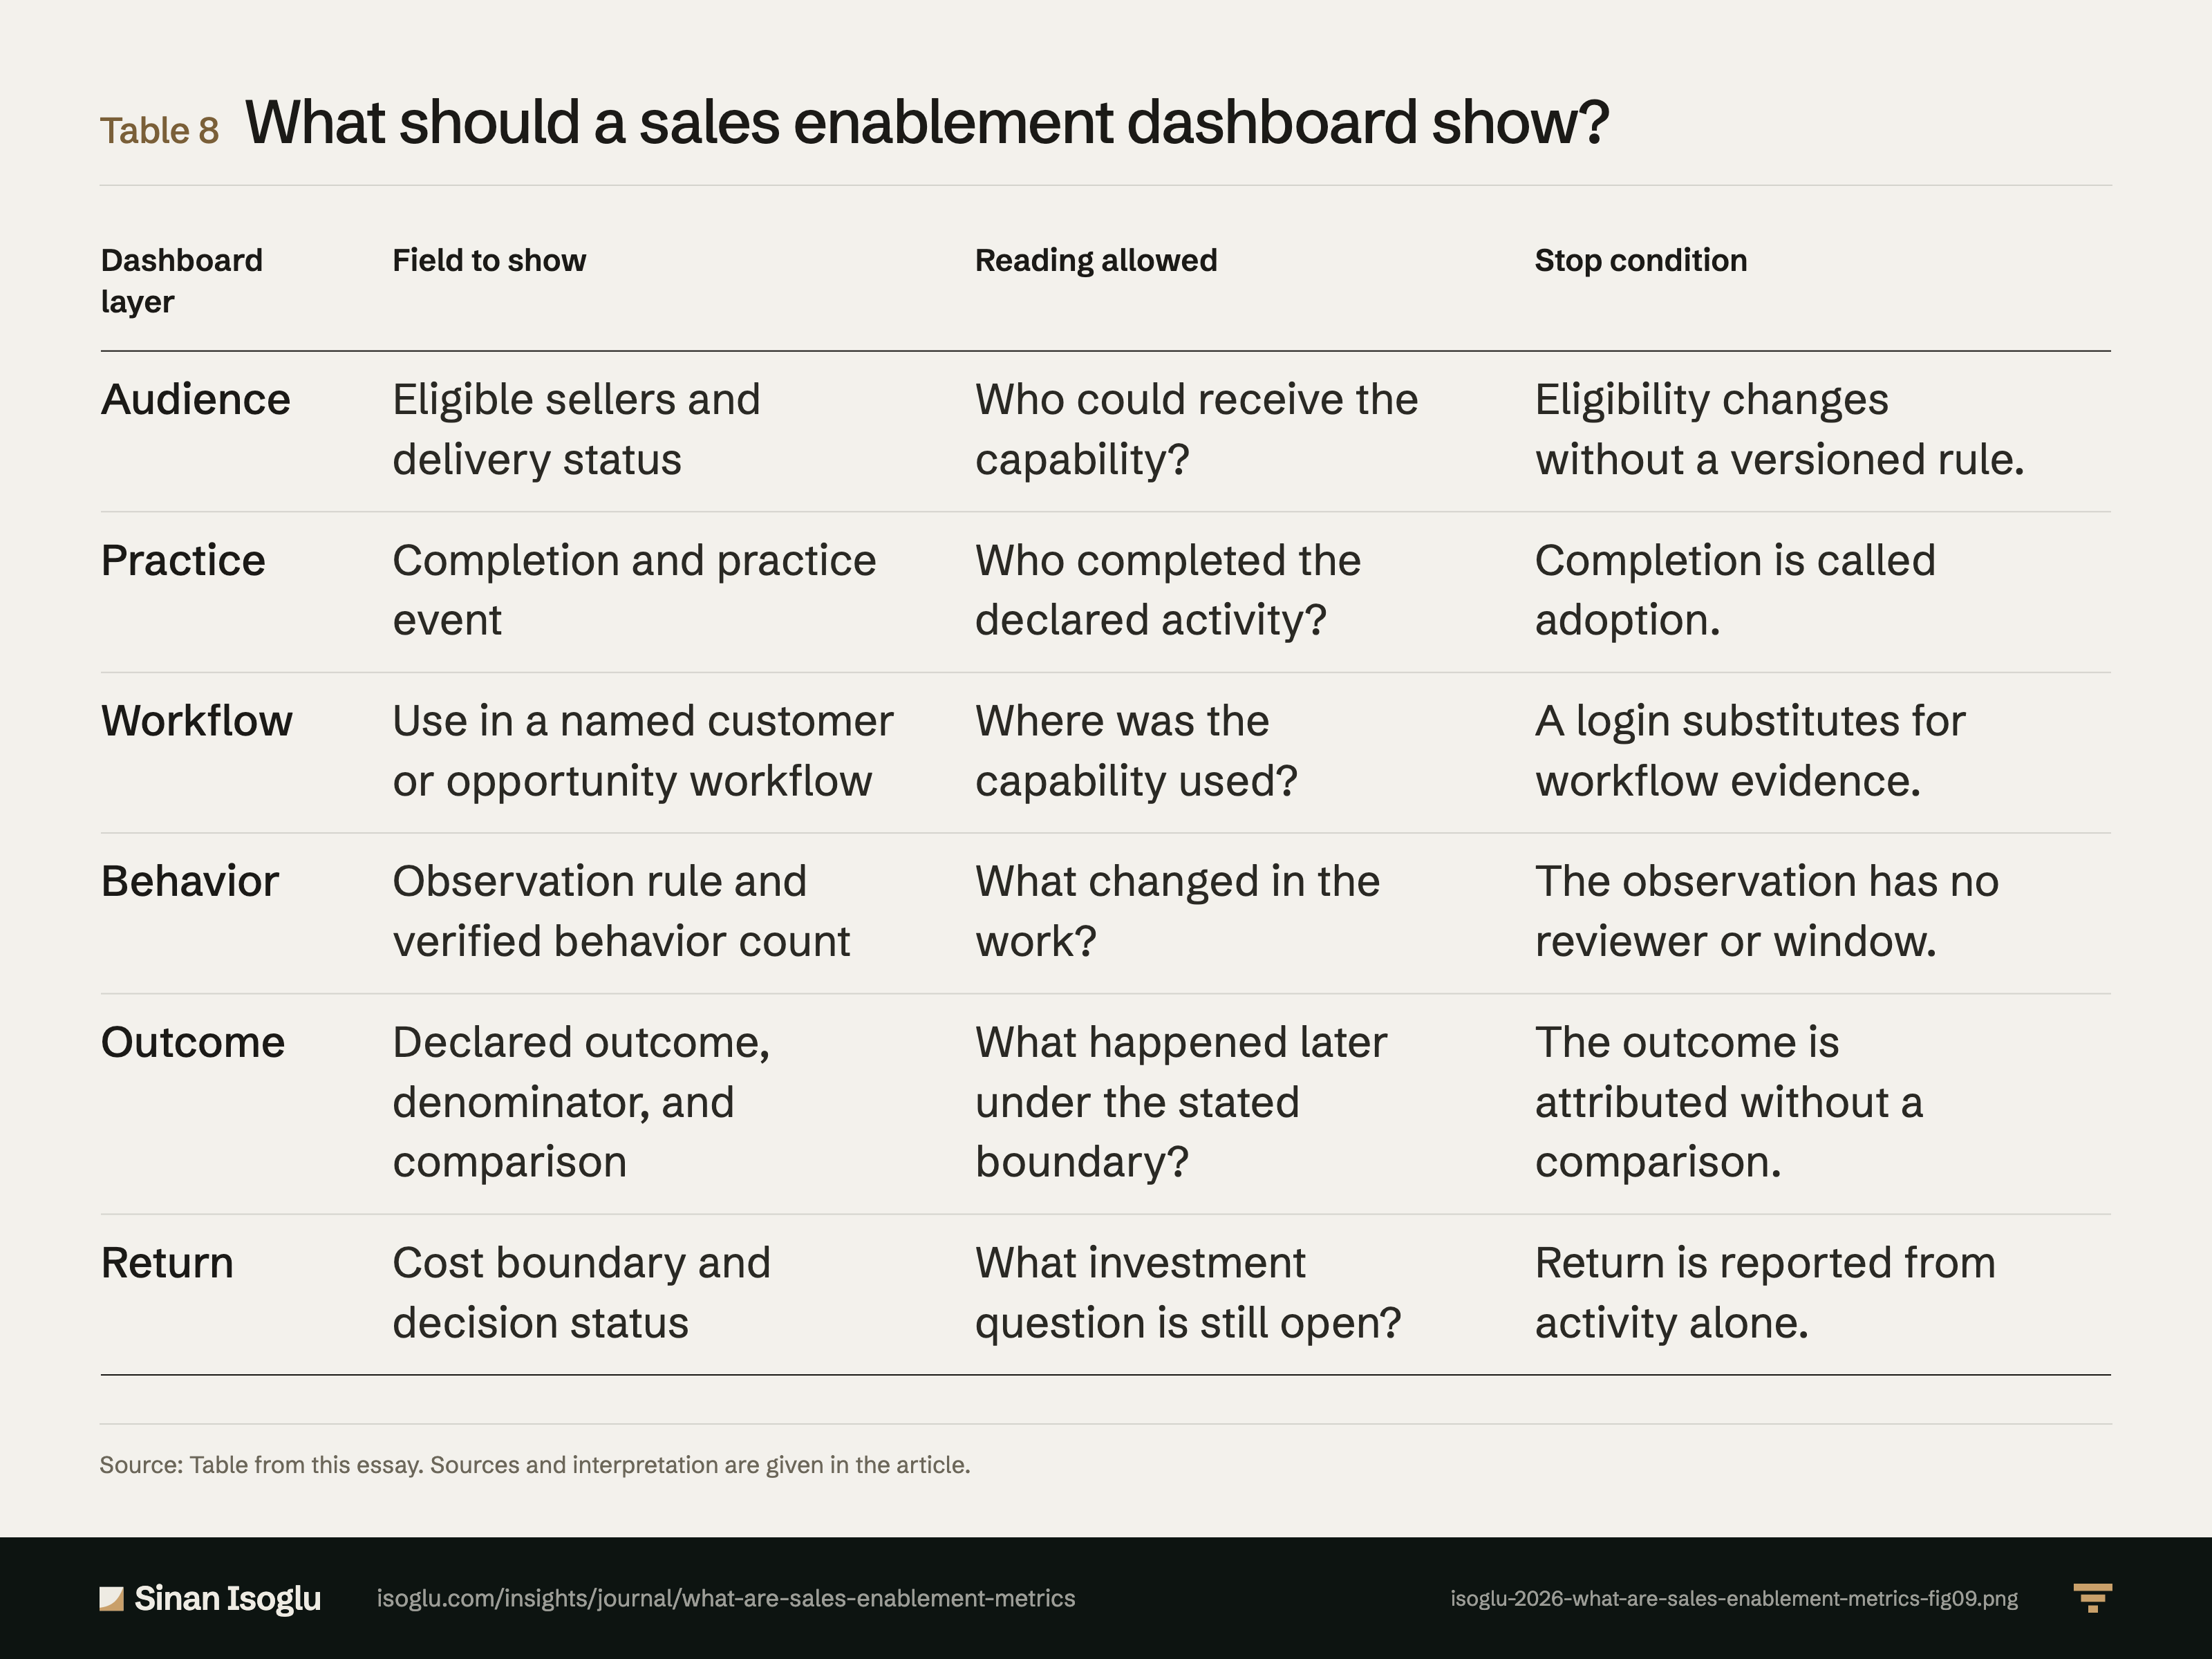
What should a sales enablement dashboard show?
Table 8What should a sales enablement dashboard show?
| Dashboard layer | Field to show | Reading allowed | Stop condition |
|---|---|---|---|
| Audience | Eligible sellers and delivery status | Who could receive the capability? | Eligibility changes without a versioned rule. |
| Practice | Completion and practice event | Who completed the declared activity? | Completion is called adoption. |
| Workflow | Use in a named customer or opportunity workflow | Where was the capability used? | A login substitutes for workflow evidence. |
| Behavior | Observation rule and verified behavior count | What changed in the work? | The observation has no reviewer or window. |
| Outcome | Declared outcome, denominator, and comparison | What happened later under the stated boundary? | The outcome is attributed without a comparison. |
| Return | Cost boundary and decision status | What investment question is still open? | Return is reported from activity alone. |
Swipe or scroll horizontally if the table is wider than your screen.
Source: Table from this essay. Sources and interpretation are given in the article.
From the essay
Revenue operations & AI
What are sales enablement metrics? Measure behavior change before activity
Sales enablement metrics should follow adoption into behavior and outcome. Count content and training only after the decision path is declared.
Read the essayThis exhibit belongs to an essay: the numbers live here, the argument lives there.
Cite or embed
Related exhibits
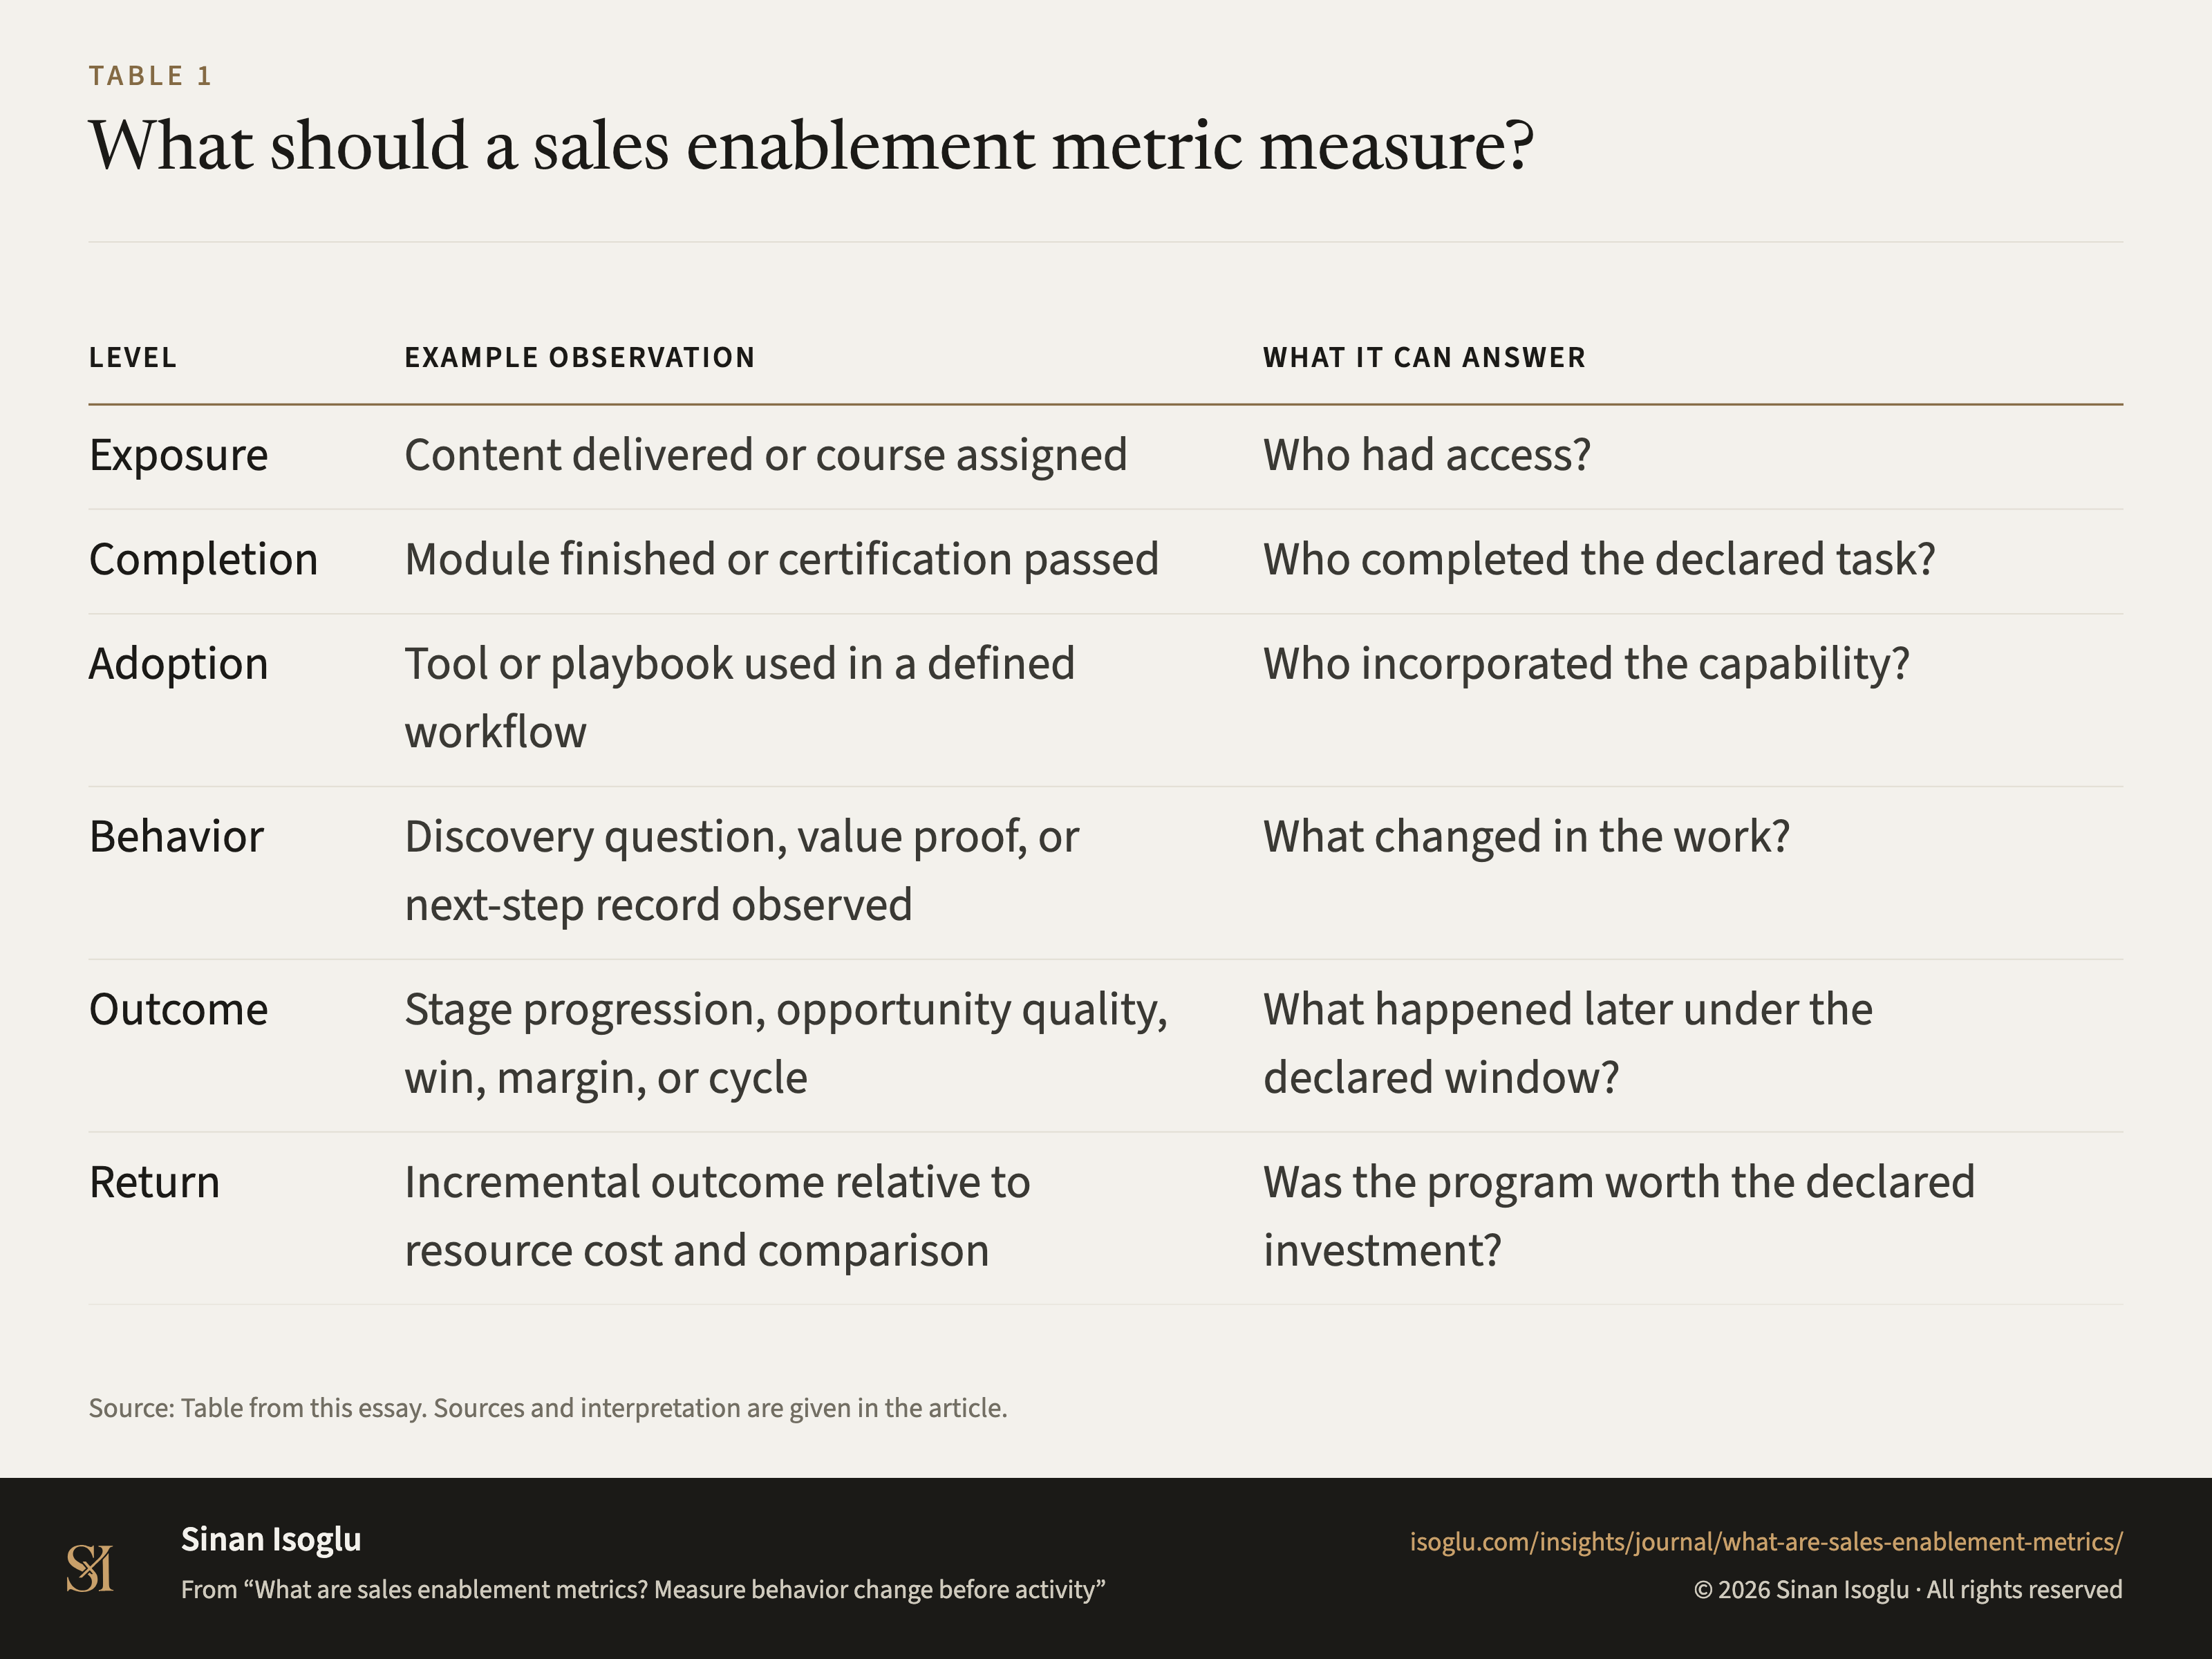
Table 1Table
What should a sales enablement metric measure?
What are sales enablement metrics? Measure behavior change before activity
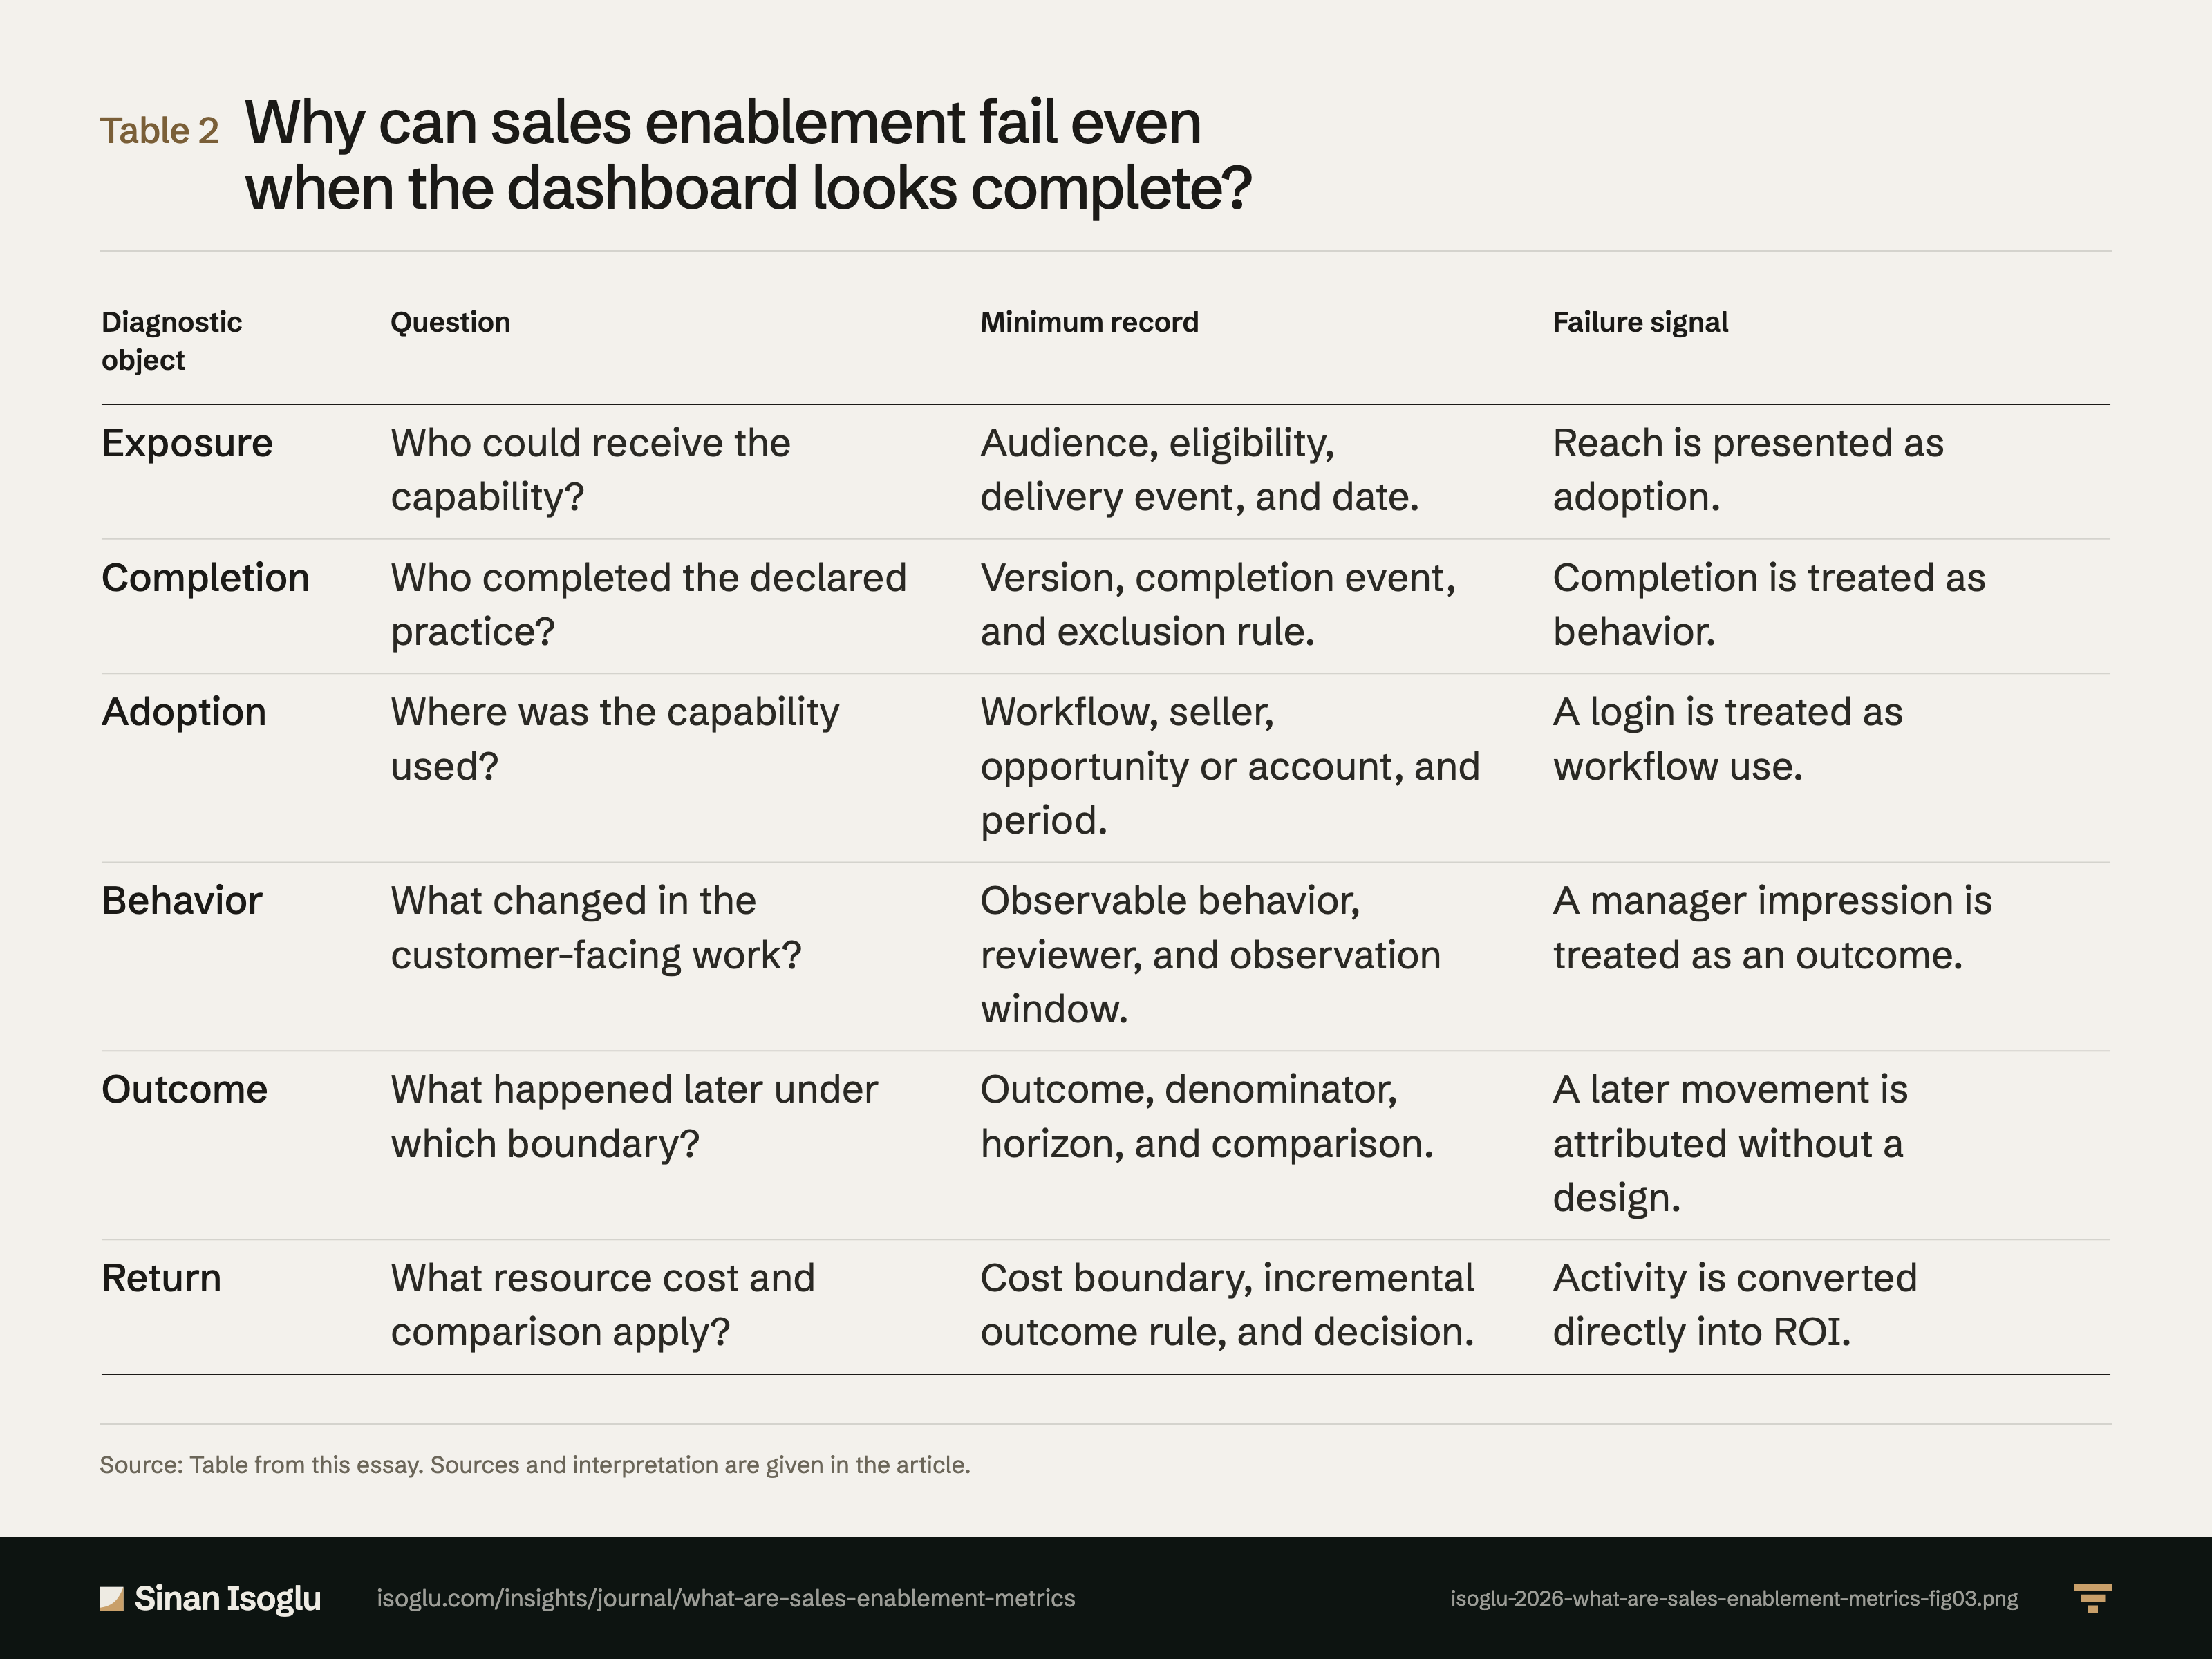
Table 2Table
Why can sales enablement fail even when the dashboard looks complete?
What are sales enablement metrics? Measure behavior change before activity
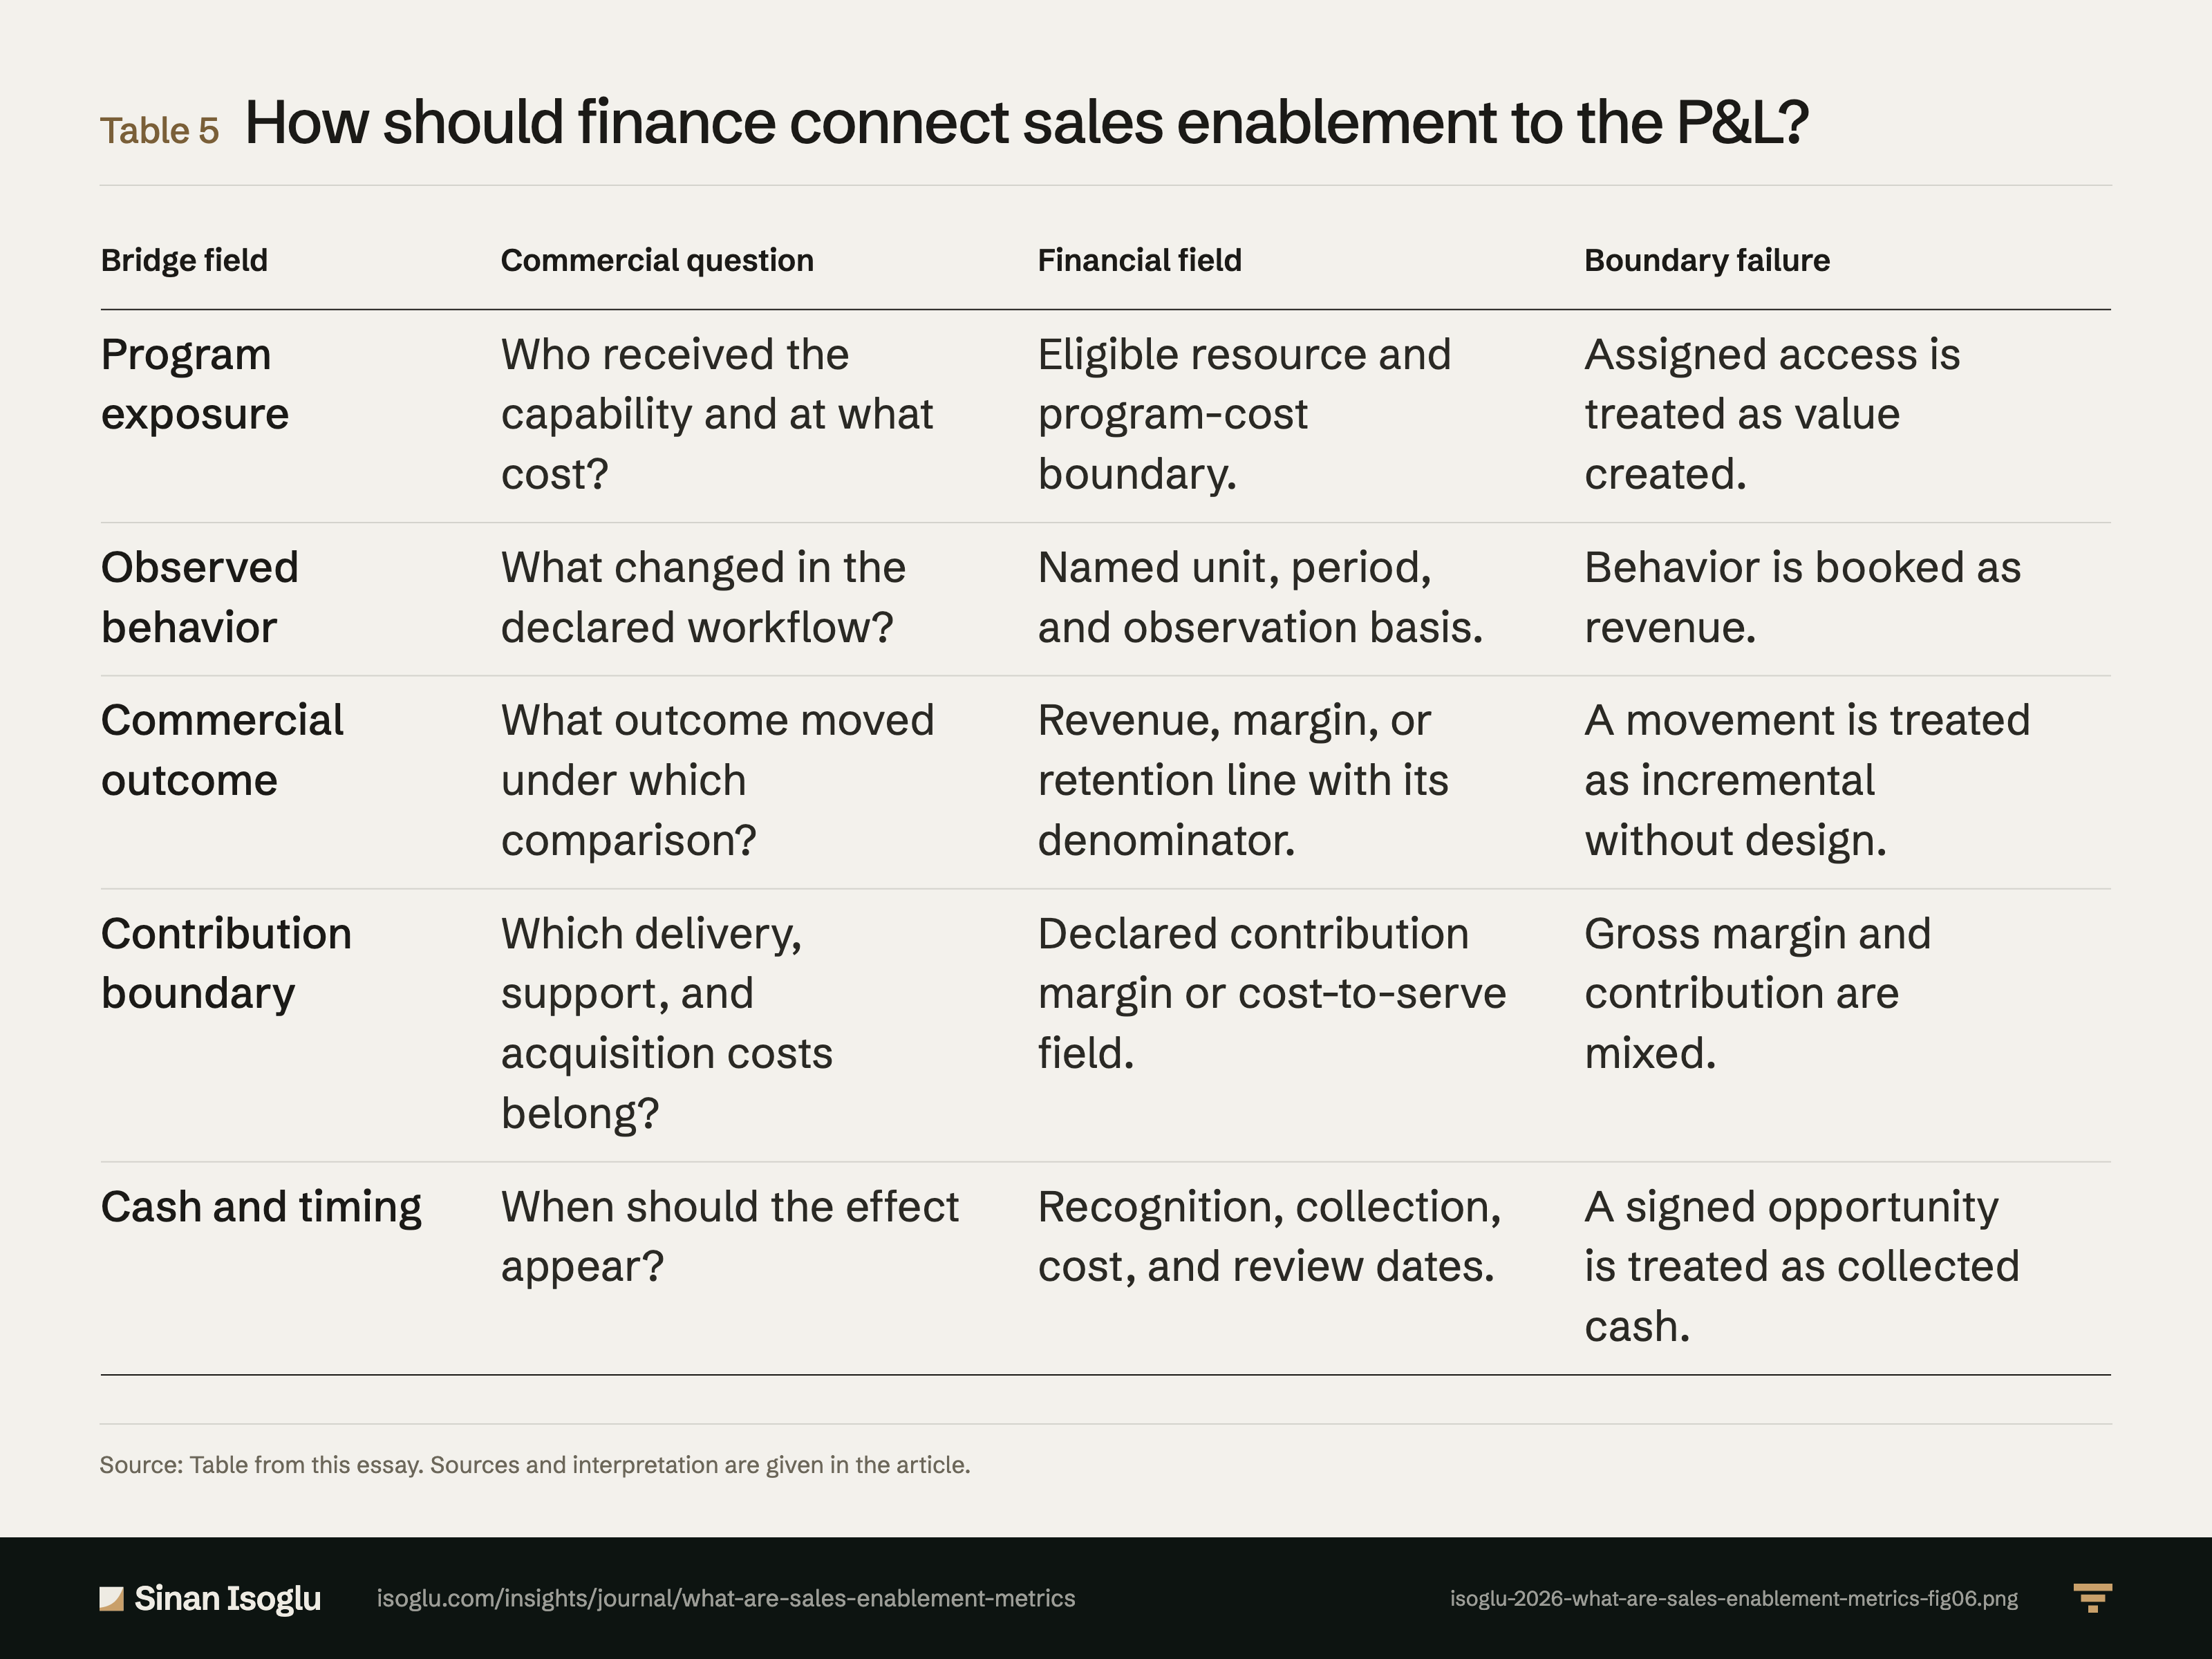
Table 5Table
How should finance connect sales enablement to the P&L?
What are sales enablement metrics? Measure behavior change before activity
Contact
Bring the question you're working on.
Research, a guest lecture, or a commercial question.