Abbildung 4Aus „Was ist Sales and Operations Planning (S&OP)?“
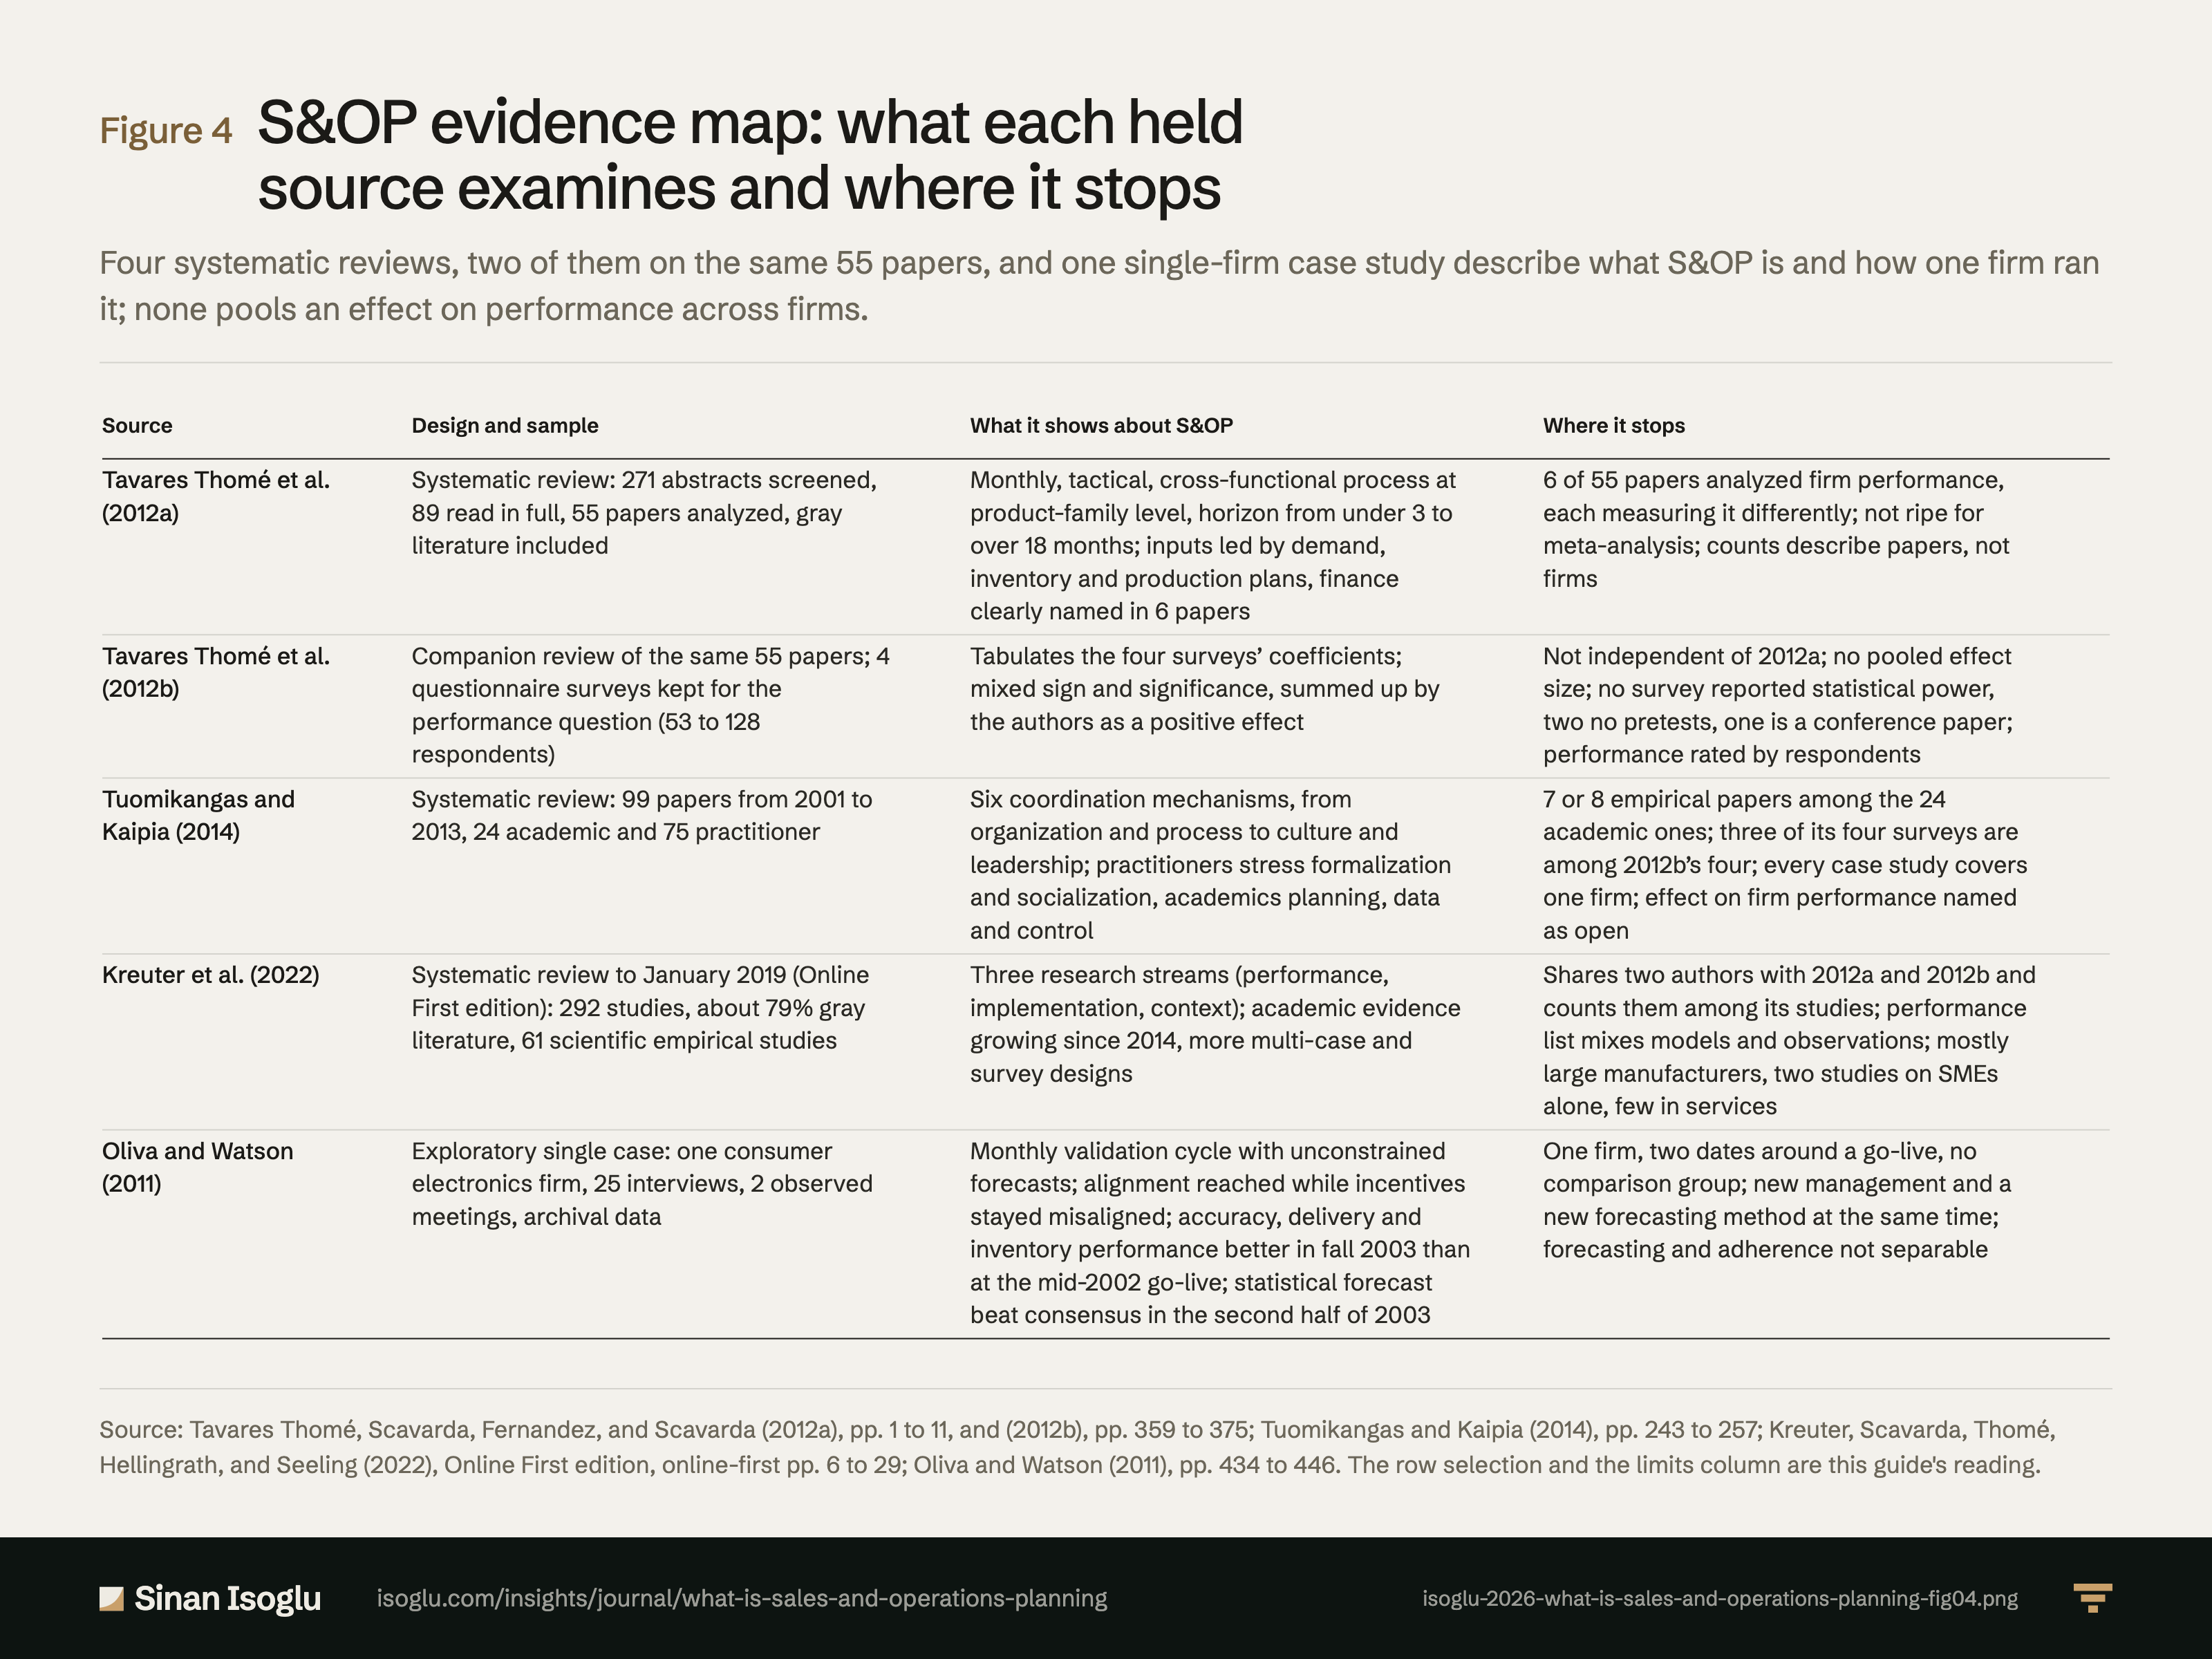
S&OP-Evidenzkarte: was jede vorliegende Quelle untersucht und wo sie endet
Vier systematische Übersichten, davon zwei über dieselben 55 Arbeiten, und eine Einzelfallstudie beschreiben, was S&OP ist und wie ein Unternehmen es betrieb; keine fasst eine Wirkung auf die Leistung über Unternehmen hinweg zusammen.
Abbildung 4S&OP-Evidenzkarte: was jede vorliegende Quelle untersucht und wo sie endet
| Quelle | Anlage und Stichprobe | Was sie über S&OP zeigt | Wo sie endet |
|---|---|---|---|
| Tavares Thomé u. a. (2012a) | Systematische Übersicht: 271 Kurzfassungen gesichtet, 89 im Volltext gelesen, 55 Arbeiten ausgewertet, graue Literatur eingeschlossen | Monatlicher, taktischer, funktionsübergreifender Prozess auf Ebene der Produktfamilie, Horizont von unter 3 bis über 18 Monaten; Eingangsgrößen vor allem Nachfrage-, Bestands- und Produktionspläne, Finanzpläne nur in 6 Arbeiten ausdrücklich | 6 von 55 Arbeiten untersuchten die Unternehmensleistung, jede mit anderem Maß; für eine Metaanalyse nicht reif; die Zahlen beschreiben Arbeiten, nicht Unternehmen |
| Tavares Thomé u. a. (2012b) | Begleitübersicht über dieselben 55 Arbeiten; 4 Fragebogenerhebungen für die Wirkungsfrage behalten (53 bis 128 Antwortende) | Tabelliert die Koeffizienten der vier Befragungen; gemischtes Vorzeichen und gemischte Signifikanz, von den Autoren als positiver Effekt zusammengefasst | Nicht unabhängig von 2012a; keine gepoolte Effektgröße; keine Befragung berichtet die Teststärke, zwei keine Vortests, eine ist ein Konferenzbeitrag; Leistung von den Befragten eingeschätzt |
| Tuomikangas und Kaipia (2014) | Systematische Übersicht: 99 Arbeiten von 2001 bis 2013, 24 wissenschaftliche und 75 praxisorientierte | Sechs Koordinationsmechanismen, von Organisation und Prozess bis Kultur und Führung; die Praxis betont Formalisierung und Sozialisierung, die Wissenschaft Planung, Daten und Kontrolle | 7 oder 8 empirische unter den 24 wissenschaftlichen Arbeiten; drei ihrer vier Befragungen gehören zu den vier von 2012b; jede Fallstudie betrifft ein Unternehmen; Wirkung auf die Unternehmensleistung als offen benannt |
| Kreuter u. a. (2022) | Systematische Übersicht bis Januar 2019 (Vorabfassung): 292 Studien, rund 79 Prozent graue Literatur, 61 wissenschaftliche empirische Studien | Drei Forschungsstränge (Leistung, Einführung, Kontext); wissenschaftliche Evidenz wächst seit 2014, mehr Mehrfachfallstudien und Befragungen | Teilt zwei Autoren mit 2012a und 2012b und zählt sie zu ihren Studien; die Liste zur Leistung mischt Modelle und Beobachtungen; überwiegend große Industrieunternehmen, zwei Studien nur zu KMU, wenige zu Dienstleistern |
| Oliva und Watson (2011) | Explorative Einzelfallstudie: ein Hersteller von Unterhaltungselektronik, 25 Interviews, 2 beobachtete Sitzungen, Unterlagen | Monatlicher Validierungszyklus mit Prognosen ohne Kapazitätsgrenzen; Abstimmung erreicht, während die Anreize gegenläufig blieben; Genauigkeit, Liefertreue und Bestand im Herbst 2003 besser als zum Start Mitte 2002; im zweiten Halbjahr 2003 war die statistische Prognose genauer als der Konsens | Ein Unternehmen, zwei Zeitpunkte um einen Start, keine Vergleichsgruppe; neue Führung und neue Prognosemethodik zur gleichen Zeit; Prognose und Planeinhaltung nicht trennbar |
Bei breiten Tabellen horizontal wischen oder scrollen.
Quelle: Tavares Thomé, Scavarda, Fernandez und Scavarda (2012a), S. 1 bis 11, und (2012b), S. 359 bis 375; Tuomikangas und Kaipia (2014), S. 243 bis 257; Kreuter, Scavarda, Thomé, Hellingrath und Seeling (2022), Vorabfassung (Online First), S. 6 bis 29; Oliva und Watson (2011), S. 434 bis 446. Die Auswahl der Zeilen und die Spalte zu den Grenzen sind die Lesart dieses Beitrags.
Quelle und Evidenz
Jede Zeile nennt eine Aussage zu dieser Abbildung, ihre Quelle und die Art ihrer Prüfung.
- A A gegen die gedruckte Seite der Primärquelle geprüftB Primärquelle, nur TextebeneC belastbare SekundärquelleD berichtet S&OP unites the business plans into one integrated set of plans, with the twofold purpose of balancing supply and demand and bridging the strategic plan and the operational plans; the APICS dictionary definition the authors quote (Cox and Blackstone, 2002) adds that it runs at least monthly and is reviewed by management at product-family level (pp. 1, 2): "Sales and operations planning (S&OP) is a tool that unites different business plans into one integrated set of plans. Its main purpose is twofold: (1) to balance supply and demand and (2) to build bridges between the business or strategic plan and the operational plans of the firm."; "The process brings together all the plans for the business (sales, marketing, development, manufacturing, sourcing, and financial) into one integrated set of plans. It is performed at least once a month and is reviewed by management at an aggregate (product family) level." (the second span is the APICS dictionary as quoted on p. 2, a secondary citation)Tavares Thomé, Scavarda, Fernandez & Scavarda (2012)
- A A gegen die gedruckte Seite der Primärquelle geprüftB Primärquelle, nur TextebeneC belastbare SekundärquelleD berichtet Most S&OP planning is at product-family level, with SKU-based and mixed examples; horizons run from under three to over 18 months, usually 6 to 18; the dominant view places S&OP at the tactical level (pp. 2, 8, 9): "While most S&OP planning is done at the product family level"; "a planning horizon from less than three months to over 18 months"; "Planning horizons, usually situated between 6 and 18 months"; "However, the dominant perception of the role of S&OP is at the tactical level."Tavares Thomé, Scavarda, Fernandez & Scavarda (2012)
- A A gegen die gedruckte Seite der Primärquelle geprüftB Primärquelle, nur TextebeneC belastbare SekundärquelleD berichtet Inputs are cross-classified by area (demand, source, production, delivery, finance) and type (plans, constraints, other) in Table 3 (pp. 6, 7); production capacity is a main operational restriction and finance enters as budgets and financial goals (p. 10); of the 55 papers, 44 name integrated demand and functional plans, 41 inventory plans, 21 an integrated production or capacity plan, 15 integrated sales and demand forecasts, 8 procurement and supply planning, and 6 clearly name finance planning as a key input (p. 10); integrating finance "warrants further research" (p. 11). Counts of papers, not of firms: "It appears as an input in Table 3 in forty-four papers (as integrated demand and functional plans), fifteen papers quote integrated sales and demand forecasts, eight quotes procurement and supply planning, twenty-one refers to integrated production/capacity plan, and yet forty-one papers include plans for inventory as inputs to the S&OP process."; "with only six papers clearly quoting finance planning as a key input into the S&OP process"; "Production capacity is one of the most relevant operations restrictions to the S&OP process."; "mainly as budgetary restrictions and as financial goals (product margins and profitability)"Tavares Thomé, Scavarda, Fernandez & Scavarda (2012)
- A A gegen die gedruckte Seite der Primärquelle geprüftB Primärquelle, nur TextebeneC belastbare SekundärquelleD berichtet Method: three databases with grey literature included; 271 abstracts screened, 89 read in full, 55 analysed; Cohen's kappa for three judges 0.47 after the third meeting, 0.83 after industry magazines and trade journals were excluded; the maturity models listed (Table 2, p. 4) run from three to five stages and their variety makes cumulative results hard to obtain (pp. 2 to 5, 11): "Two hundred seventy-one abstracts and 89 full-text papers were retrieved and 55 were analysed for the final review."; "Cohen's kappa nearly doubled (0.83) during the fourth review meeting, after consensus was reached about the exclusion of articles from industry magazines and trade journals."; "difficult to summarise results and to acquire cumulative, evidence-based results in S&OP practice"Tavares Thomé, Scavarda, Fernandez & Scavarda (2012)
- A A gegen die gedruckte Seite der Primärquelle geprüftB Primärquelle, nur TextebeneC belastbare SekundärquelleD berichtet Only 6 of the 55 papers analysed S&OP's impact on firm performance (one mathematical programming model, four reporting positive associations, the Oliva and Watson case), each measured differently; no paper measured the S&OP process itself; the literature is not ripe for meta-analysis; the "at least partial evidence" that the process matters even under contradictory incentives is cited to Oliva and Watson (pp. 10, 11): "Among the 55 papers reviewed, just six papers analysed the impact of S&OP on the performance of the firm."; "In all cases, the performance of the firm was measured differently, making comparisons and cumulative meta-analysis difficult."; "none of the papers worked directly with metrics aimed at measuring the S&OP process itself"; "It seems that the literature in S&OP research is not yet ripe for meta-analysis."; "It seems that there is at least partial evidence that the process in itself might make a difference for the performance of the firm, even when incentives and contracts are contradictory and do not encourage collaboration" Repair 2026-11-13: the six as the synthesis summarises them are one programming model (Feng et al. 2008), three positive relations (Nakano; Hadaya and Cassivi; McCormack and Lockamy), one mediating role (Olhager and Selldin) and the Oliva and Watson case.Tavares Thomé, Scavarda, Fernandez & Scavarda (2012)
- A A gegen die gedruckte Seite der Primärquelle geprüftB Primärquelle, nur TextebeneC belastbare SekundärquelleD berichtet The companion review sets out to measure the size of S&OP's effect on firm performance from the same search as the IJPE synthesis (271 abstracts, 55 papers, the same three databases); 182 papers fell at the abstract and 34 at the full text, and a third criterion (survey papers reporting data sources, pretests, content validity, reliability and regression coefficients) left four (pp. 359, 363, 364): "to identify and measure the size of the effect of S&OP on firm performance"; "a systematic literature review of 271 abstracts and 55 papers"; "The first two criteria excluded 216 papers, 182 based on the abstract reading and an additional 34 papers based on the full-text review."; "further reduced the number of papers down to four". Not independent of the IJPE synthesis.Tavares Thomé, Scavarda, Fernandez & Scavarda (2012, IJPPM)
- A A gegen die gedruckte Seite der Primärquelle geprüftB Primärquelle, nur TextebeneC belastbare SekundärquelleD berichtet The four surveys (Table II, p. 369): Olhager and Selldin 2007, mail questionnaire in Sweden, usable n = 128, response 25%; Nakano 2009, mail questionnaire in Japan, n = 65, 25%; Hadaya and Cassivi 2007, e-mail survey in the USA and Canada, n = 53, 40.8%; McCormack and Lockamy 2005, mail survey in the USA, n = 55, 10.5%; performance rated on Likert scales and measured differently in each; no study reported statistical power (pp. 368, 369, 371): "All papers met with low response rates"; "None of the papers reported on statistical power."; "Firm performance was measured differently in each study." Repair 2026-11-13: two of the four did not report pretests and McCormack and Lockamy's informal-organisation scale has alpha 0.46 (Table II, p. 369): "McCormack and Lockamy (2005) did not report on pretests. Olhager and Selldin (2007) did not report on confirmatory interviews and pretests." (p. 368)Tavares Thomé, Scavarda, Fernandez & Scavarda (2012, IJPPM)
- A A gegen die gedruckte Seite der Primärquelle geprüftB Primärquelle, nur TextebeneC belastbare SekundärquelleD berichtet Results as tabulated (Table III, p. 370, read on the rendered page, PDF p. 13): McCormack and Lockamy, integrating role 0.3285, formal groups 0.4402, informal organisation 0.5054, network building 0.2442 (each p = 0.05); Olhager and Selldin, market uncertainty to planning approach 0.553 (p < 0.001), planning approach to performance 0.258 (p = 0.117), market uncertainty to performance -0.383 (p = 0.013); Hadaya and Cassivi, joint planning to flexibility -0.299 (n.s.), IOIS use to flexibility 0.659 (p < 0.001); Nakano, internal CFP to performance 0.746 (p < 0.05), CFP with suppliers -0.174 (n.s.), with wholesalers and retailers -0.009 (n.s.). The authors' summary and call, and the conclusion that repeats the partial-evidence statement beside Oliva and Watson's hypothesis (pp. 373, 375): "Overall, S&OP has a positive effect on performance."; "most results depend on the sample of industries and countries included in the analysis"; "before any definitive conclusions about S&OP effects can be generalised"; "hypothesised that the S&OP process affects performance even when functional incentives and rewards are contradictory"; "There is at least partial evidence that cross-functional planning processes can mitigate the negative effect of misaligned organisational structures and contradictory incentives schemes on firm performance."Tavares Thomé, Scavarda, Fernandez & Scavarda (2012, IJPPM)
- A A gegen die gedruckte Seite der Primärquelle geprüftB Primärquelle, nur TextebeneC belastbare SekundärquelleD berichtet S&OP is a key business process matching customer demand with supply capabilities in the medium term, uniting plans into one integrated set of numbers (pp. 243, 244): "a key business process to match customer demand with supply capabilities in the medium term"; "by uniting plans into one integrated set of numbers"Tuomikangas & Kaipia (2014)
- A A gegen die gedruckte Seite der Primärquelle geprüftB Primärquelle, nur TextebeneC belastbare SekundärquelleD berichtet Sample: 246 database results reduced to 83, plus 16 from a manual journal review, 99 papers from 2001 to 2013, 75 practitioner and 24 academic; modelling and simulation 41% of the academic papers; empirical work given as four surveys and three case studies (p. 248) but later as eight empirical papers (p. 256), the difference being Grimson and Pyke (2007), listed as a case study in Table 3; surveys of 121, 53, 128 and 65 firms or suppliers (Table 4, p. 249); every case study covers one firm; Oliva and Watson singled out as the in-depth exception (pp. 245 to 249, 256): "75 papers of the 99 were practitioner papers and only 24 were academic"; "four surveys and three case studies"; "only eight papers with empirical data"; "all the three case studies in this analysis reported a single case study"; "investigating S&OP in-depth with a process approach from process, organization, data and behavioral dynamic perspectives" Repair 2026-11-13: McCormack and Lockamy (2005) was moved to the practitioner category (p. 246): "Two academic articles that did not meet both of academic category criteria were assigned to the practitioner category"; three of Table 4's four surveys (Hadaya and Cassivi, Olhager and Selldin, Nakano) are three of the IJPPM review's four (p. 249; 2012b Table II).Tuomikangas & Kaipia (2014)
- A A gegen die gedruckte Seite der Primärquelle geprüftB Primärquelle, nur TextebeneC belastbare SekundärquelleD berichtet Six coordination mechanisms (S&OP organization, process, tools and data, performance management, strategic alignment, culture and leadership), described in Table 6 and pp. 254, 255; a hard and a soft side (p. 256); conflict handling and escalation rules singled out as important (p. 251): "we identify six relevant coordination mechanisms for S&OP: the S&OP process, S&OP organization, S&OP tools and data, performance management, strategic alignment, and S&OP culture and leadership"; "The essential elements of the formal structure are the decision making authorities, the configuration for centralization/decentralization, and the descriptions of roles and responsibilities and process activities."; "the dynamic collaborative planning and decision making process between functions"; "the hard side, consisting of formal procedures, schedules, data, and performance, and the soft side, consisting of a common culture, commitment, trust, and collaboration"; "dealing with conflicts and creating the rules for escalated decision making"Tuomikangas & Kaipia (2014)
- A A gegen die gedruckte Seite der Primärquelle geprüftB Primärquelle, nur TextebeneC belastbare SekundärquelleD berichtet Share of articles discussing each coordination mechanism, academic (N = 24) against practitioner (N = 75), Fig. 4 (p. 250) and text (pp. 249, 250): structure and centralization 17% and 11%; formalization and standardization 17% and 68%; planning and data management 96% and 88%; output and behavior control 71% and 52%; intracompany relations 54% and 63%; intercompany relations 25% and 23%; informal communication 4% and 3%; socialization 21% and 64%. Shares of articles, not of firms. Text span (p. 250): "68% of the practitioner articles dealt with the formalization and standardization category, while only 17% of the academic articles did so" Repair 2026-11-13, author arithmetic: 17% and 21% of 24 academic articles are 4 and 5 articles.Tuomikangas & Kaipia (2014)
- A A gegen die gedruckte Seite der Primärquelle geprüftB Primärquelle, nur TextebeneC belastbare SekundärquelleD berichtet Research gives companies few guidelines; the effect of S&OP implementation on firm performance is an open question; Oliva and Watson are cited for integration despite unsupportive incentives; S&OP as a tool for closing gaps to business targets, with marketing shaping demand, is in its infancy (pp. 254, 256): "The current academic research offers few guidelines for companies on how to benefit most from S&OP, which is somewhat surprising given the high implementation costs and the high level of expected benefits."; "A particular issue to be addressed in future research is the impact of the implementation of S&OP on firm performance."; "stating that S&OP as a collaborative process can enhance integration despite functional incentives that do not support integration"; "can be designed as an efficient tool for identifying and closing gaps between the plan and business targets"; "these views are still in their infancy"; "Conceptual and empirical literature is largely missing"Tuomikangas & Kaipia (2014)
- A A gegen die gedruckte Seite der Primärquelle geprüftB Primärquelle, nur TextebeneC belastbare SekundärquelleD berichtet Method, Online First edition: Scopus, Web of Science and EBSCO plus a manual search of the Journal of Business Forecasting, screened December 2017 and updated January 2019; 603 studies after duplicates, 84 added by snowballing, 687 in all, 395 excluded, 292 analysed; Krippendorff's alpha 0.87 (abstracts) and 0.96 (full text) (online-first pp. 6, 7): "The literature was firstly screened in December 2017 and once again in January 2019 for an update."; "resulting in a total sample of 687"; "Ultimately, 292 studies were retrieved for further analysis in the following steps."Kreuter et al (2022)
- A A gegen die gedruckte Seite der Primärquelle geprüftB Primärquelle, nur TextebeneC belastbare SekundärquelleD berichtet About 79% of the studies are grey literature, resting on authors' opinion and experience; 61 scientific empirical studies, 39 of them from 2014 to 2018; multiple case studies the most used design (17); ten surveys with samples above 100 (online-first pp. 9, 20): "Around 79% of the total studies retrieved stem from grey literature."; "inferences from these studies should be drawn with caution"; "In total, 61 scientific empirical studies conducted by academics have been identified"; "Multiple case studies are the most used research design (n = 17)."; "Ten surveys have large sample sizes above 100" Repair 2026-11-13: the 61 include five earlier reviews (online-first p. 9): "Except for the five SLRs identified".Kreuter et al (2022)
- A A gegen die gedruckte Seite der Primärquelle geprüftB Primärquelle, nur TextebeneC belastbare SekundärquelleD berichtet The performance stream lists studies reporting a positive effect, measured with different performance measures; the evidence is mostly from medium and large manufacturers, few service studies, two on SMEs alone, none in engineer-to-order settings (online-first pp. 21, 22): "Several empirical works investigate the impact of S&OP on the performance of the company, reporting a positive effect"; "with different performance measures"; "Only a few studies present S&OP applications in the service sector"; "Just two studies focus solely on small and medium-sized companies."; "No study reports S&OP applications in ETO settings." Repair 2026-11-13: the performance list includes optimisation models and their replications and Olhager and Selldin (online-first pp. 20, 22, 26): "Sixteen of the retrieved studies apply mathematical models."; "offer a later replication of the findings in other settings".Kreuter et al (2022)
- A A gegen die gedruckte Seite der Primärquelle geprüftB Primärquelle, nur TextebeneC belastbare SekundärquelleD berichtet Design: exploratory grounded-theory single case of one disguised consumer electronics firm (Leitax) in northern California, selling through retailers and building through contract manufacturers in Asia and Latin America; 25 semi-structured interviews of 45 to 90 minutes, archival data and direct observation of two planning meetings (pp. 436, 437): "our research is exploratory in nature"; "is a consumer electronics firm with headquarters in northern California and with a global sales presence"; "Data were collected through 25 semi-structured, 45- to 90-min interviews"; "direct observation of two planning and forecasting meetings"Oliva & Watson (2011)
- A A gegen die gedruckte Seite der Primärquelle geprüftB Primärquelle, nur TextebeneC belastbare SekundärquelleD berichtet The monthly process (Fig. 1, p. 440): owned by the DMO; business assumptions package agreed on the first Wednesday; three functional forecasts at product-family level ignoring capacity; formula-weighted consensus discussed on the third Wednesday; financial validation against targets and operations validation of capacity; if the revenue fell short of targets, finance first checked that sales was not underestimating market potential, and only then were offer, prices and promotions revised and validation repeated (p. 441); the approved forecast drives the MPS; gap-filling at quarter end; accuracy feedback on each stream (pp. 440, 441): "Ownership of the forecasting and planning process was assigned to the demand management organization (DMO)"; "with the BAP and the Consensus meetings taking place in the first and third Wednesdays of the month"; "These three functional forecasts ignored capacity constraints since it was common at Leitax at this time for forecasts to be affected by perceptions of present and future supply chain capacity and thus to become self-fulfilling prophecies."; "more weight to the SDs' bottom-up forecast in the short term and increased the weight of the PPS's top-down forecast as the consensus forecast went out to the future"; "If there were capacity or financial concerns, the product offering and promotion decisions in the BAP were changed and the process of validation repeated."; "The approved forecast was released and used to generate the master production schedule (MPS)."; "usually occurred at the end of each quarter"; "the DMO presented evidence that sales forecasts tended to overestimate near-term sales and underestimate long-term sales" Repair 2026-11-13, the gap-filling order (p. 441): "If gaps were identified, the finance group would first ensure that the sales group was not underestimating the product’s market potential."; "return to the BAP and, together with the marketing department, revise the pricing and promotion strategies to meet financial goals and analyst expectations"; and "self-fulfilling prophecies" (p. 440).Oliva & Watson (2011)
- A A gegen die gedruckte Seite der Primärquelle geprüftB Primärquelle, nur TextebeneC belastbare SekundärquelleD berichtet Operating figures in fall 2003 against values at the mid-2002 go-live: forecast accuracy three months ahead 88% sell-through and 84% sell-in, up from 58% and 49% in summer 2002; inventory turns 26 in Q4 2003, up from 12 a year earlier; average on-hand inventory $23 million, down from $55 million; on-time delivery 75%, up from 35% (the earlier level matches, within reading error, the post-go-live low in Fig. 3, p. 442); excess and obsolescence costs practically zero in FY 2003 against an average of $3 million in FY 2000–2002; meetings down to two to four hours (p. 441): "Three-months-ahead forecast accuracy (ABS[sales-forecast]/forecast) for sell-through (sell-in) was 88% (84%)"; "up from 58% (49%) in the summer of 2002"; "inventory turns in Q4’03 were 26 (up from 12 the previous year), average on-hand inventory was $23 million (down from $55 million)"; "on-time delivery of orders was 75% (up from 35%)"; "Excess and obsolescence costs were practically zero in fiscal year 2003 (down from an average of $3 million for fiscal years 2000–2002)."; "by the fall of 2003 the meetings were lasting between two and four hours and conversations were cordial". One firm, two dates around a go-live, no comparison group.Oliva & Watson (2011)
- A A gegen die gedruckte Seite der Primärquelle geprüftB Primärquelle, nur TextebeneC belastbare SekundärquelleD berichtet In the second half of 2003 the statistical forecast was more accurate than the approved consensus forecast, yet the DMO leadership was reluctant to streamline the consensus process; the authors argue a significant fraction of the benefits came from alignment, and state Proposition IV (pp. 445, 446): "In fact, the DMO at Leitax had evidence that, for the second half of 2003, the statistical forecast was more accurate than the consensus forecast approved by the group."; "the DMO leadership was reluctant to streamline the process if it meant eliminating opportunities to engage participants through confrontation and validation of the forecast and resulting plan"; "it can be argued that a significant fraction of the reported benefits were less the result of informational and procedural quality than of the alignment resulting from an effective planning process"; "The pursuit of alignment in organizational planning can be more important than achieving particular levels of informational or procedural quality."Oliva & Watson (2011)
- A A gegen die gedruckte Seite der Primärquelle geprüftB Primärquelle, nur TextebeneC belastbare SekundärquelleD berichtet The authors' own limits: unobserved implementation dynamics, improved forecasting methodology and better management cannot be separated; forecasting performance and adherence to plans cannot be separated; the propositions are untested beyond one case (pp. 435, 437, 442, 446): "Although unobserved dynamics during the implementation of the changes in the organization could have influenced operational improvement"; "did not make clear whether performance and forecast accuracy improved solely because of the improved forecasting methodology, or also because the whole organization was being more effectively managed through a coordinated integration effort"; "In fact, during our analysis of the forecasting process, we found it difficult to determine whether the current performance in forecast accuracy was the result of the forecasting processes or of better adherence to the agreed plans."; "Finally, determining when our propositions hold remains an open research question, beyond the scope of a single case study." Repair 2026-11-13: the p. 435 span is quoted from "unobserved": "unobserved dynamics during the implementation of the changes in the organization could have influenced operational improvement".Oliva & Watson (2011)
- B A gegen die gedruckte Seite der Primärquelle geprüftB Primärquelle, nur TextebeneC belastbare SekundärquelleD berichtet The evidence base is four literature reviews (two on the same 55 papers) and one single-firm case; none of the reviews pools an effect on firm performance, and the 2012 survey evidence read from its own table is four associations of mixed sign and significance; the earlier reviews' most encouraging statement (the process matters even under contradictory incentives) rests on the same case; neither review reports a test of escalation rules; the mechanisms practitioners stress most (formalization, socialization) are those academic studies examine least; the four reviews overlap (2012b on 2012a's papers; three of the 2014 review's surveys among 2012b's four; the 2022 review shares two authors with the 2012 pair and counts the earlier reviews among its studies); Kreuter's positive-effect list mixes optimisation models with observations; formalization and socialization, discussed by about two thirds of practitioner articles, appear in four and five of the 24 academic articles; S&OP as a demand-shaping tool for commercial targets is, by Tuomikangas and Kaipia's account, largely without conceptual or empirical literatureAuthor synthesis
Aus dem Beitrag
Revenue Operations & KI
Was ist Sales and Operations Planning (S&OP)?
In S&OP beschließen Vertrieb, Operations und Finanzen mindestens monatlich aus einer Nachfragesicht ohne Kapazitätsgrenzen einen lieferbaren Plan.
Den Beitrag lesenDiese Abbildung gehört zu einem Essay: Die Zahlen stehen hier, das Argument dort.
Zitieren oder einbetten
Verwandte Abbildungen
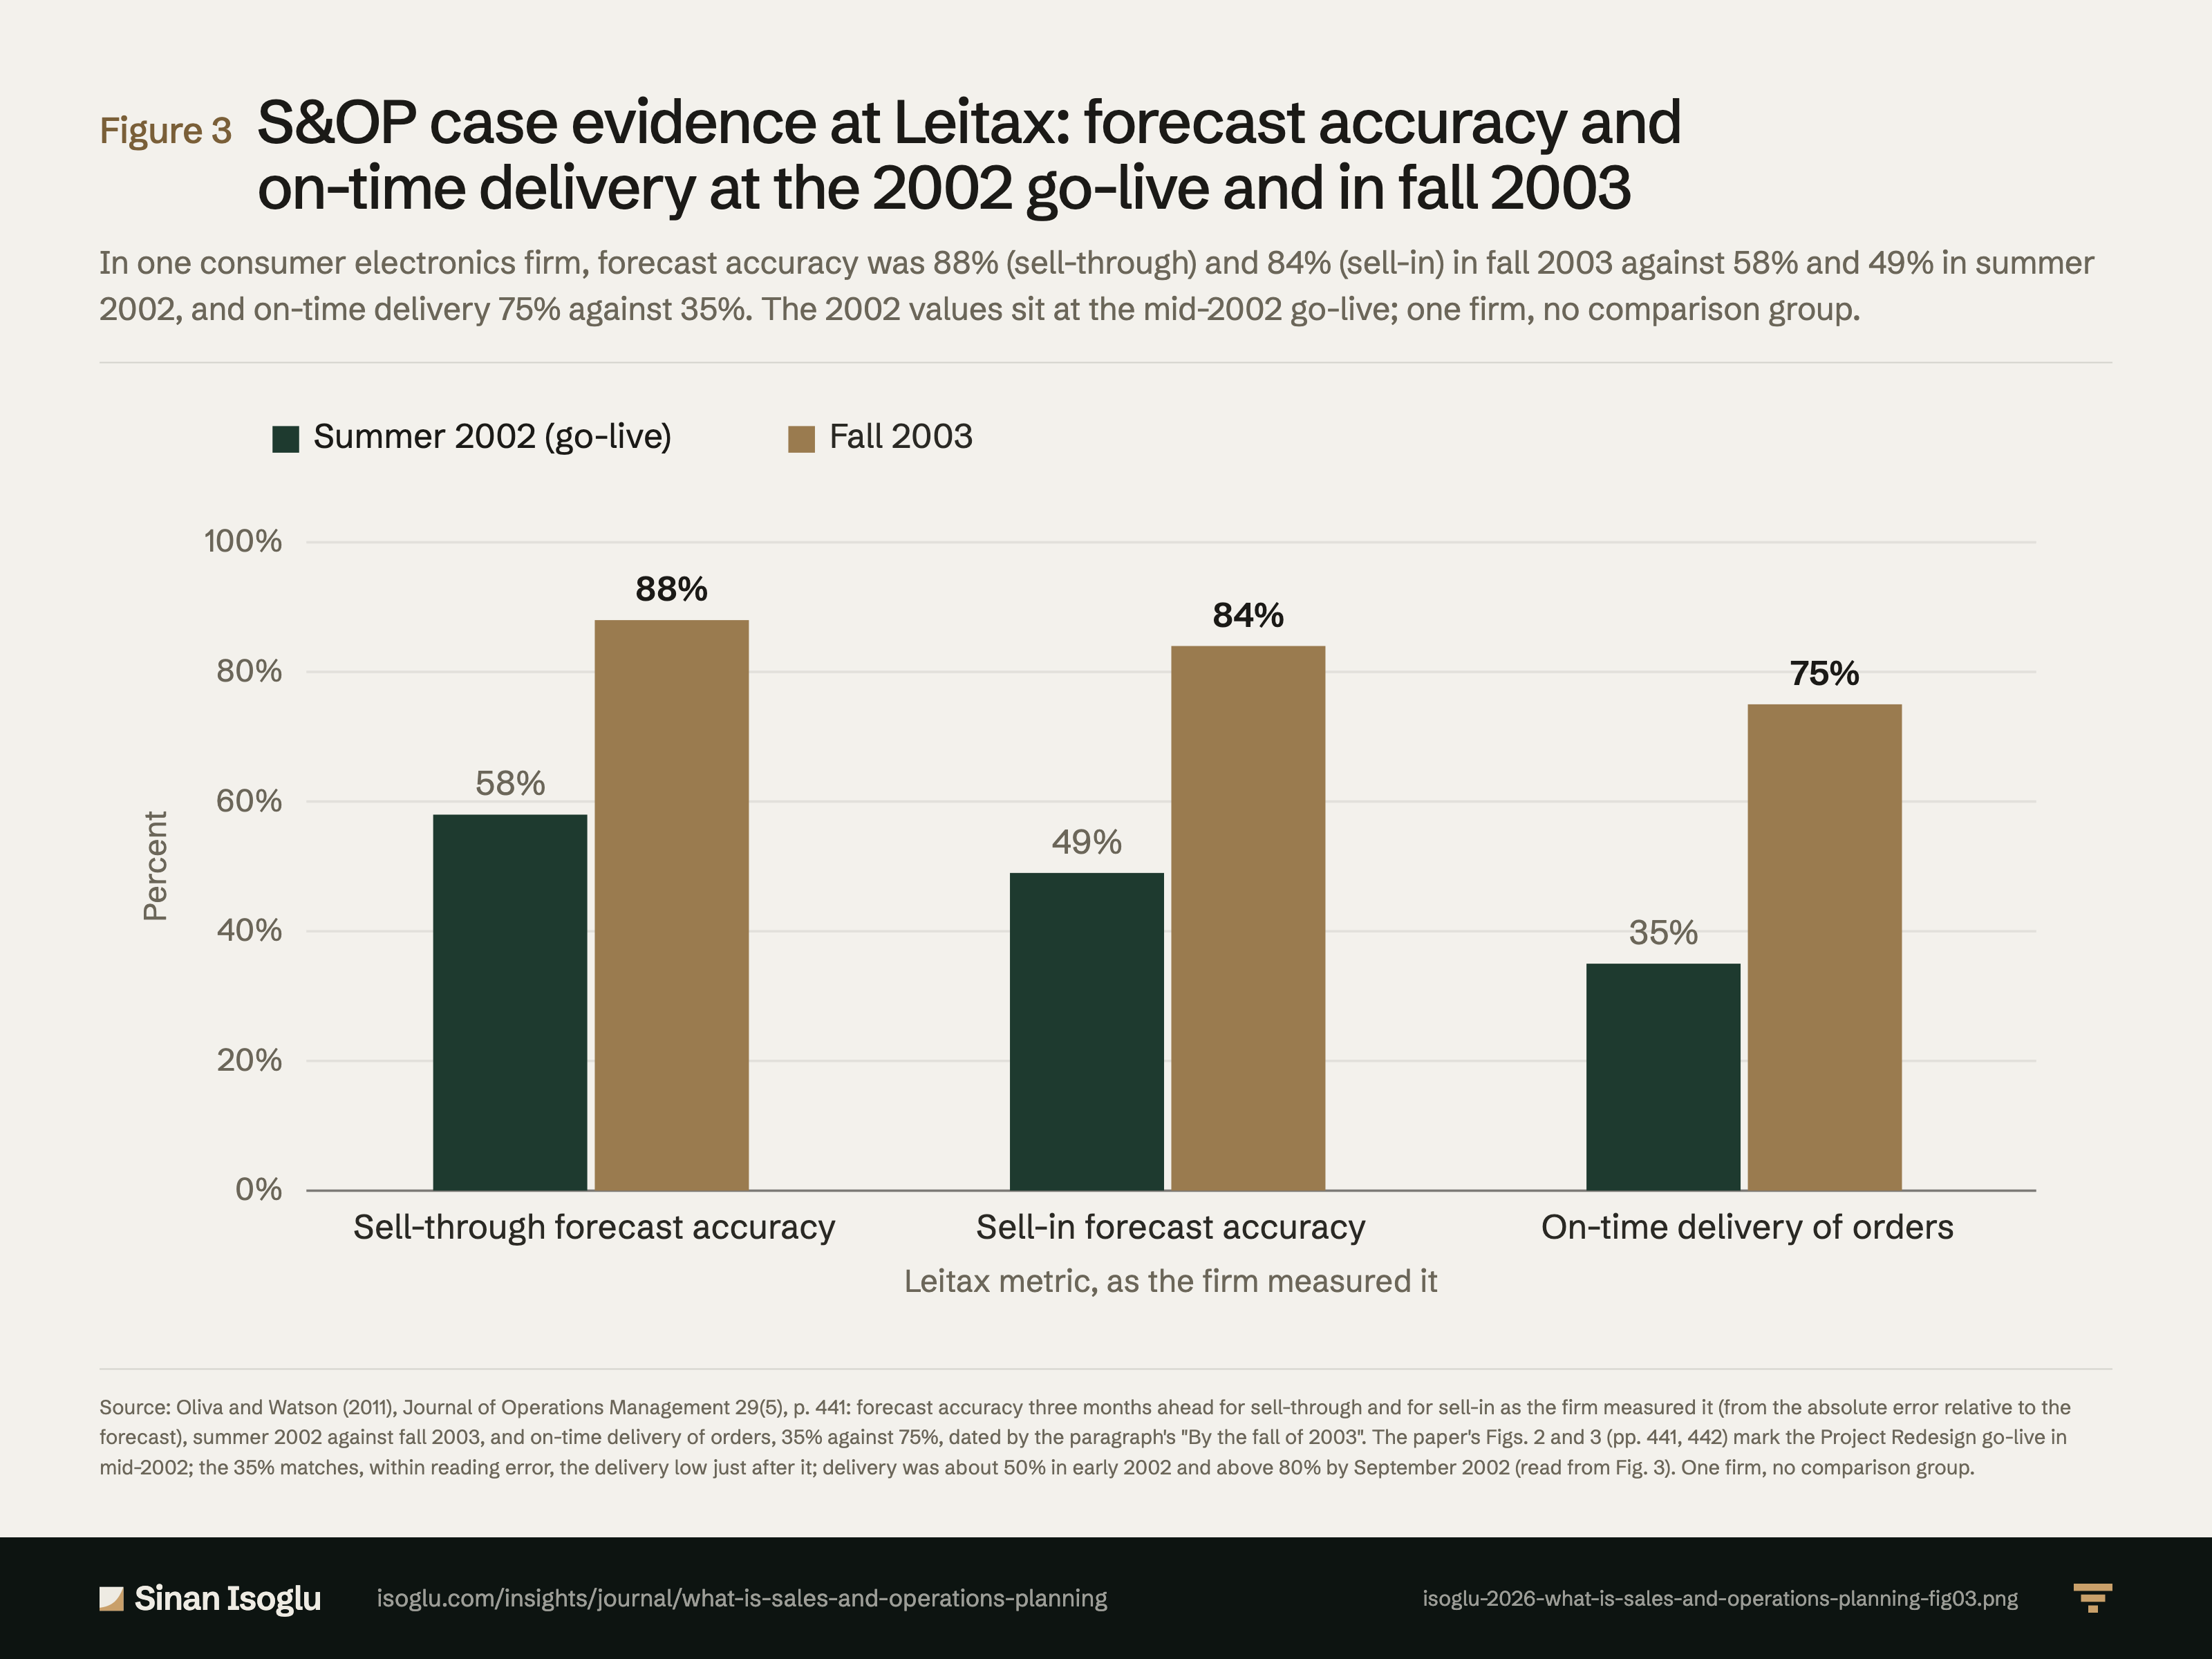
Abbildung 3Grafik
S&OP-Fallevidenz bei Leitax: Prognosegenauigkeit und Liefertreue zum Start 2002 und im Herbst 2003
Was ist Sales and Operations Planning (S&OP)?
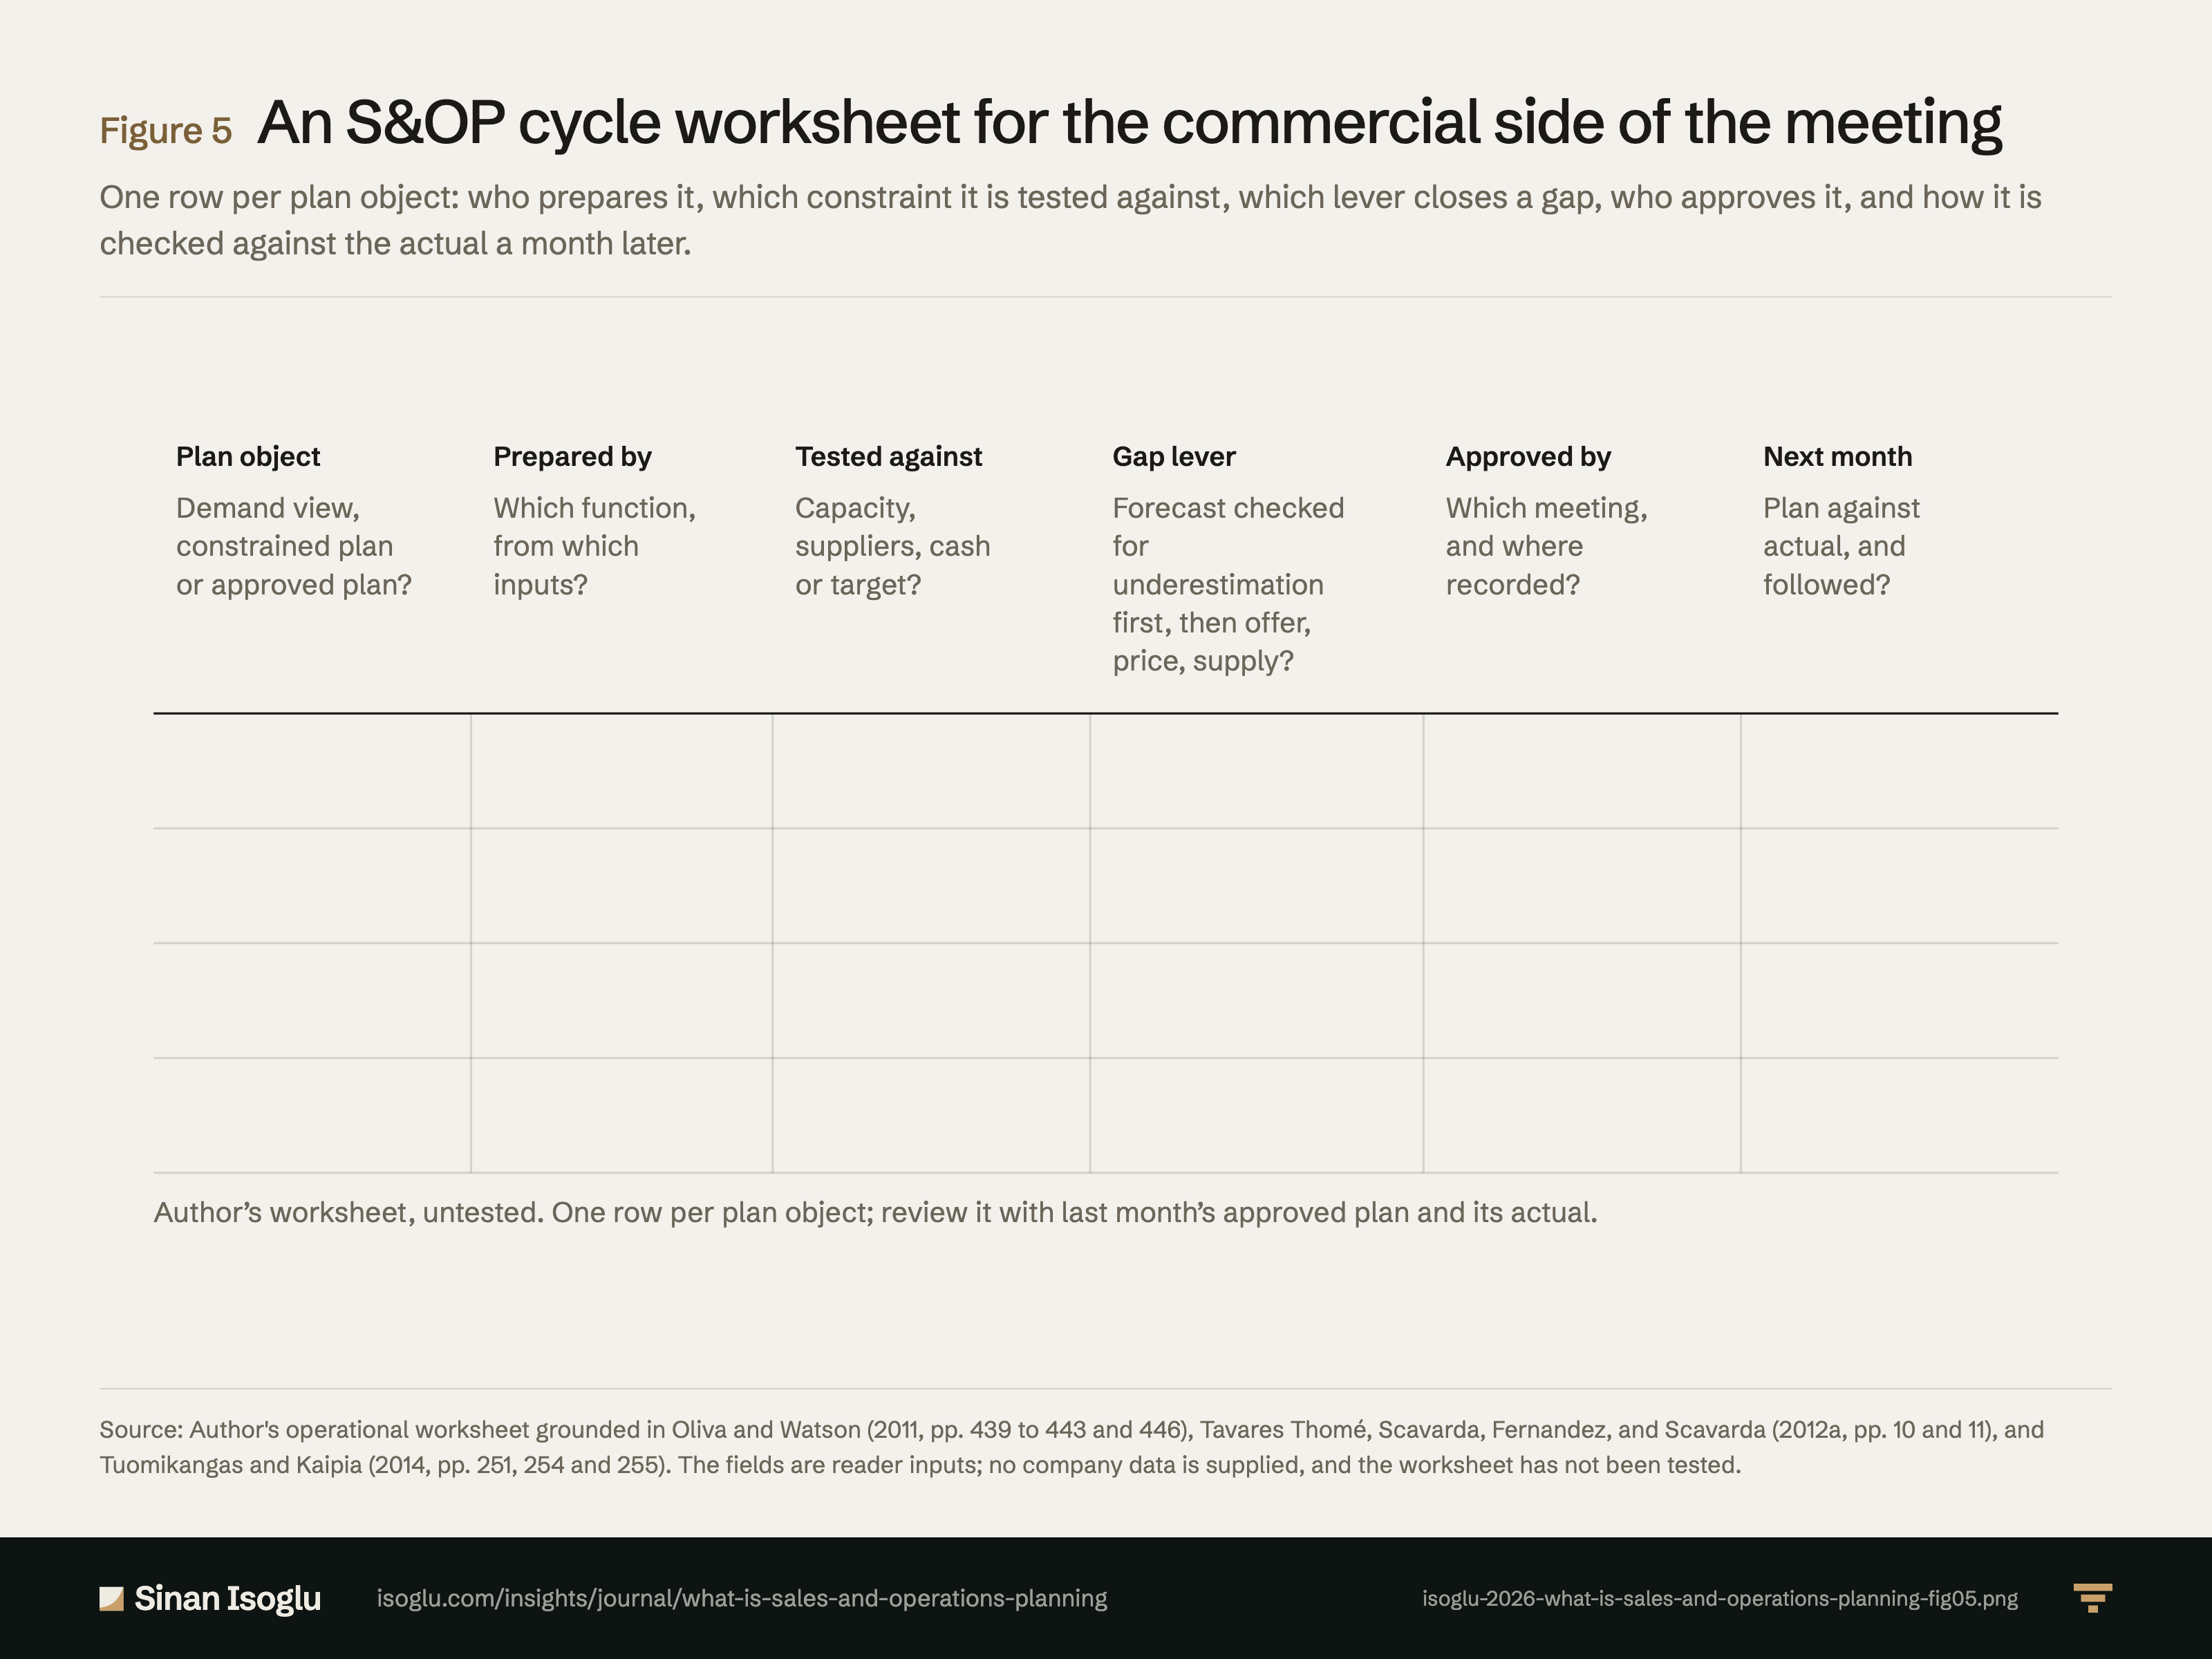
Abbildung 5Grafik
Ein Prüfblatt für den S&OP-Zyklus aus Sicht des Vertriebs
Was ist Sales and Operations Planning (S&OP)?
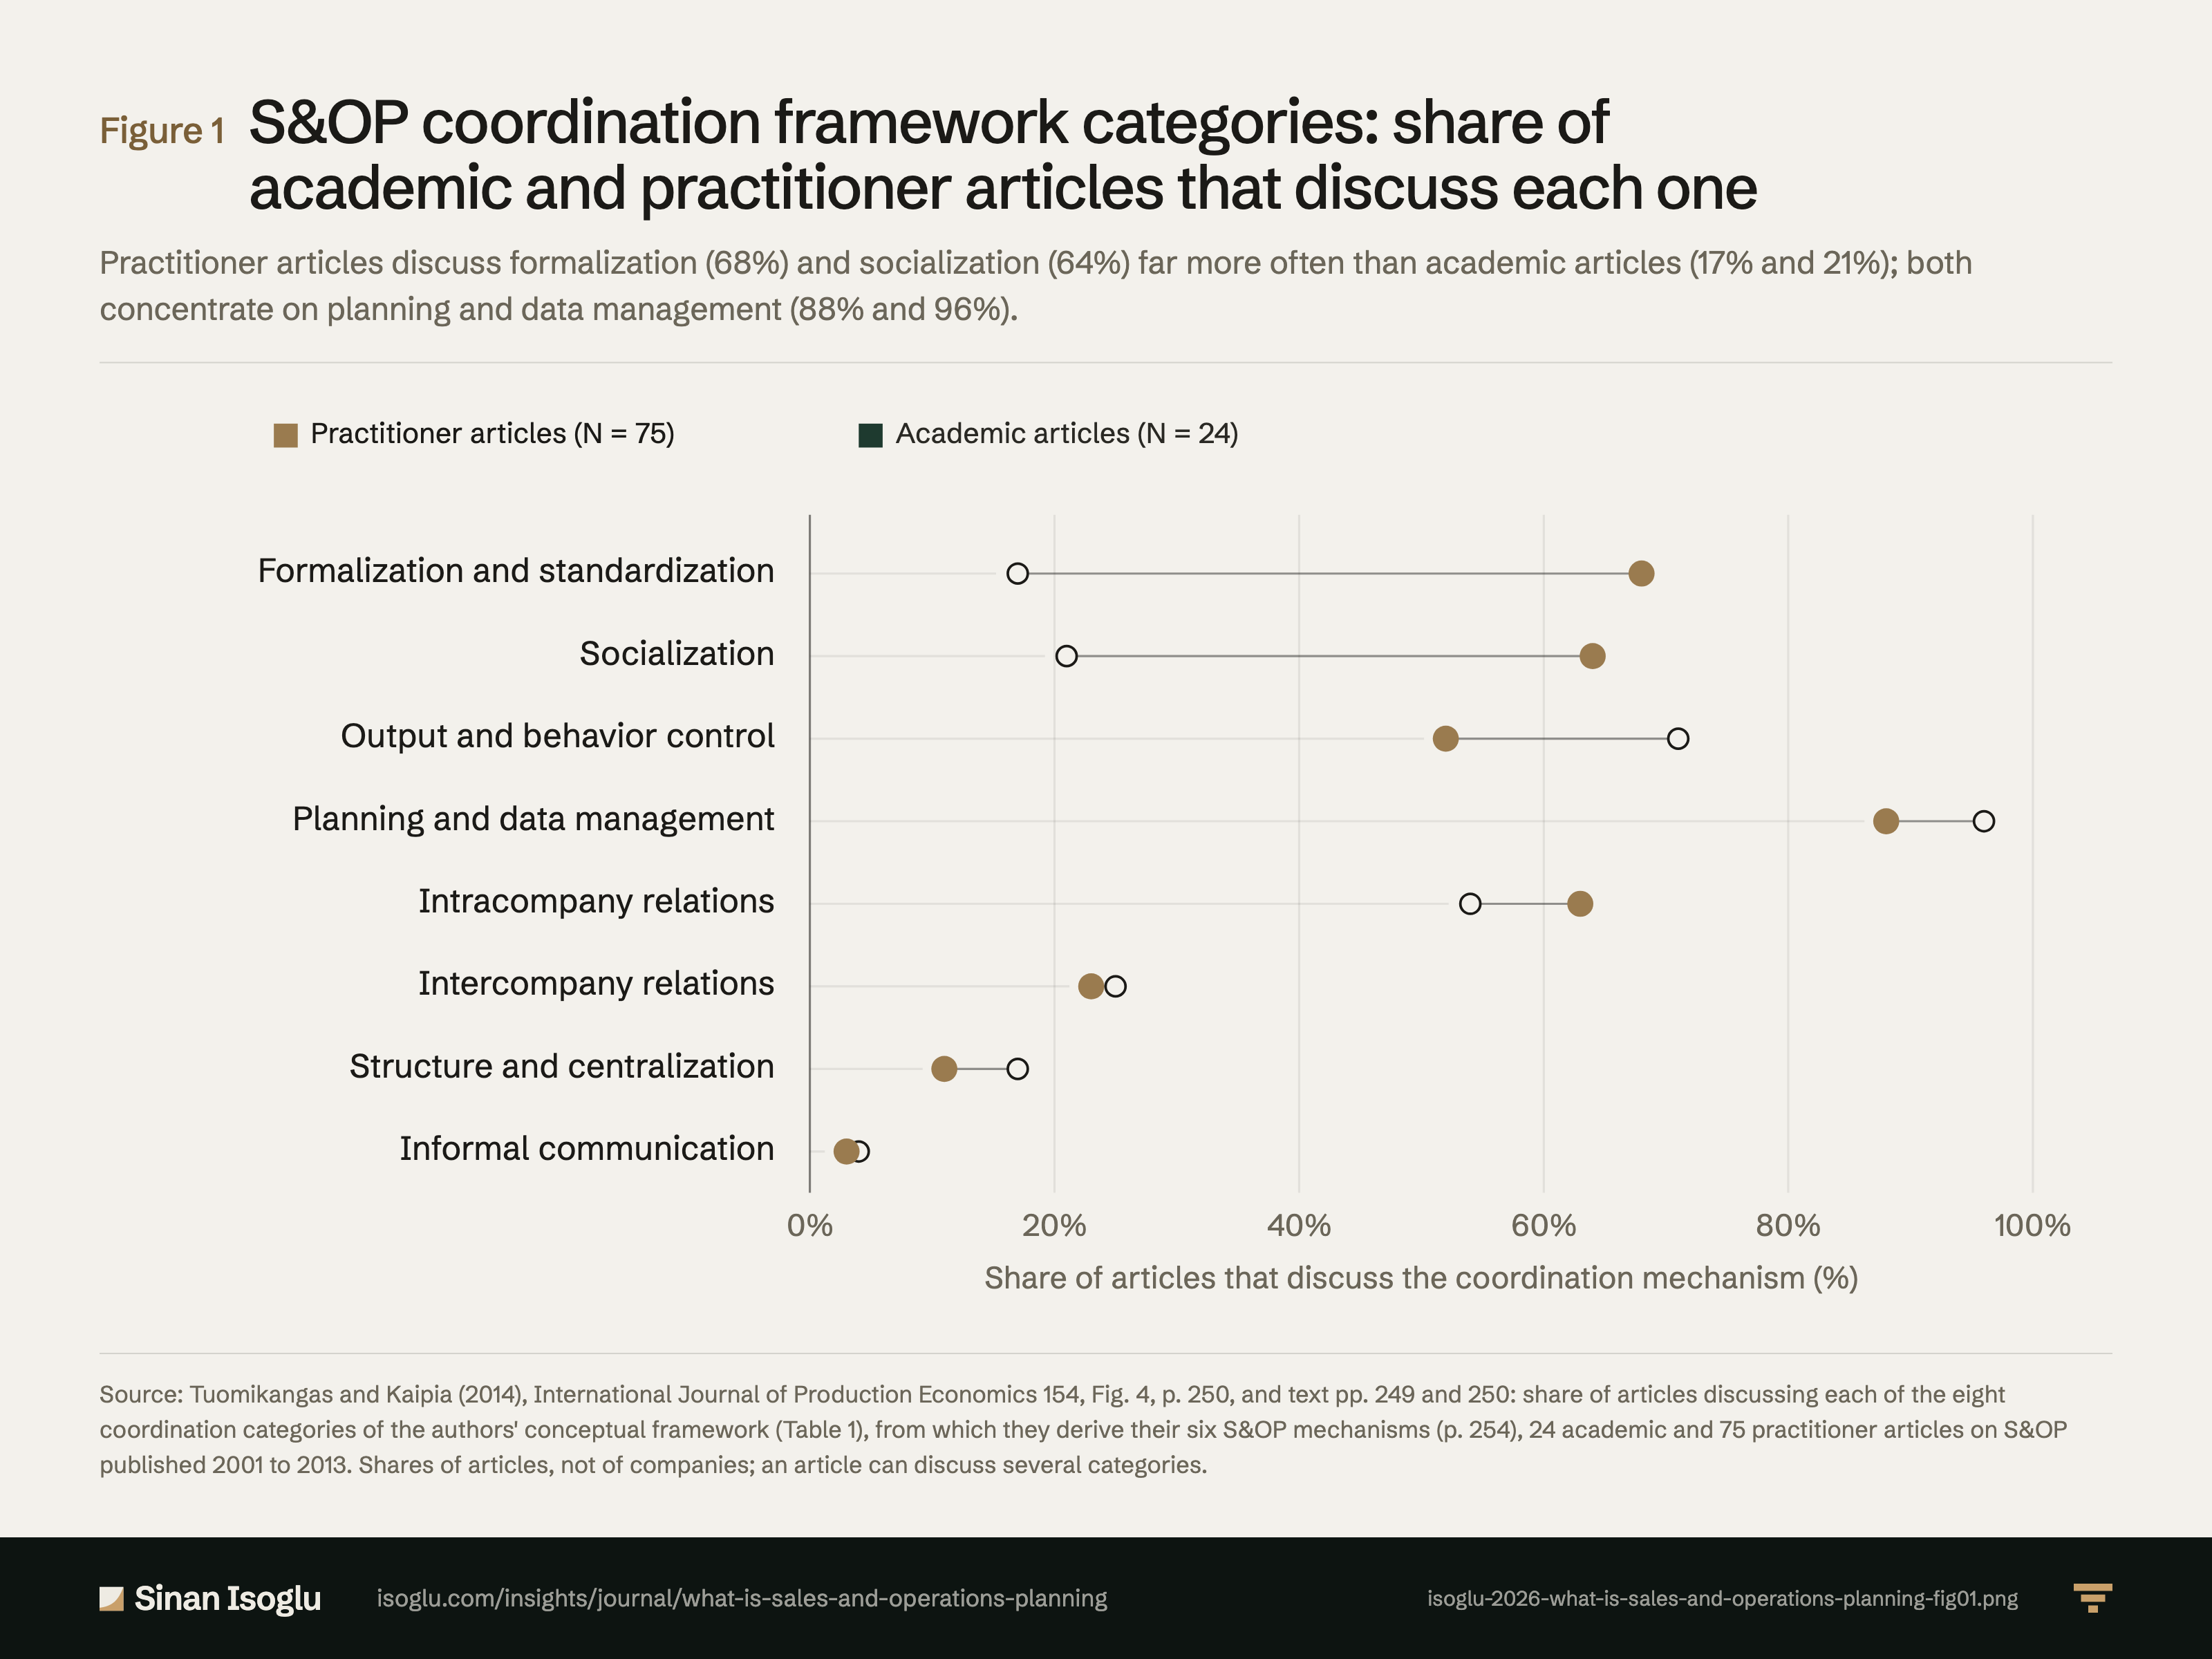
Abbildung 1Grafik
S&OP-Koordinationskategorien: Anteil wissenschaftlicher und praxisorientierter Artikel, die jede behandeln
Was ist Sales and Operations Planning (S&OP)?
Kontakt
Schicken Sie die Frage, an der Sie arbeiten.
Forschung, ein Gastvortrag oder eine Frage aus der Praxis.