Tabelle 1Aus „Kundenbindung sollte nach Profit gerankt werden, nicht nur nach Churn“
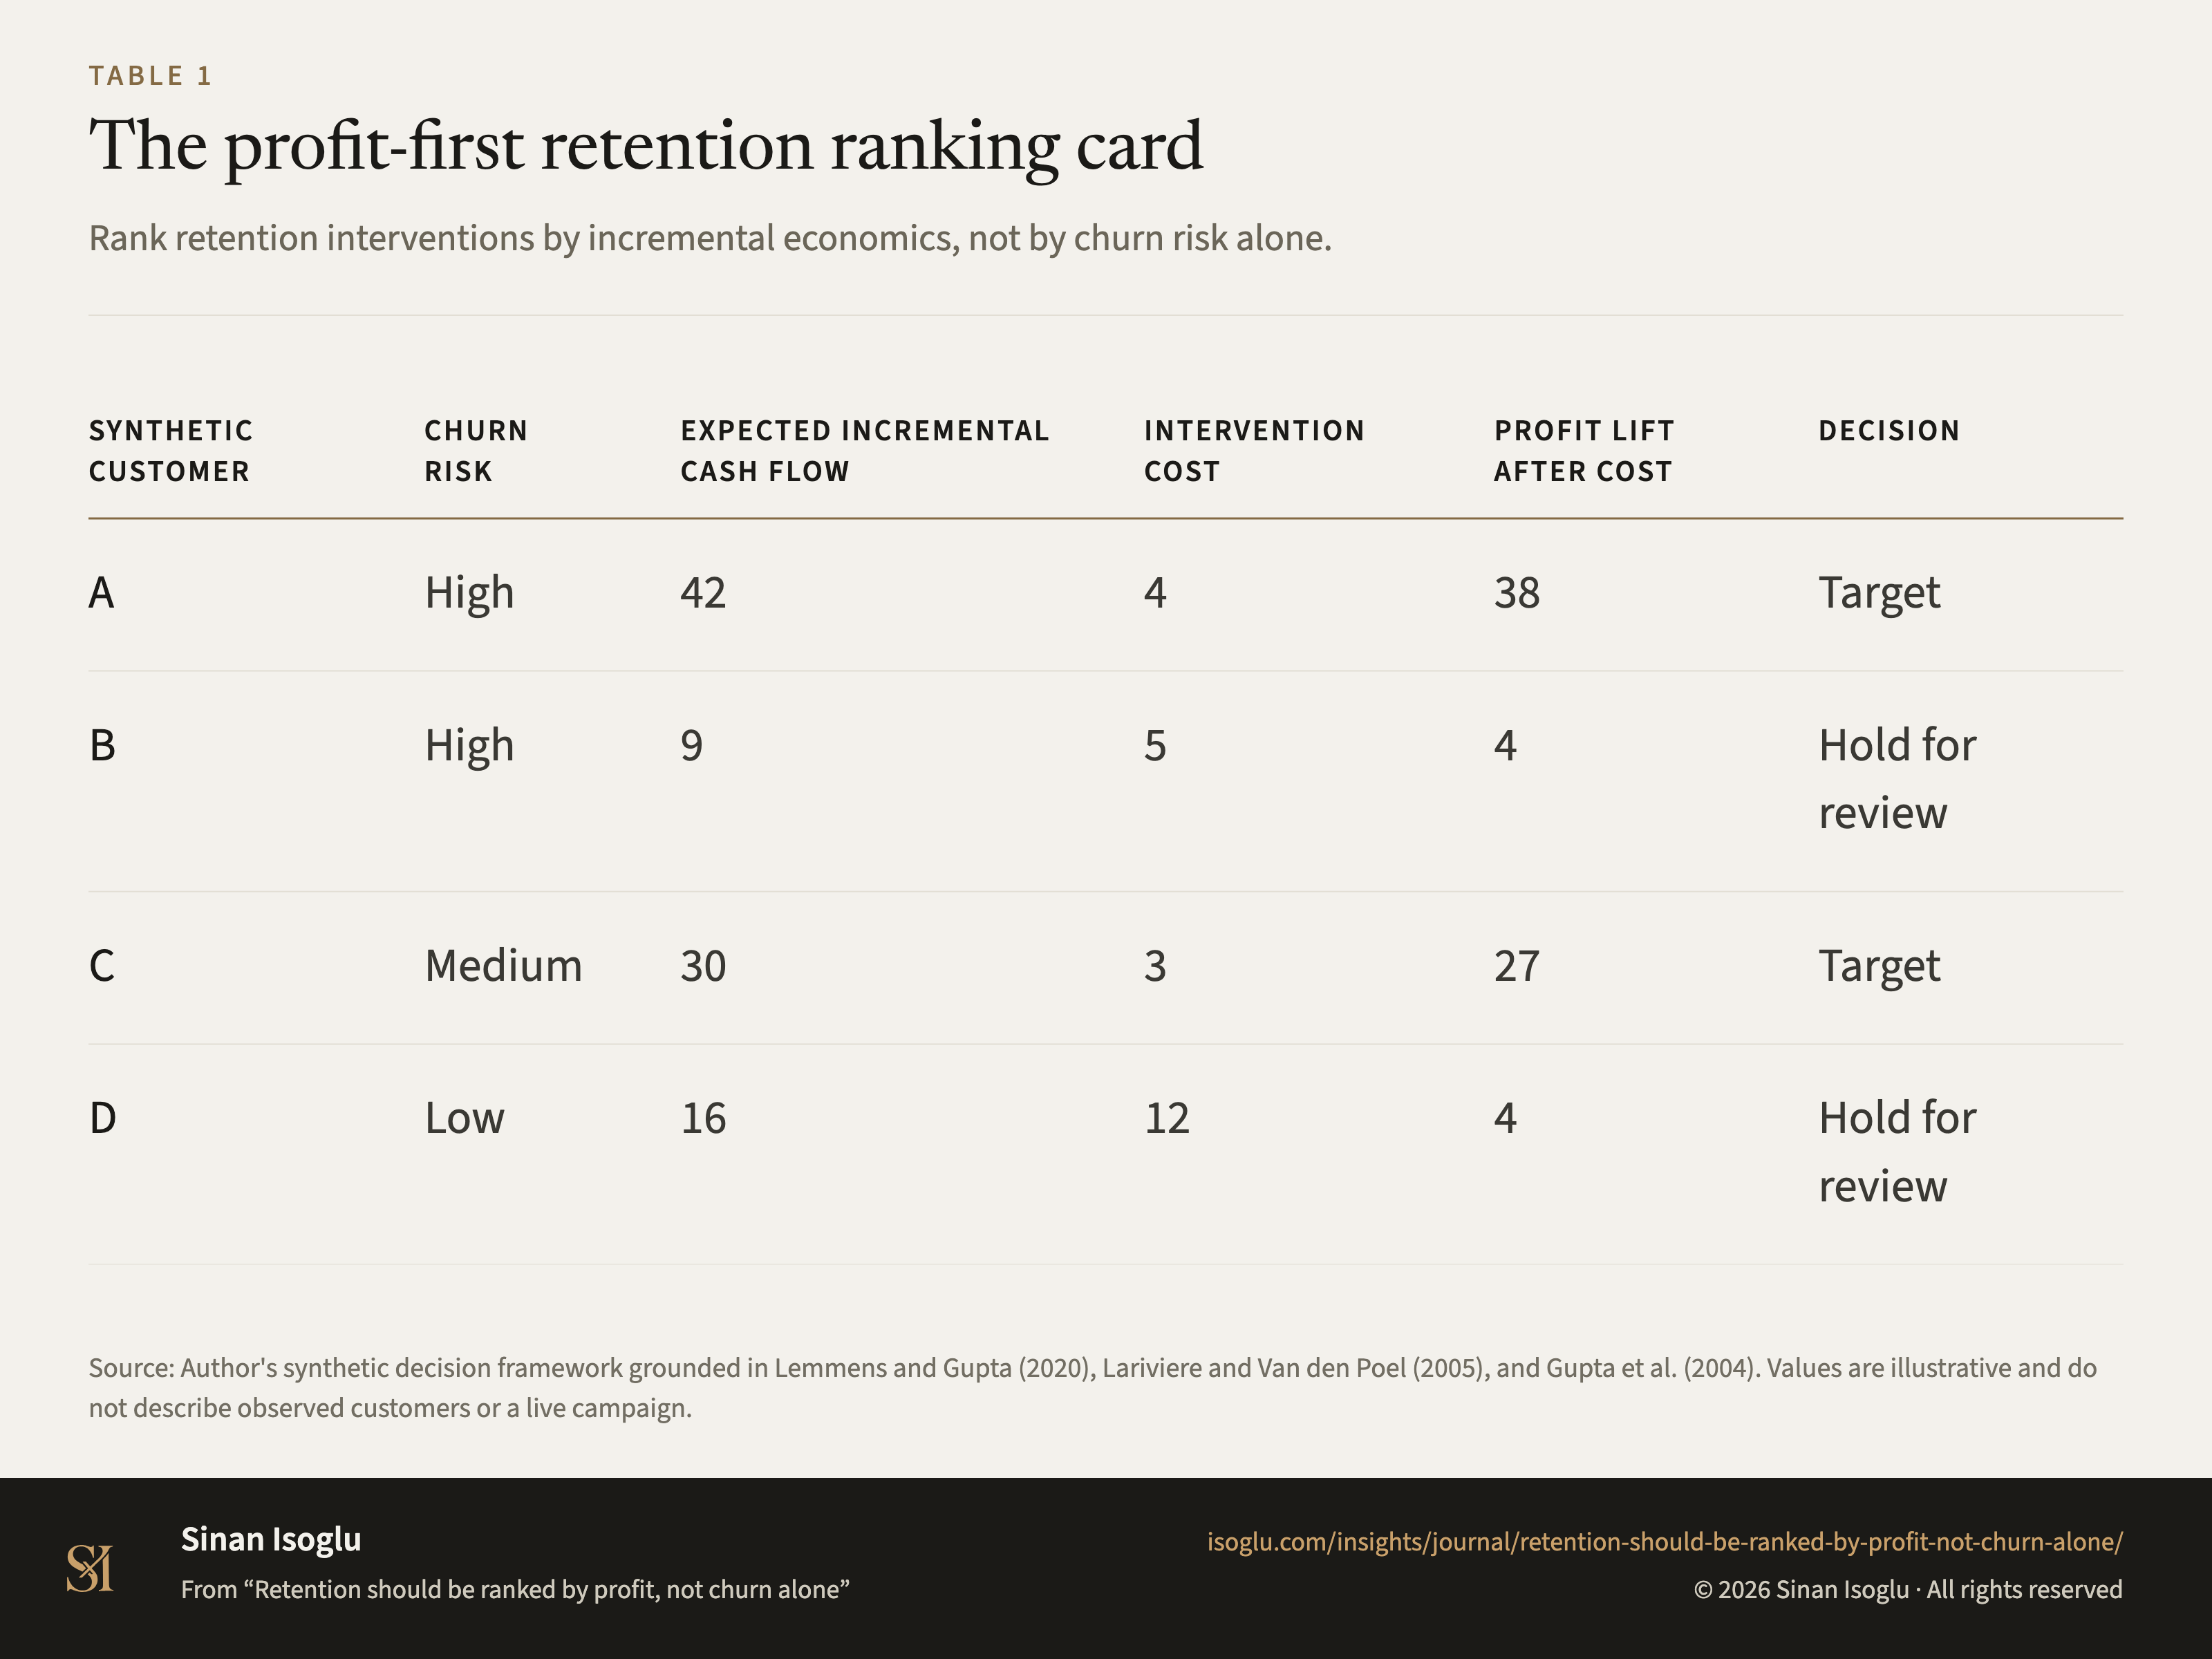
Die profitbasierte Kundenbindungskarte
Richten Sie Kundenbindungsinterventionen nach inkrementeller Ökonomie aus, nicht allein nach Churn-Risiko.
Tabelle 1Die profitbasierte Kundenbindungskarte
| Synthetischer Kunde | Churn-Risiko | Erwarteter inkrementeller Cashflow | Interventionskosten | Profit Lift nach Kosten | Entscheidung |
|---|---|---|---|---|---|
| A | Hoch | 42 | 4 | 38 | Ziel |
| B | Hoch | 9 | 5 | 4 | Prüfen |
| C | Mittel | 30 | 3 | 27 | Ziel |
| D | Niedrig | 16 | 12 | 4 | Prüfen |
Bei breiten Tabellen horizontal wischen oder scrollen.
Quelle: Synthetischer Entscheidungsrahmen des Autors auf Grundlage von Lemmens und Gupta (2020), Lariviere und Van den Poel (2005) sowie Gupta et al. (2004). Die Werte sind illustrativ und beschreiben keine beobachteten Kunden oder eine laufende Kampagne.
Quelle und Evidenz
Jede Zeile nennt eine Aussage zu dieser Abbildung, ihre Quelle und die Art ihrer Prüfung.
- A LG20-C1 The method, in the authors' words: "defining a profit-based loss function to predict, for each customer, the financial impact of a retention intervention"Lemmens & Gupta. (2020)
- A LG20-C2 The ranking rule is incremental and net of cost: "customers are ranked based on the incremental impact of the intervention on churn and postcampaign cash flows, after accounting for the cost of the intervention", rather than by churn risk or response alone.Lemmens & Gupta. (2020)
- A LG20-C3 "Two field experiments affirm that this approach leads to significantly more profitable campaigns than competing models", and the method also "provides a method to optimize the" size of the campaign. Two experiments, not a survey of practiceLemmens & Gupta. (2020)
- A LVP05-C1 Three outcomes, one sample: "three important measures of customer outcome next buy partial defection and customers profitability evolution", over "a real life sample of 100 000 customers taken from the data warehouse of a large european financial services company"Lariviere & Van den Poel. (2005)
- A LVP05-C3 The variables do not transfer between outcomes: "the same set of variables have a different impact on buying versus defection versus profitability behavior", with past customer behaviour "more important to generate repeat purchasing and favorable profitability evolutions"Lariviere & Van den Poel. (2005)
- A GLS04-C2 The sensitivity is theirs and it is asymmetric: "a 1% improvement in retention, margin, or acqui"sition cost "improves firm value by 5%, 1%, and .1%, respectively"Gupta, Lehmann & Stuart. (2004)
- A GLS04-C3 Five firms, public data: the method is demonstrated "by using publicly available data for five firms", and retention outweighs the discount rate, since "a 1% improvement in retention has almost five times greater impact on firm value than a 1% change in discount rate or cost of capital"Gupta, Lehmann & Stuart. (2004)
Prüfgrade: A, gegen die gedruckte Seite der Primärquelle geprüft · B, Primärquelle, nur Textebene · C, belastbare Sekundärquelle · D, berichtet.
Aus dem Beitrag
Wachstum, das sich potenziert
Kundenbindung sollte nach Profit gerankt werden, nicht nur nach Churn
Hohes Churn-Risiko ist kein Kundenwert: Ranken Sie Kundenbindung nach inkrementellem Effekt, Interventionskosten, Cashflow und Kampagnengröße.
Den Beitrag lesenDiese Abbildung gehört zu einem Essay: Die Zahlen stehen hier, das Argument dort.
Zitieren oder einbetten
Verwandte Abbildungen
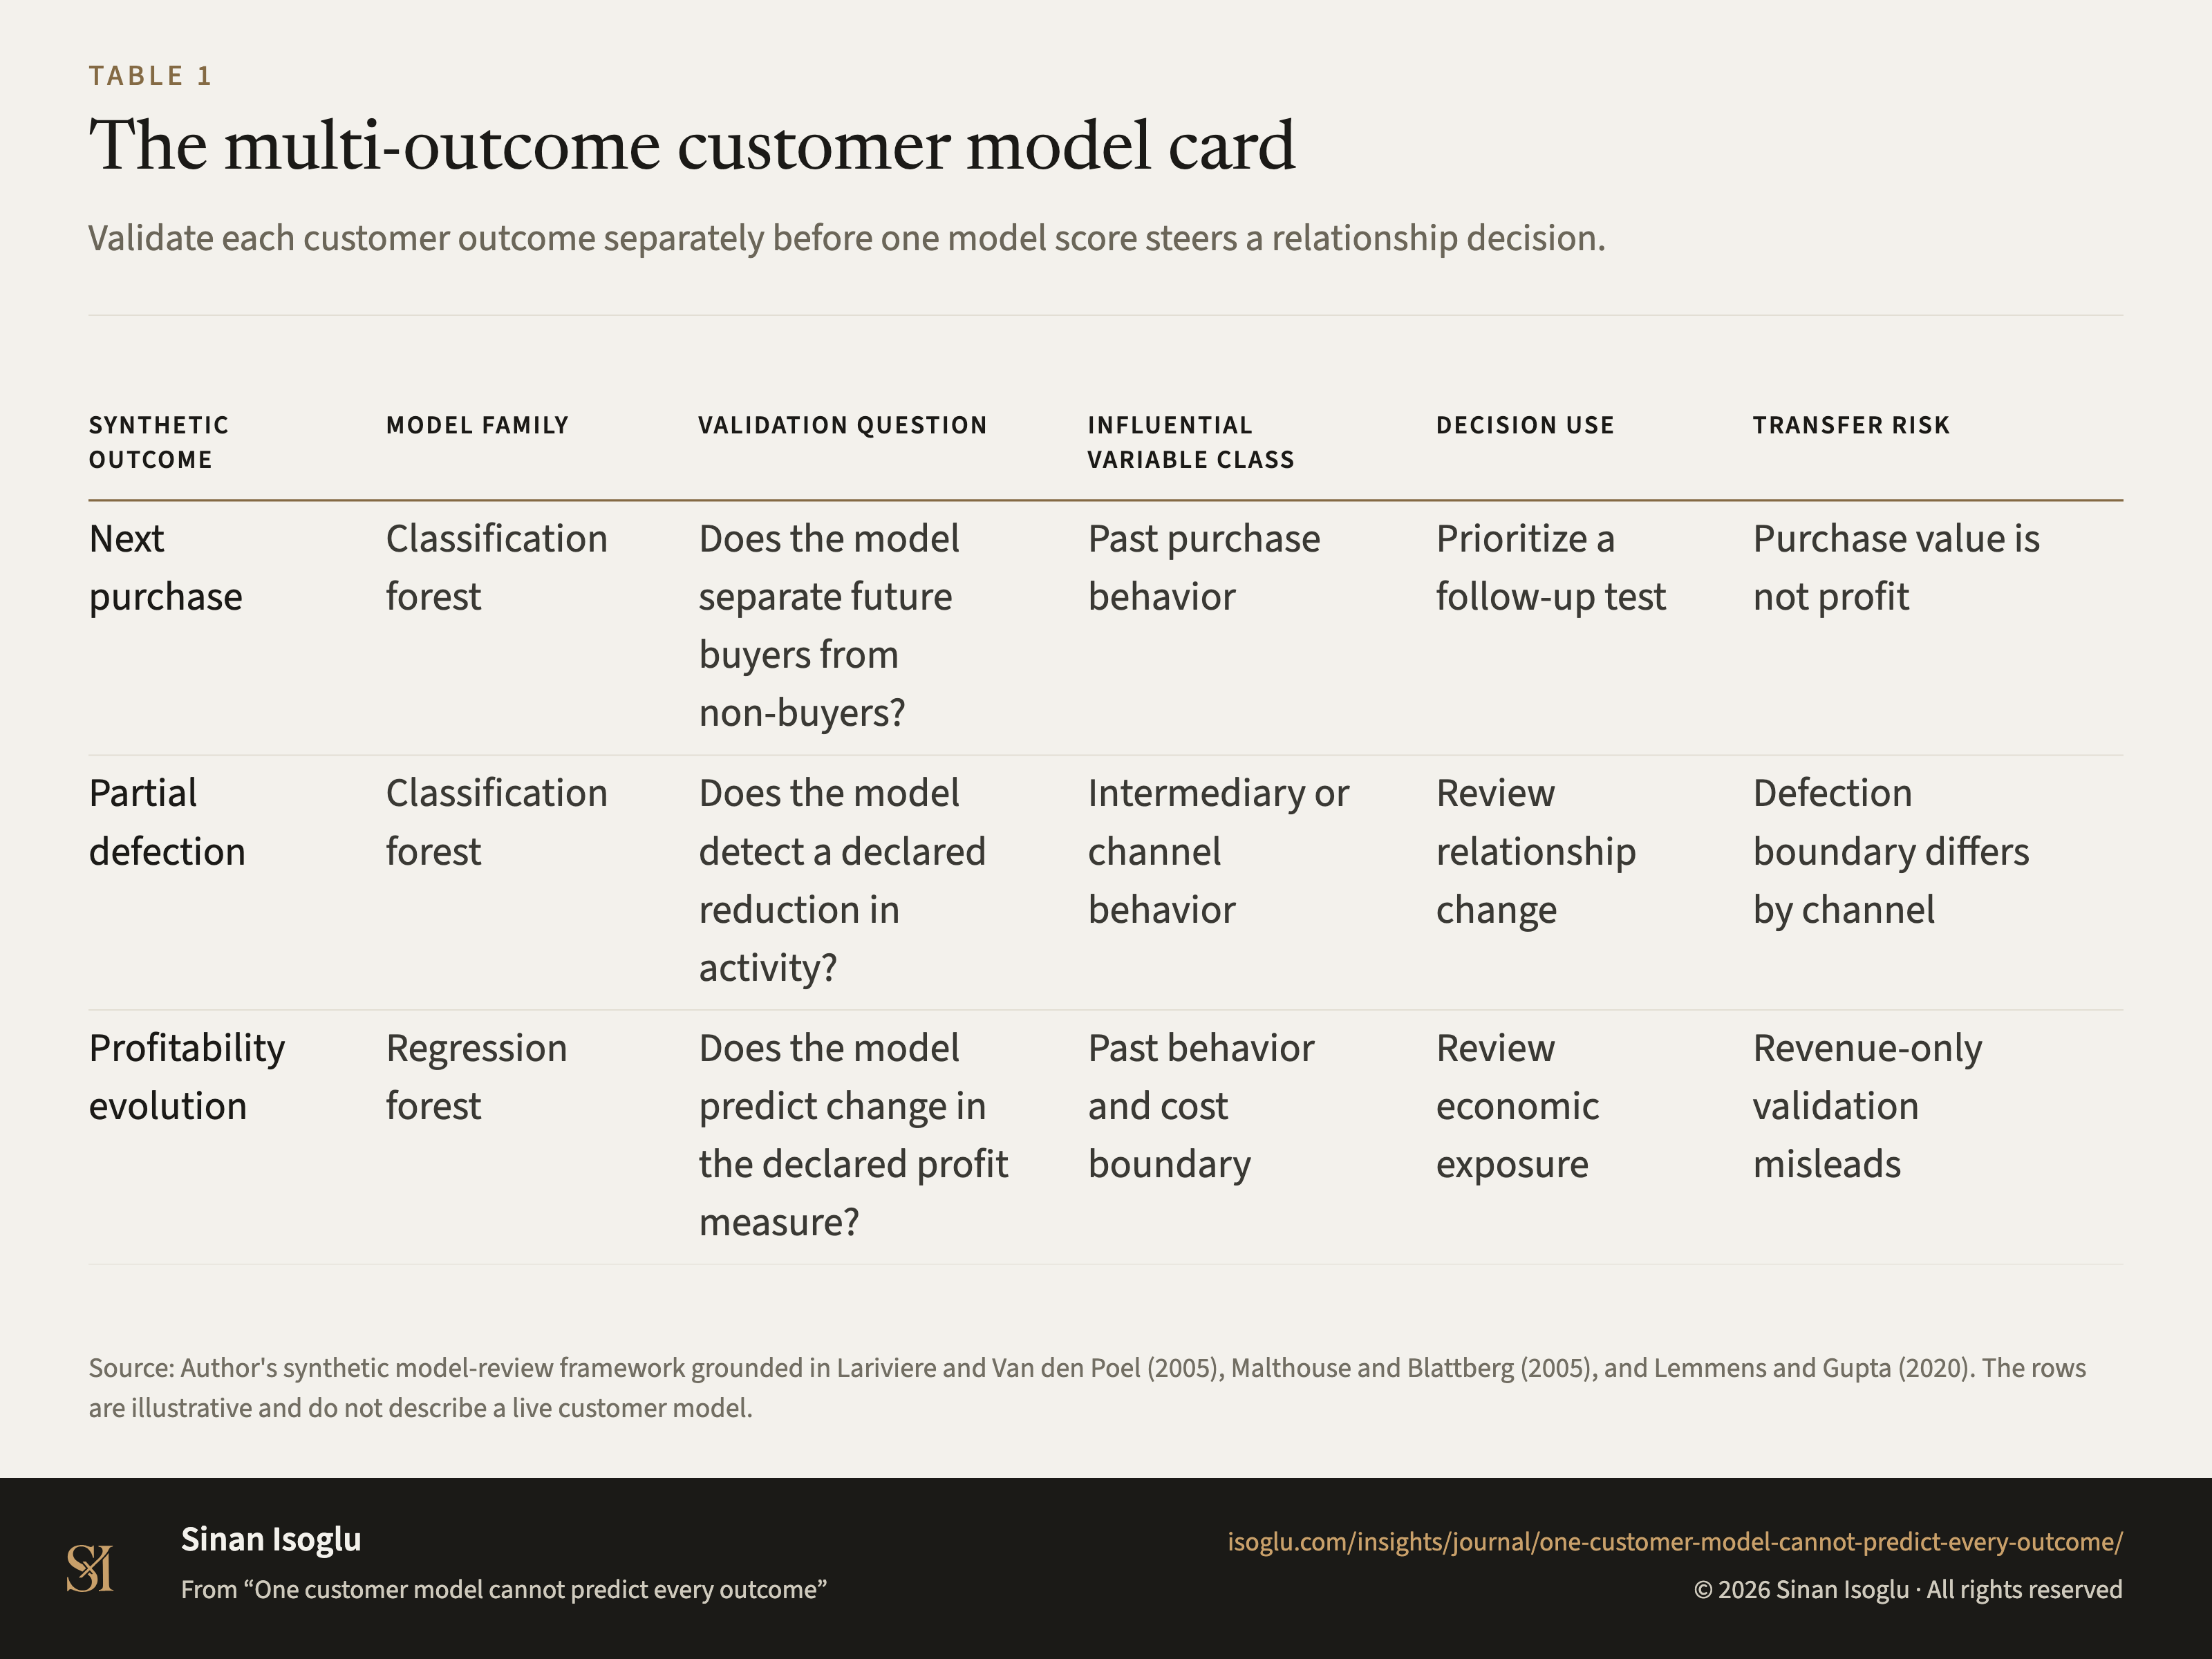
Tabelle 1Tabelle
Die Multi-Outcome-Kundenmodellkarte
Ein Kundenmodell kann nicht jedes Ergebnis prognostizieren
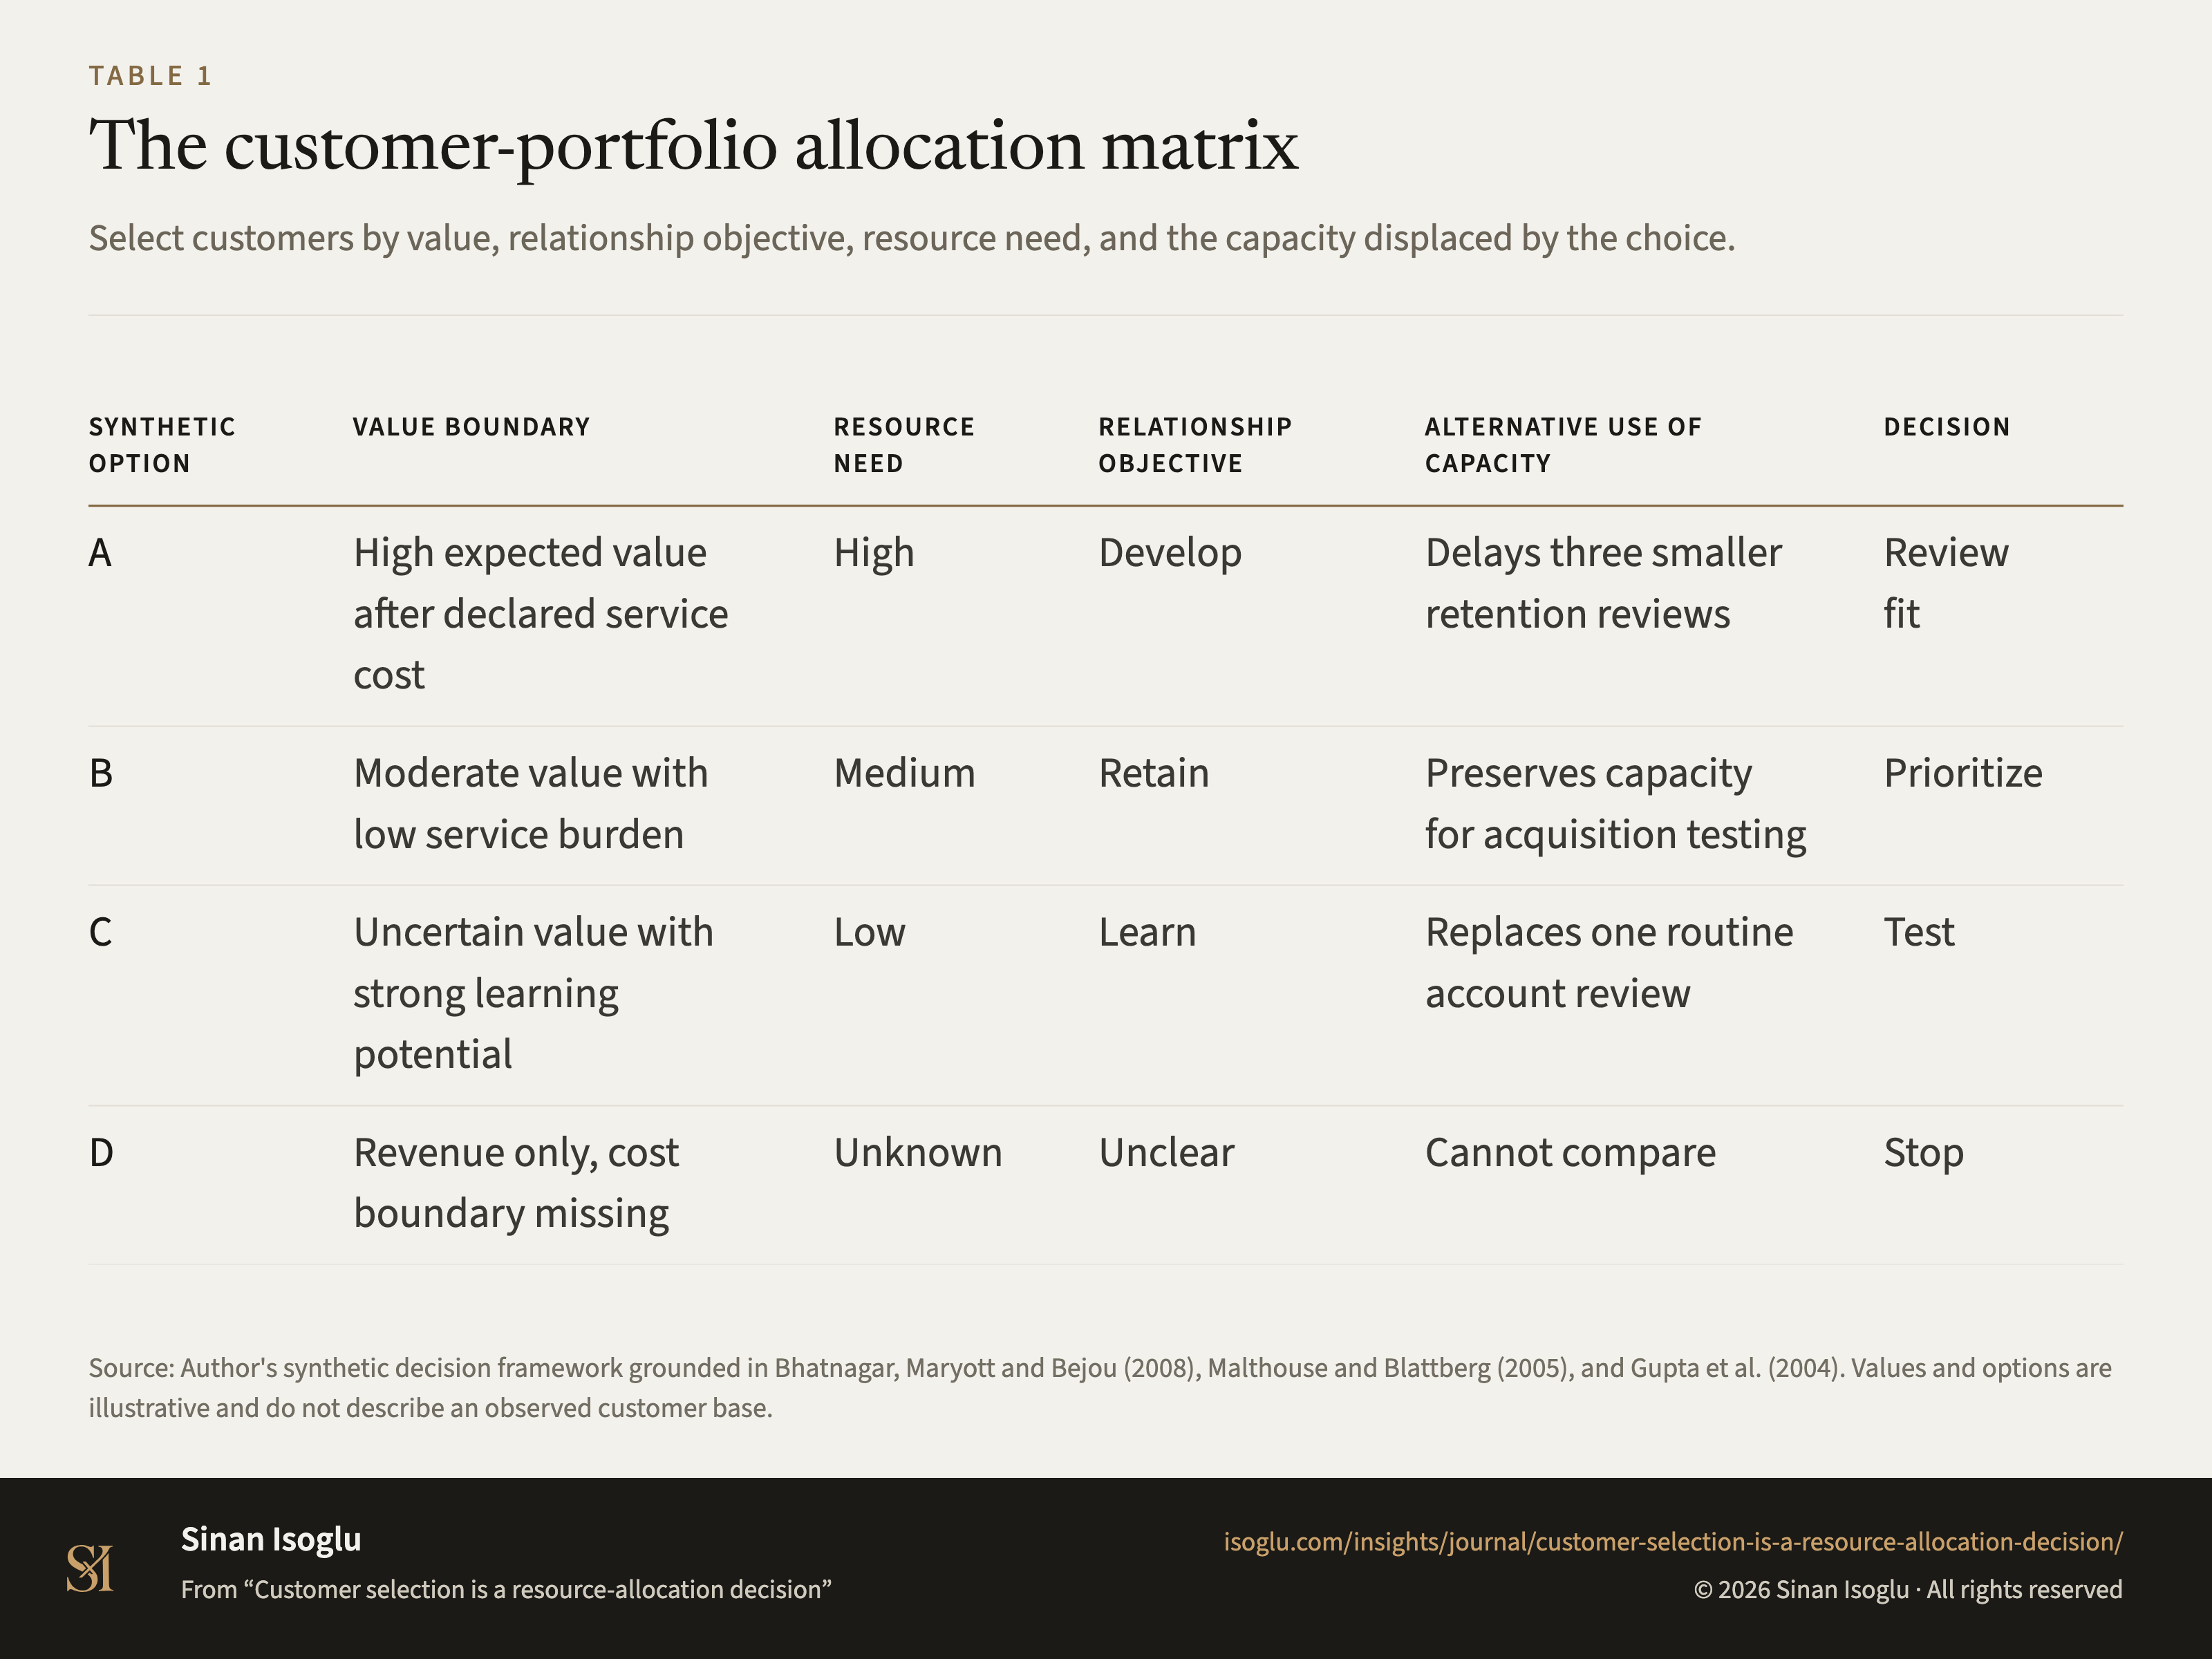
Tabelle 1Tabelle
Die Portfoliomatrix für Kundenallokation
Kundenauswahl ist eine Ressourcenallokationsentscheidung
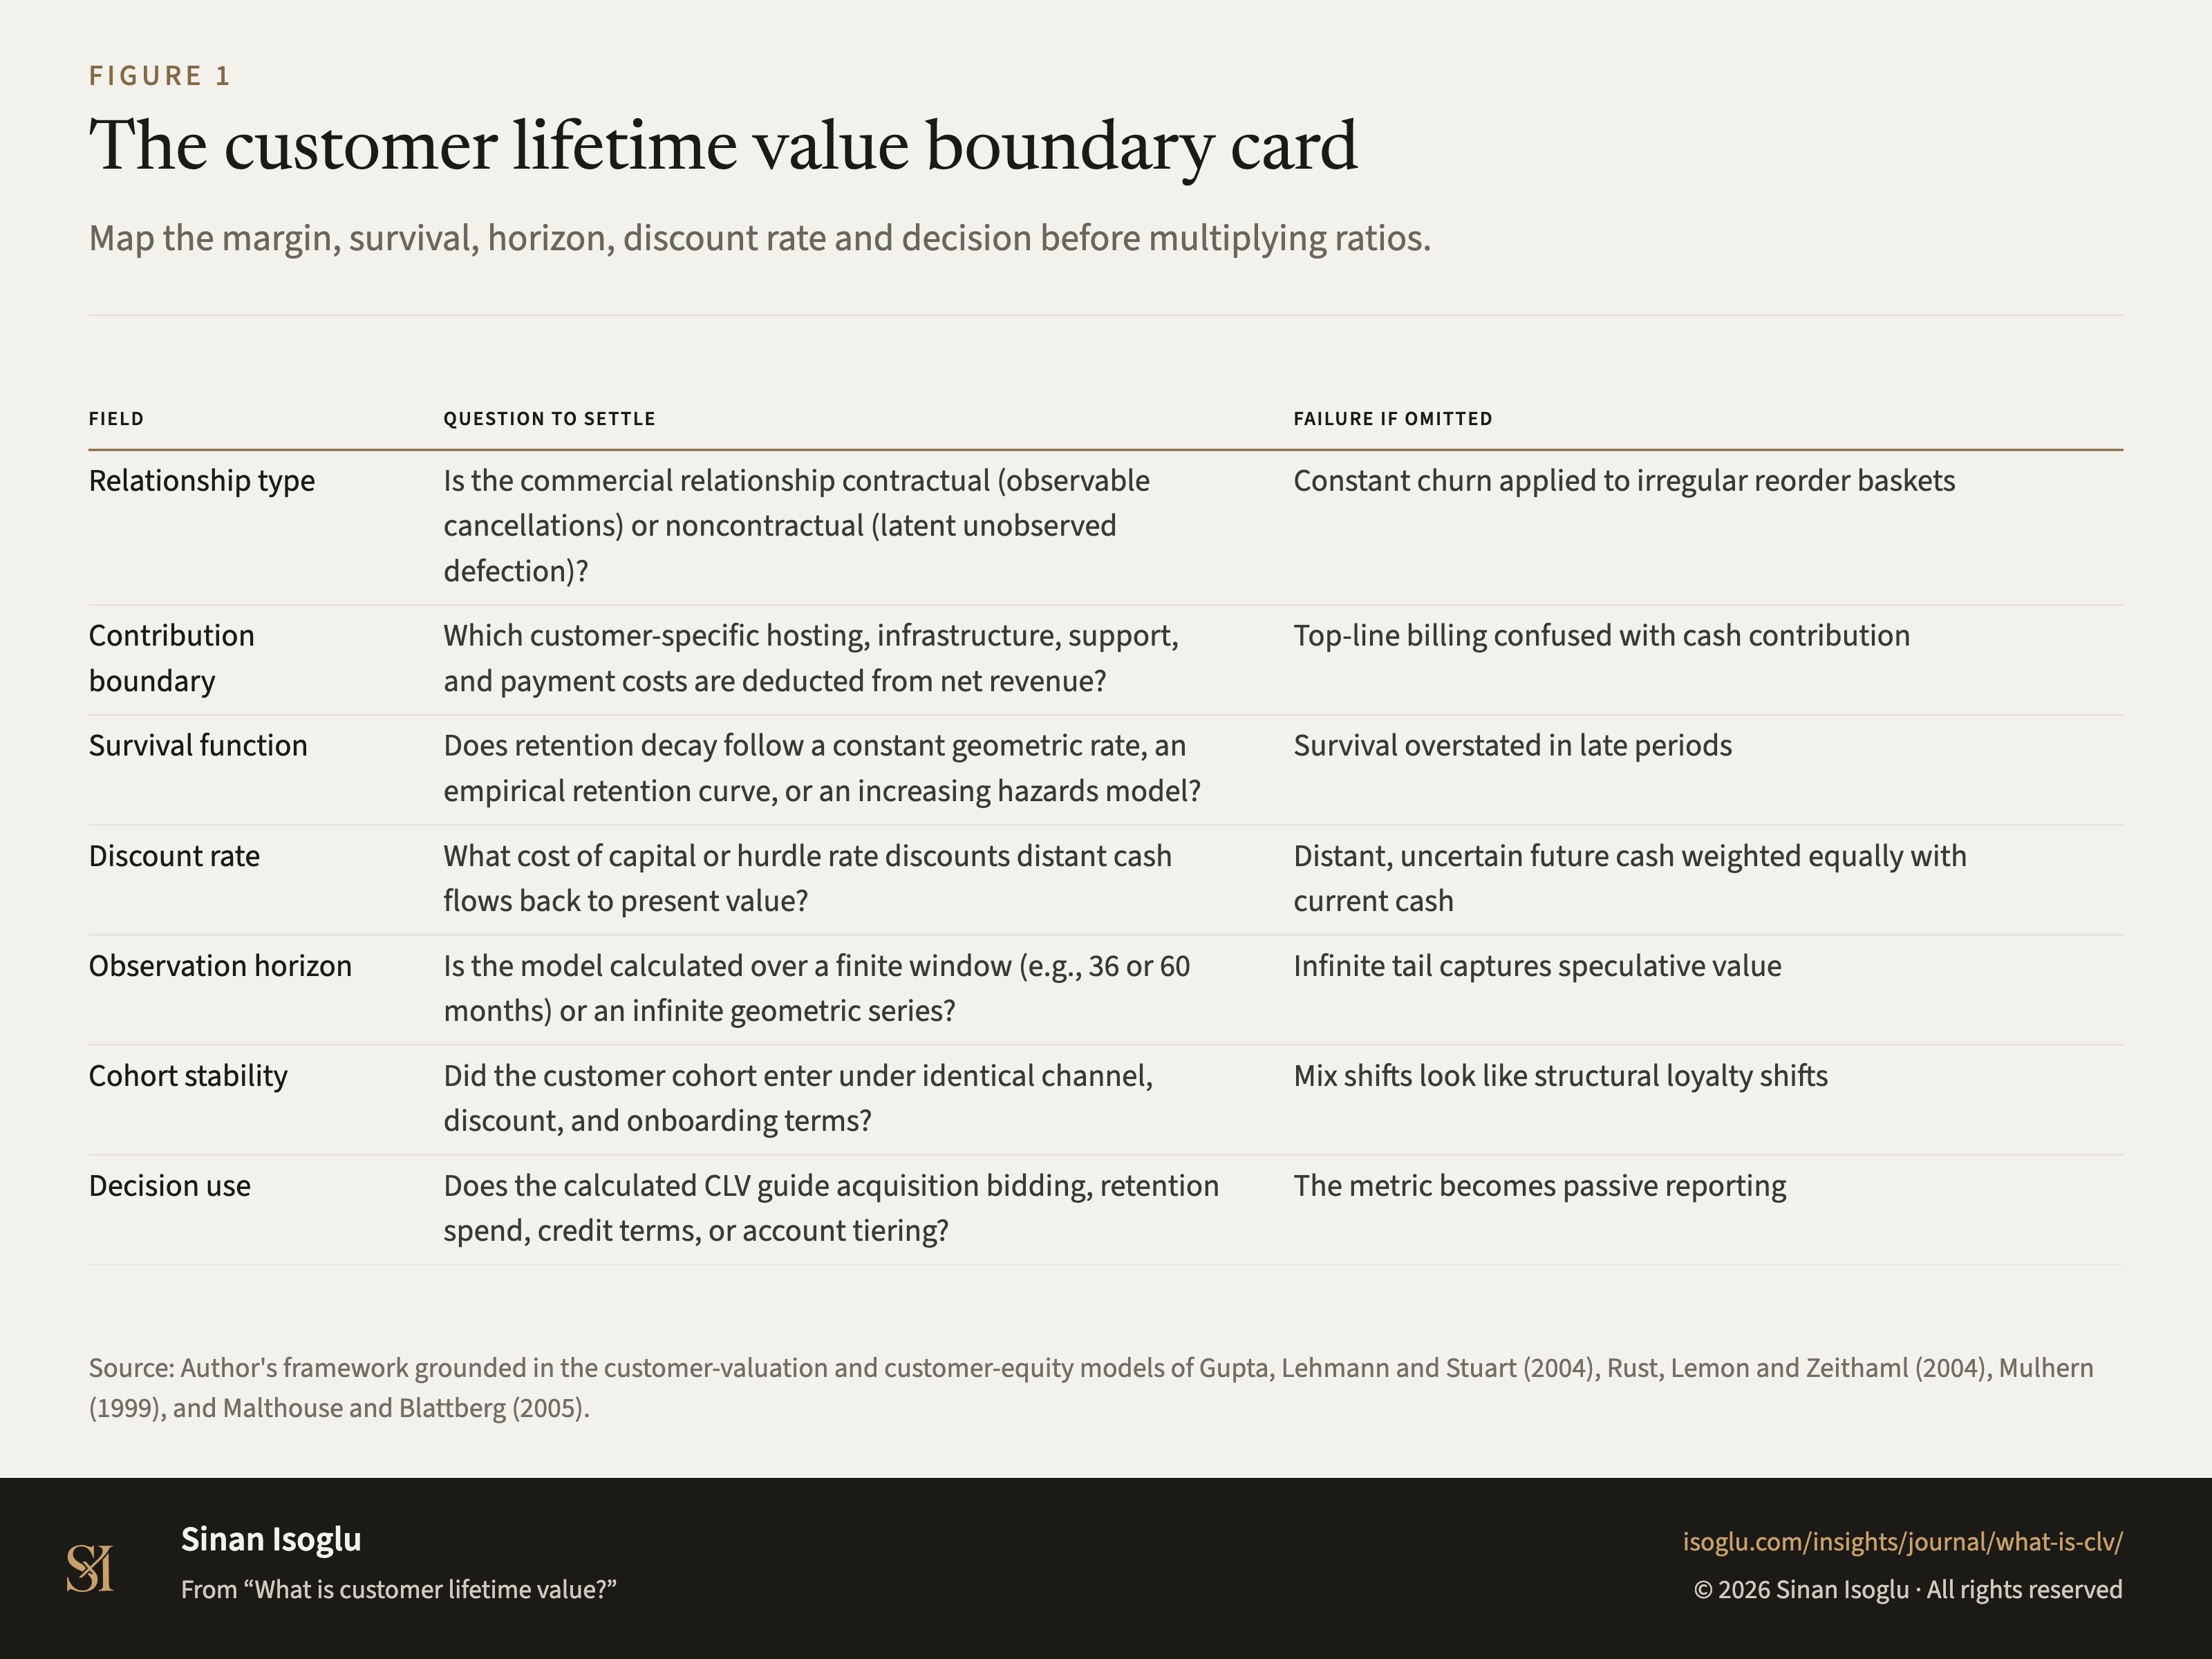
Abbildung 1Grafik
Die CLV-Abgrenzungskarte
Was ist Customer Lifetime Value?
Kontakt
Schicken Sie die Frage, an der Sie arbeiten.
Forschung, ein Gastvortrag oder eine Frage aus der Praxis.