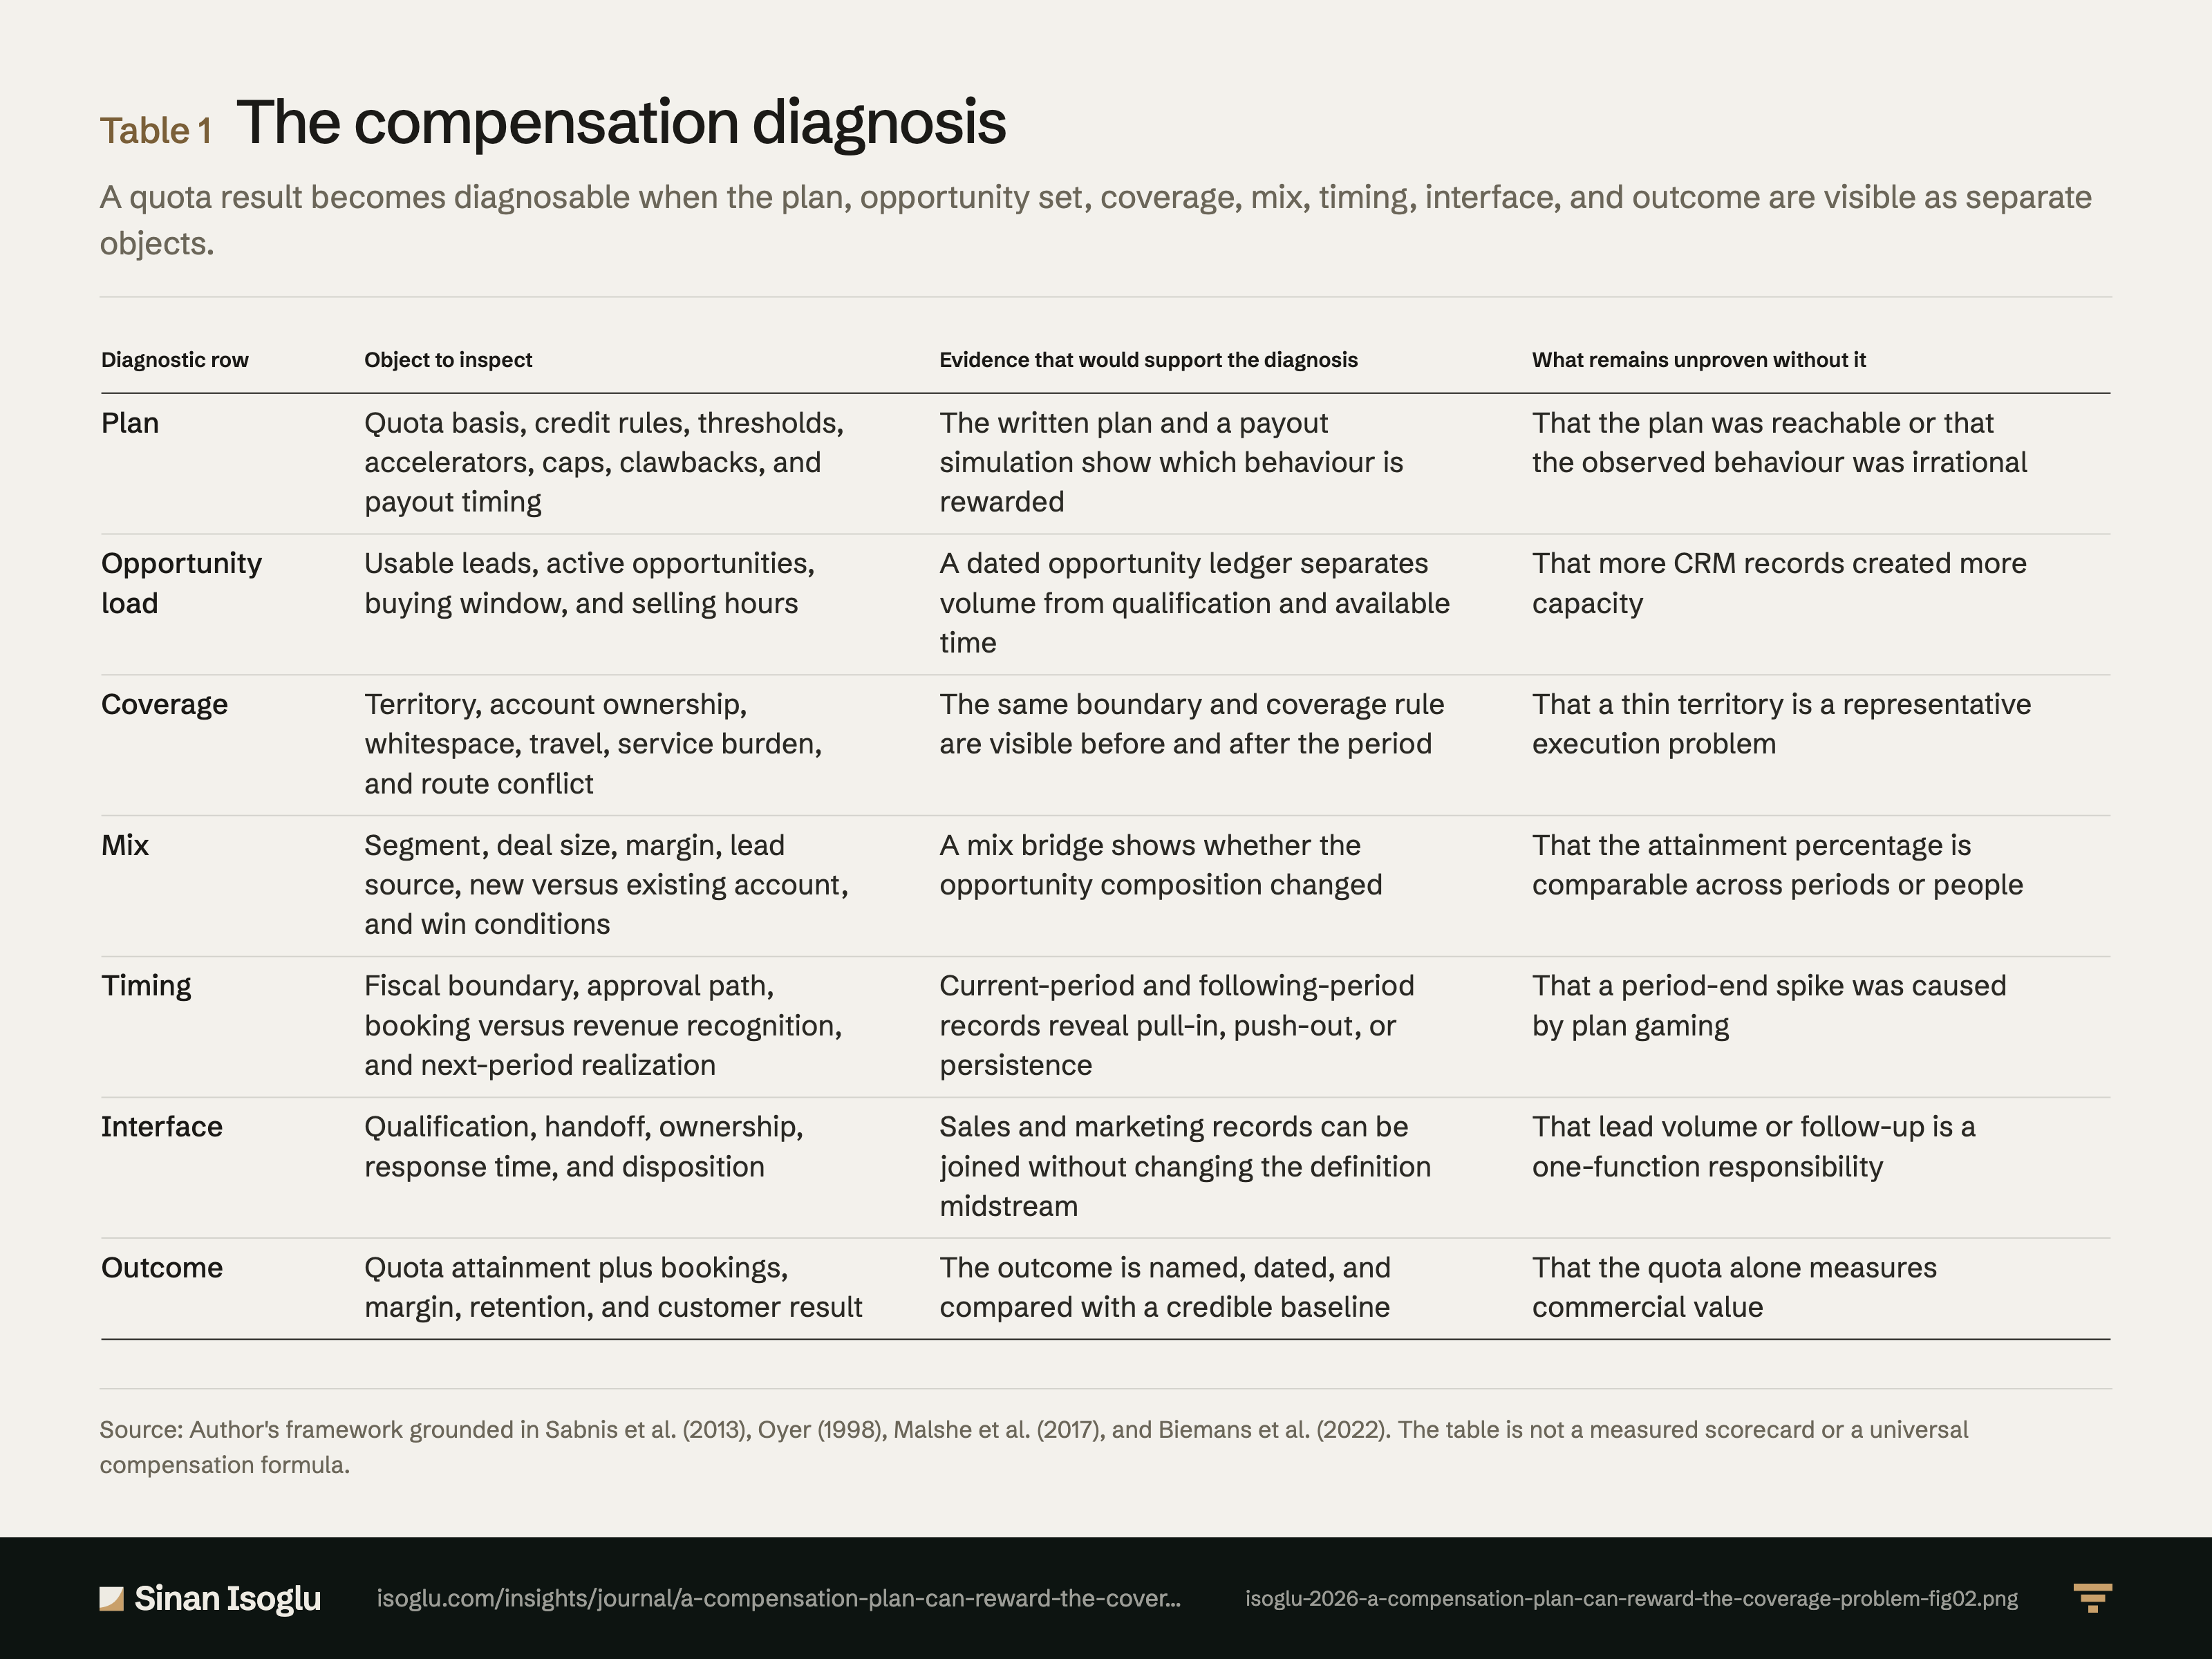
Tabelle 1Aus „Ein Vergütungsplan kann das Abdeckungsproblem belohnen, das er erzeugt hat“
Die Vergütungsdiagnose
Ein Quotenergebnis wird diagnostizierbar, wenn Plan, Chancenmenge, Abdeckung, Mix, Timing, Schnittstelle und Ergebnis als getrennte Objekte sichtbar sind.
Tabelle 1Die Vergütungsdiagnose
| Diagnosezeile | Zu prüfendes Objekt | Beobachtung, die die Diagnose stützen würde | Ohne diese Beobachtung bleibt offen |
|---|---|---|---|
| Plan | Quotenbasis, Gutschriften, Schwellen, Accelerators, Caps, Clawbacks und Auszahlungszeitpunkt | Der schriftliche Plan und eine Auszahlungssimulation zeigen, welches Verhalten belohnt wird | Dass der Plan erreichbar war oder das beobachtete Verhalten irrational war |
| Chancenlast | Nutzbare Leads, aktive Chancen, Kaufzeitfenster und verfügbare Verkaufszeit | Ein datierter Chancenbestand trennt Menge von Qualifikation und verfügbarer Zeit | Dass mehr CRM-Datensätze mehr Kapazität erzeugten |
| Abdeckung | Gebiet, Account-Zuständigkeit, White Space, Reiseaufwand, Service-Last und Routen-Konflikte | Dieselbe Abgrenzung und Abdeckungsregel sind vor und nach der Periode sichtbar | Dass ein dünnes Gebiet ein Ausführungsproblem der Person ist |
| Mix | Segment, Deal-Größe, Marge, Lead-Quelle, Neu- oder Bestandskunde und Gewinnbedingungen | Eine Mix-Brücke zeigt, ob sich die Zusammensetzung der Chancen verändert hat | Dass die Erreichung zwischen Perioden oder Personen vergleichbar ist |
| Timing | Geschäftsjahresgrenze, Freigabeweg, Booking gegenüber Umsatzrealisierung und Folgeperiodenwert | Aktuelle und folgende Periode zeigen Vorziehen, Verschieben oder Bestand des Ergebnisses | Dass ein Ausschlag am Periodenende durch Plan-Gaming verursacht wurde |
| Schnittstelle | Qualifikation, Übergabe, Zuständigkeit, Reaktionszeit und Ergebnisstatus | Vertriebs- und Marketingdaten lassen sich verbinden, ohne die Definition unterwegs zu ändern | Dass Lead-Volumen oder Nachverfolgung nur einer Funktion zuzurechnen ist |
| Ergebnis | Quotenerreichung plus Bookings, Marge, Bindung und Kundenergebnis | Das Ergebnis ist benannt, datiert und mit einer plausiblen Basis verglichen | Dass die Quote allein den kommerziellen Wert misst |
Bei breiten Tabellen horizontal wischen oder scrollen.
Quelle: Eigene Darstellung auf Grundlage von Sabnis et al. (2013), Oyer (1998), Malshe et al. (2017) und Biemans et al. (2022). Die Tabelle ist weder eine gemessene Scorecard noch eine universelle Vergütungsformel.
Quelle und Evidenz
Jede Zeile nennt eine Aussage zu dieser Abbildung, ihre Quelle und die Art ihrer Prüfung.
- A SCCL13-C1 The sample, from the paper: "we received 562 surveys for a response rate of" 21.08%, "we retained 500 usable responses", and the analysis uses "data from 461 sales reps from four firms". The 70% in the same abstract is guarded by FUN-X1 and never travels with this rowSabnis et al. (2013)
- A SCCL13-C2 The compensation context, verbatim: "The compensation schemes in all four firms were based primarily on quota achievement, commissions, and bonuses for top-line sales", and "no component explicitly rewarded following up on marketing leads"Sabnis et al. (2013)
- A SCCL13-C3 "the proportion of time that sales reps devote to marketing leads depends on organizational lead prequalification and managerial tracking processes", alongside motivation, lead volume, experience and abilitySabnis et al. (2013)
- A SCCL13-C4 Managerial tracking works the wrong way round, and the authors say so: they had argued it "would signal the importance that the managers place on lead follow-up and thus increase follow-up of marketing leads; however, our results show an opposite effect", b = −.89, p < .05. Prequalification quality runs the expected way, b = .64Sabnis et al. (2013)
- A SCCL13-C5 Time allocation is the mechanism: "the proportion of time that sales reps devote to marketing leads depends on organizational lead prequalification"Sabnis et al. (2013)
- A OYER98-C1 Nonlinear pay gives salespeople and executives "incentive to manipulate prices, influence the timing of customer purchases, and vary effort over their firms' fiscal years"oyer-1998-fiscal-year-ends
- A OYER98-C2 The seasonality result, in the author's words: "I find that fiscal-year timing influences the seasonality of business in most manufacturing" industries, identified because "I can separately identify the calendar and fiscal-year seasonality of revenue and prices"oyer-1998-fiscal-year-ends
- A OYER98-C4 The panel, verbatim: "A total of 31,936 quarterly observations are available, covering 981 manufacturers", and the data "cover firms' 1985 to 1993 fiscal years"oyer-1998-fiscal-year-ends
- A OYER98-C5 The author bounds his own result: "This analysis is not meant to determine the optimal compensation plan, to esti"mate structural parameters or to establish an indisputable causal relationship, and "the evidence on the link between incentive contracts and fiscal-year effects is circum"stantialoyer-1998-fiscal-year-ends
- A MJV17-C1 The design and its reach, verbatim: "42 participants in 21 sales-marketing dyads across multiple levels from a variety of B2B industries". Qualitative, so it is a pattern and not a rateMalshe, Johnson & Viio. (2017)
- A MJV17-C2 "Findings reveal that the same dysfunction may trigger vastly different sensemaking processes" in the two functions, and "sales and marketing personnel view the interface dysfunctions as following a" bidirectional rather than a sequential patternMalshe, Johnson & Viio. (2017)
- A BMJ22-C1 The review's own count: "we identify 73 articles" about the sales-marketing interface, published 1990 through 2021Biemans, Malshe & Johnson. (2022)
- A BMJ22-C2 The coding scheme, in the review's words: "structural linkages refer to the horizontal platforms or interaction" channels established for interdepartmental activity, alongside role linkages, interactions and perceptionsBiemans, Malshe & Johnson. (2022)
- B B01-C1 A quota miss should be diagnosed across plan, opportunity load, coverage, mix, timing, interface, and outcome before it is attributed to a representativeAuthor framework, stated in Brief - B01 compensation diagnosis
- B B01-C2 Compensation is an intervention on time allocation and transaction timing, not a neutral scoreboardAuthor framework, stated in Brief - B01 compensation diagnosis
Prüfgrade: A, gegen die gedruckte Seite der Primärquelle geprüft · B, Primärquelle, nur Textebene · C, belastbare Sekundärquelle · D, berichtet.
Aus dem Beitrag
Revenue Operations & KI
Ein Vergütungsplan kann das Abdeckungsproblem belohnen, das er erzeugt hat
Ein Quotenfehler ist keine Rep-Diagnose, bevor Plan, Chancenlast, Gebietsabdeckung, Mix, Timing und Ergebnis getrennt geprüft sind.
Den Beitrag lesenDiese Abbildung gehört zu einem Essay: Die Zahlen stehen hier, das Argument dort.
Zitieren oder einbetten
Verwandte Abbildungen
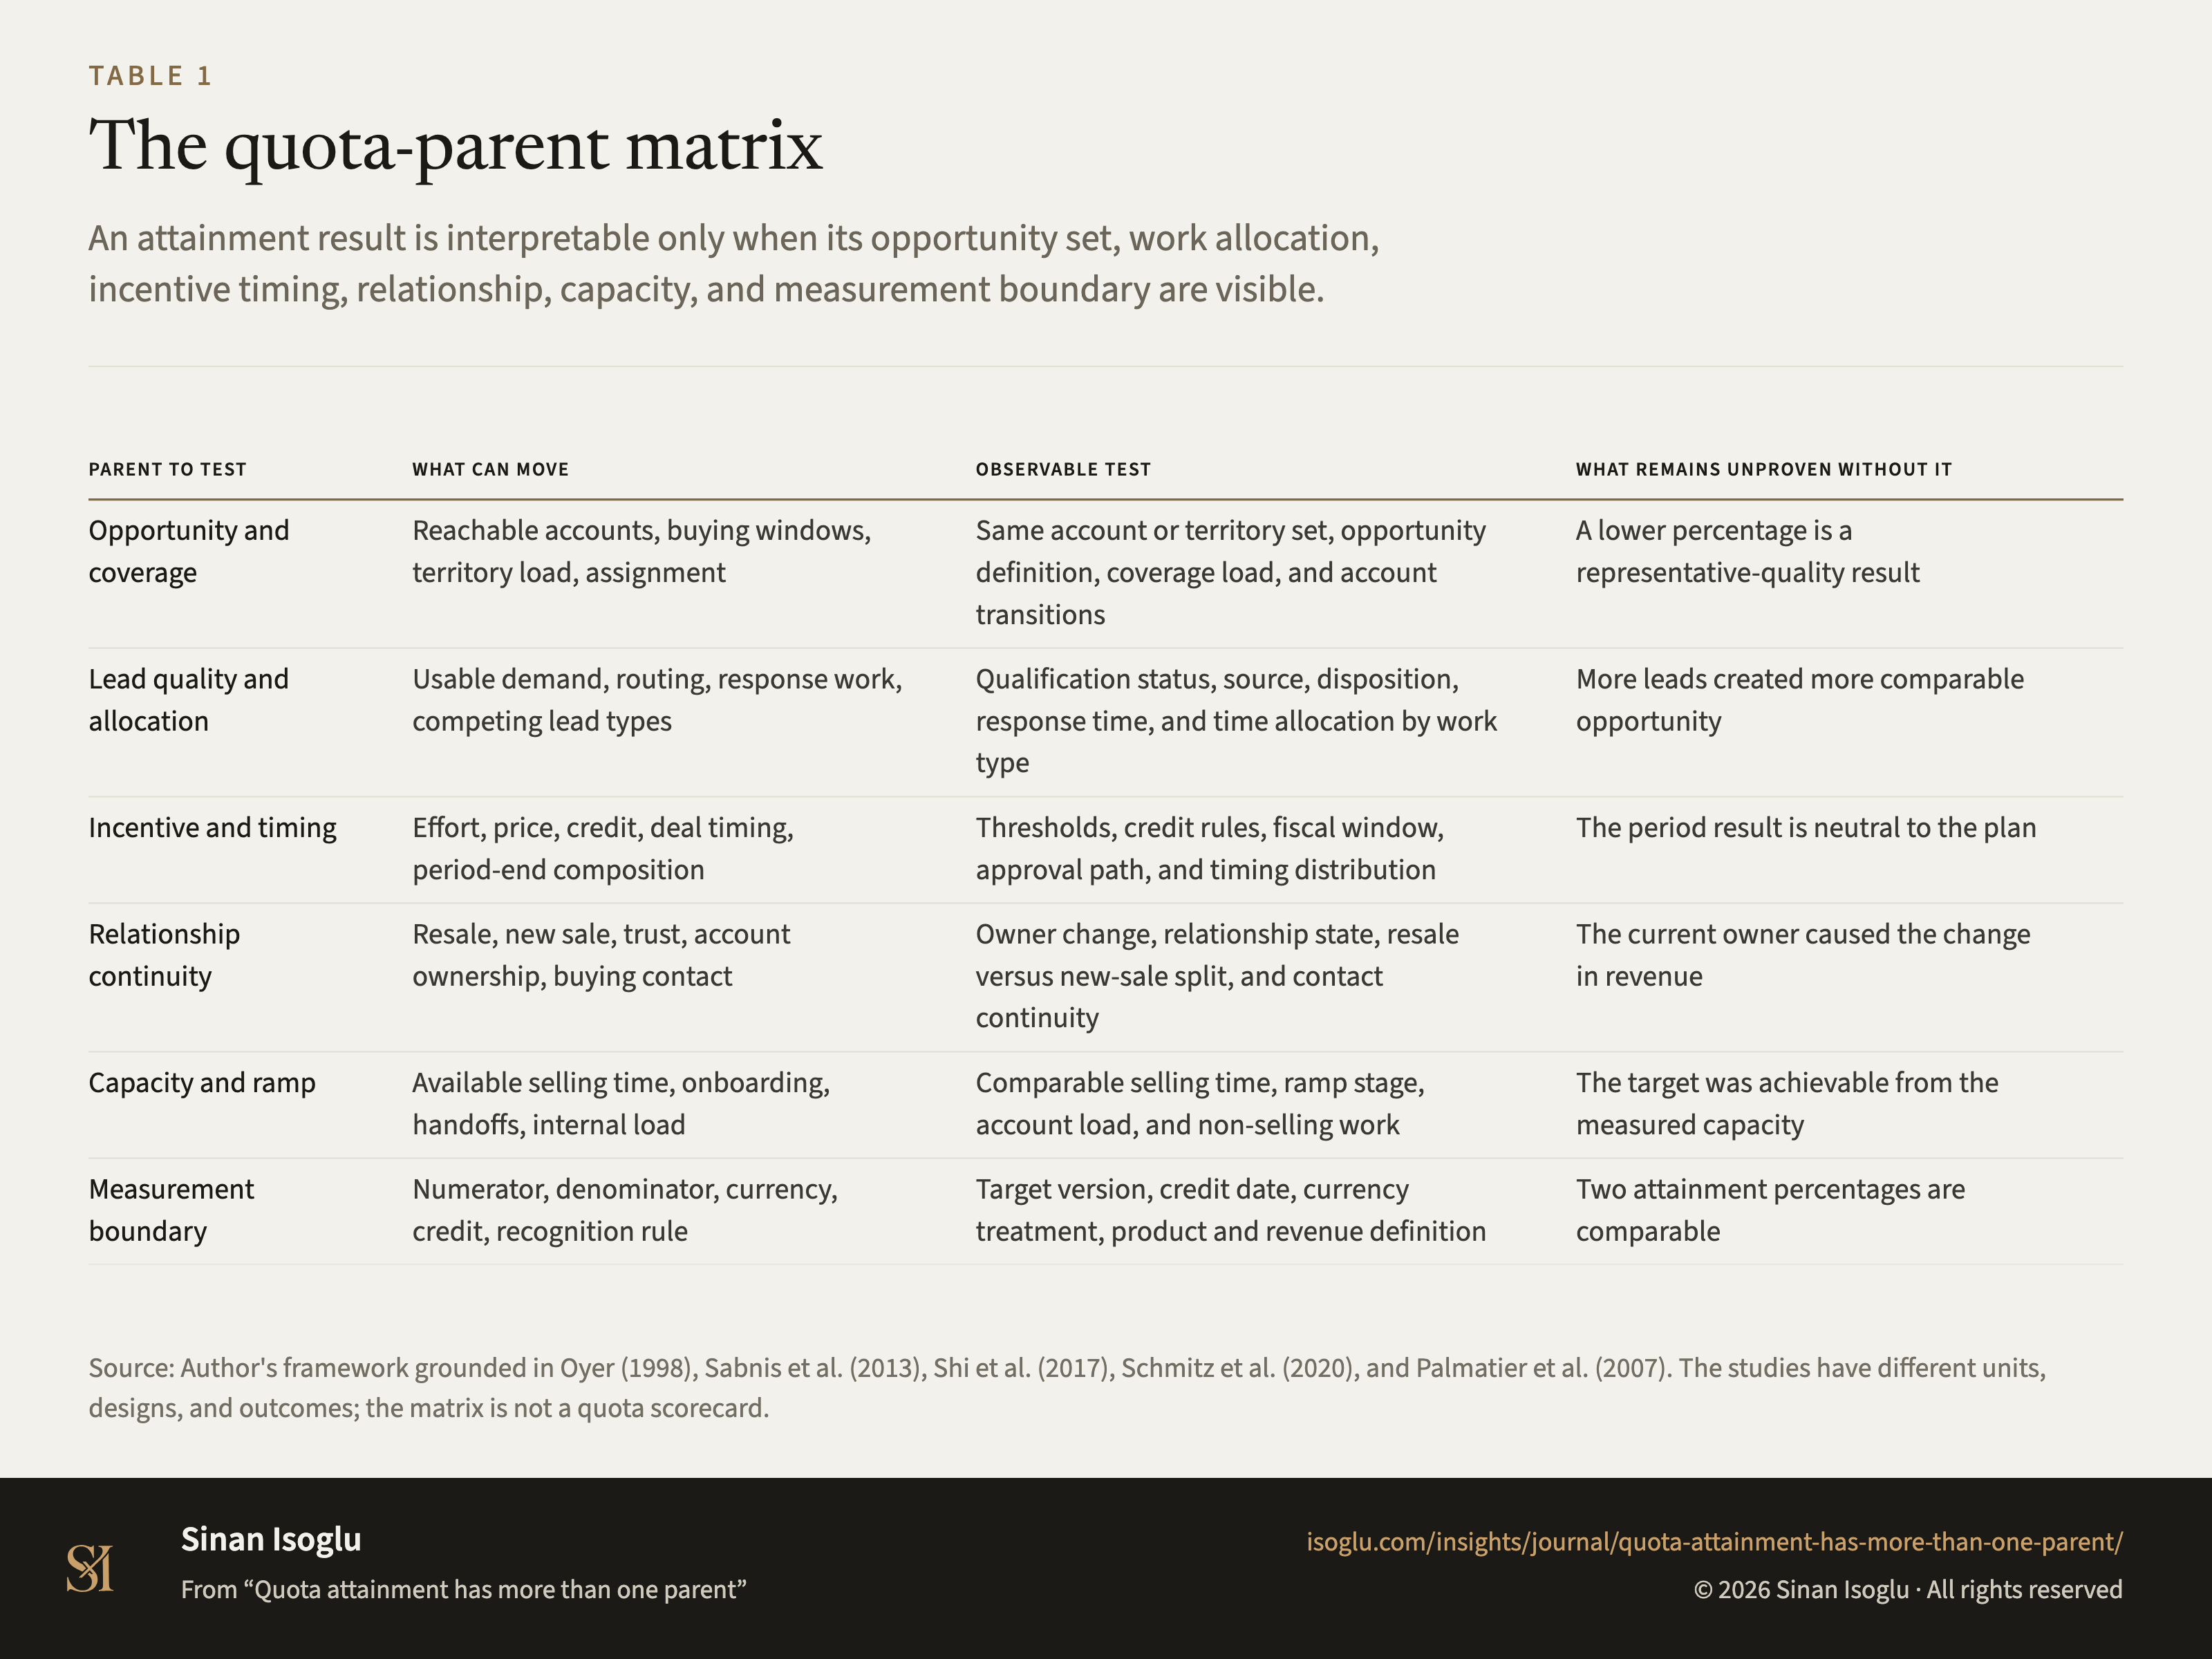
Tabelle 1Tabelle
Die Ursachenmatrix der Quotenerreichung
Quotenerreichung hat mehr als eine Ursache
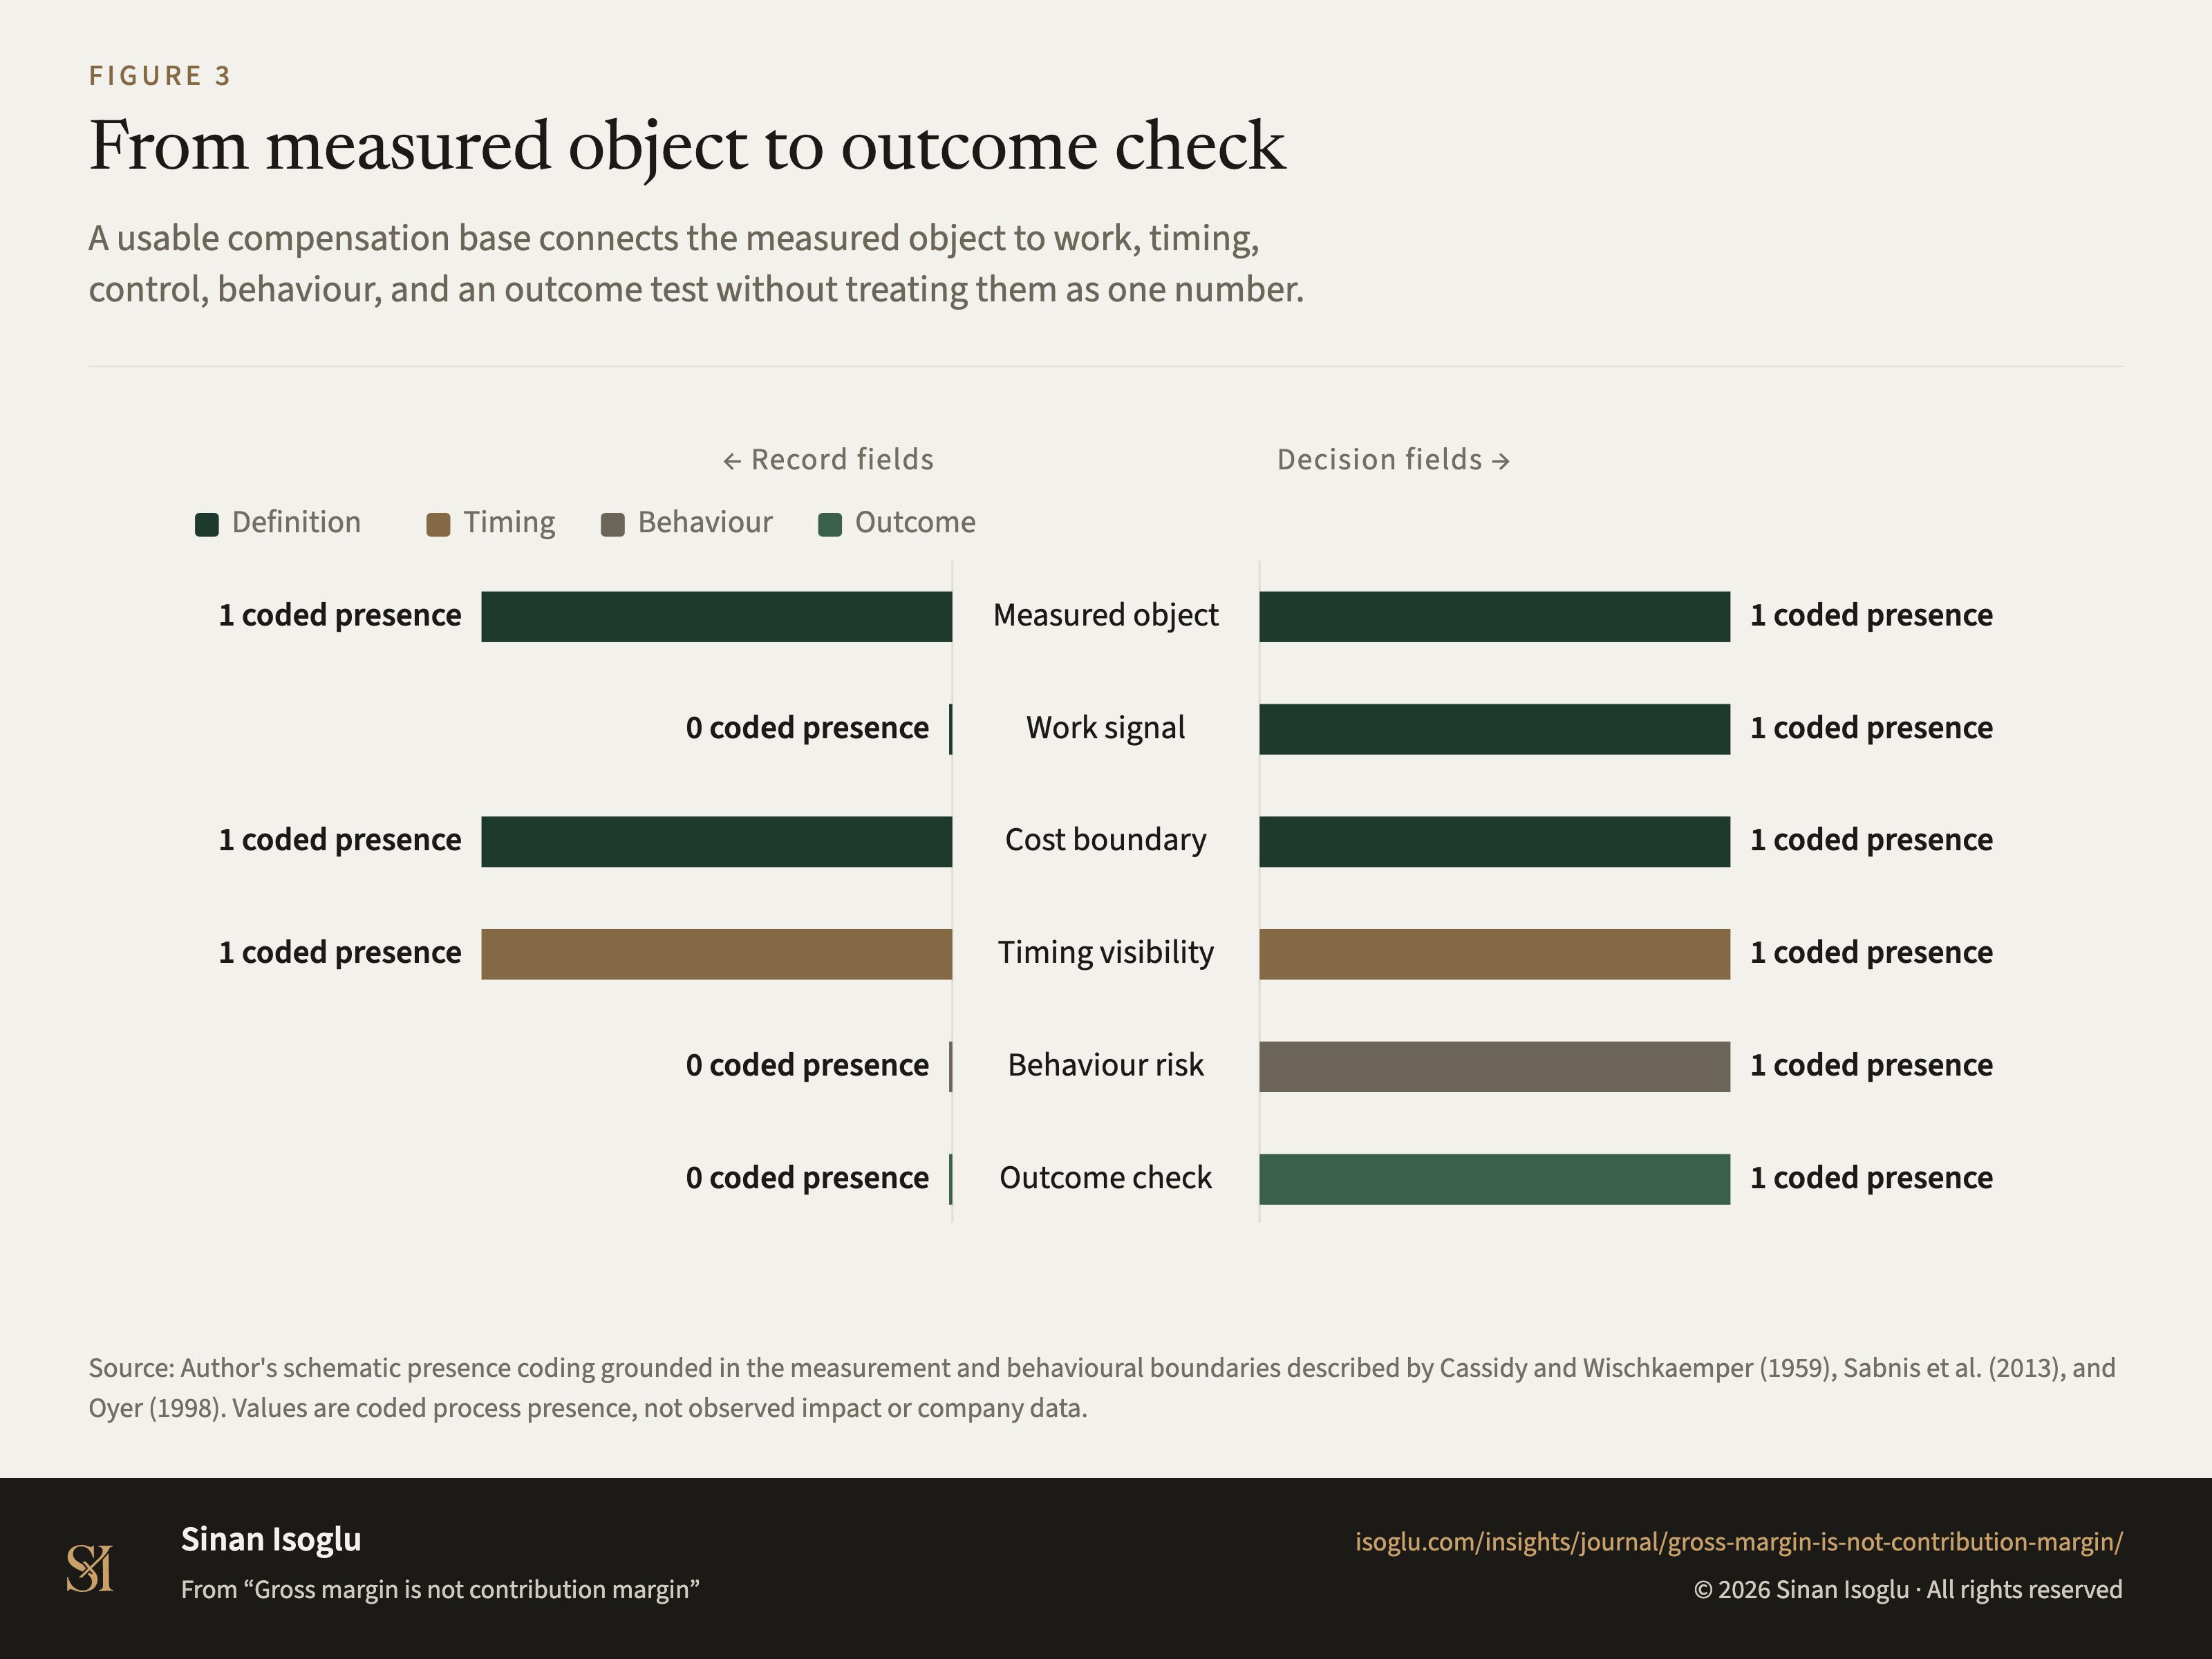
Abbildung 3Grafik
Vom Messobjekt zur Ergebnisprüfung
Bruttomarge ist nicht Deckungsbeitrag
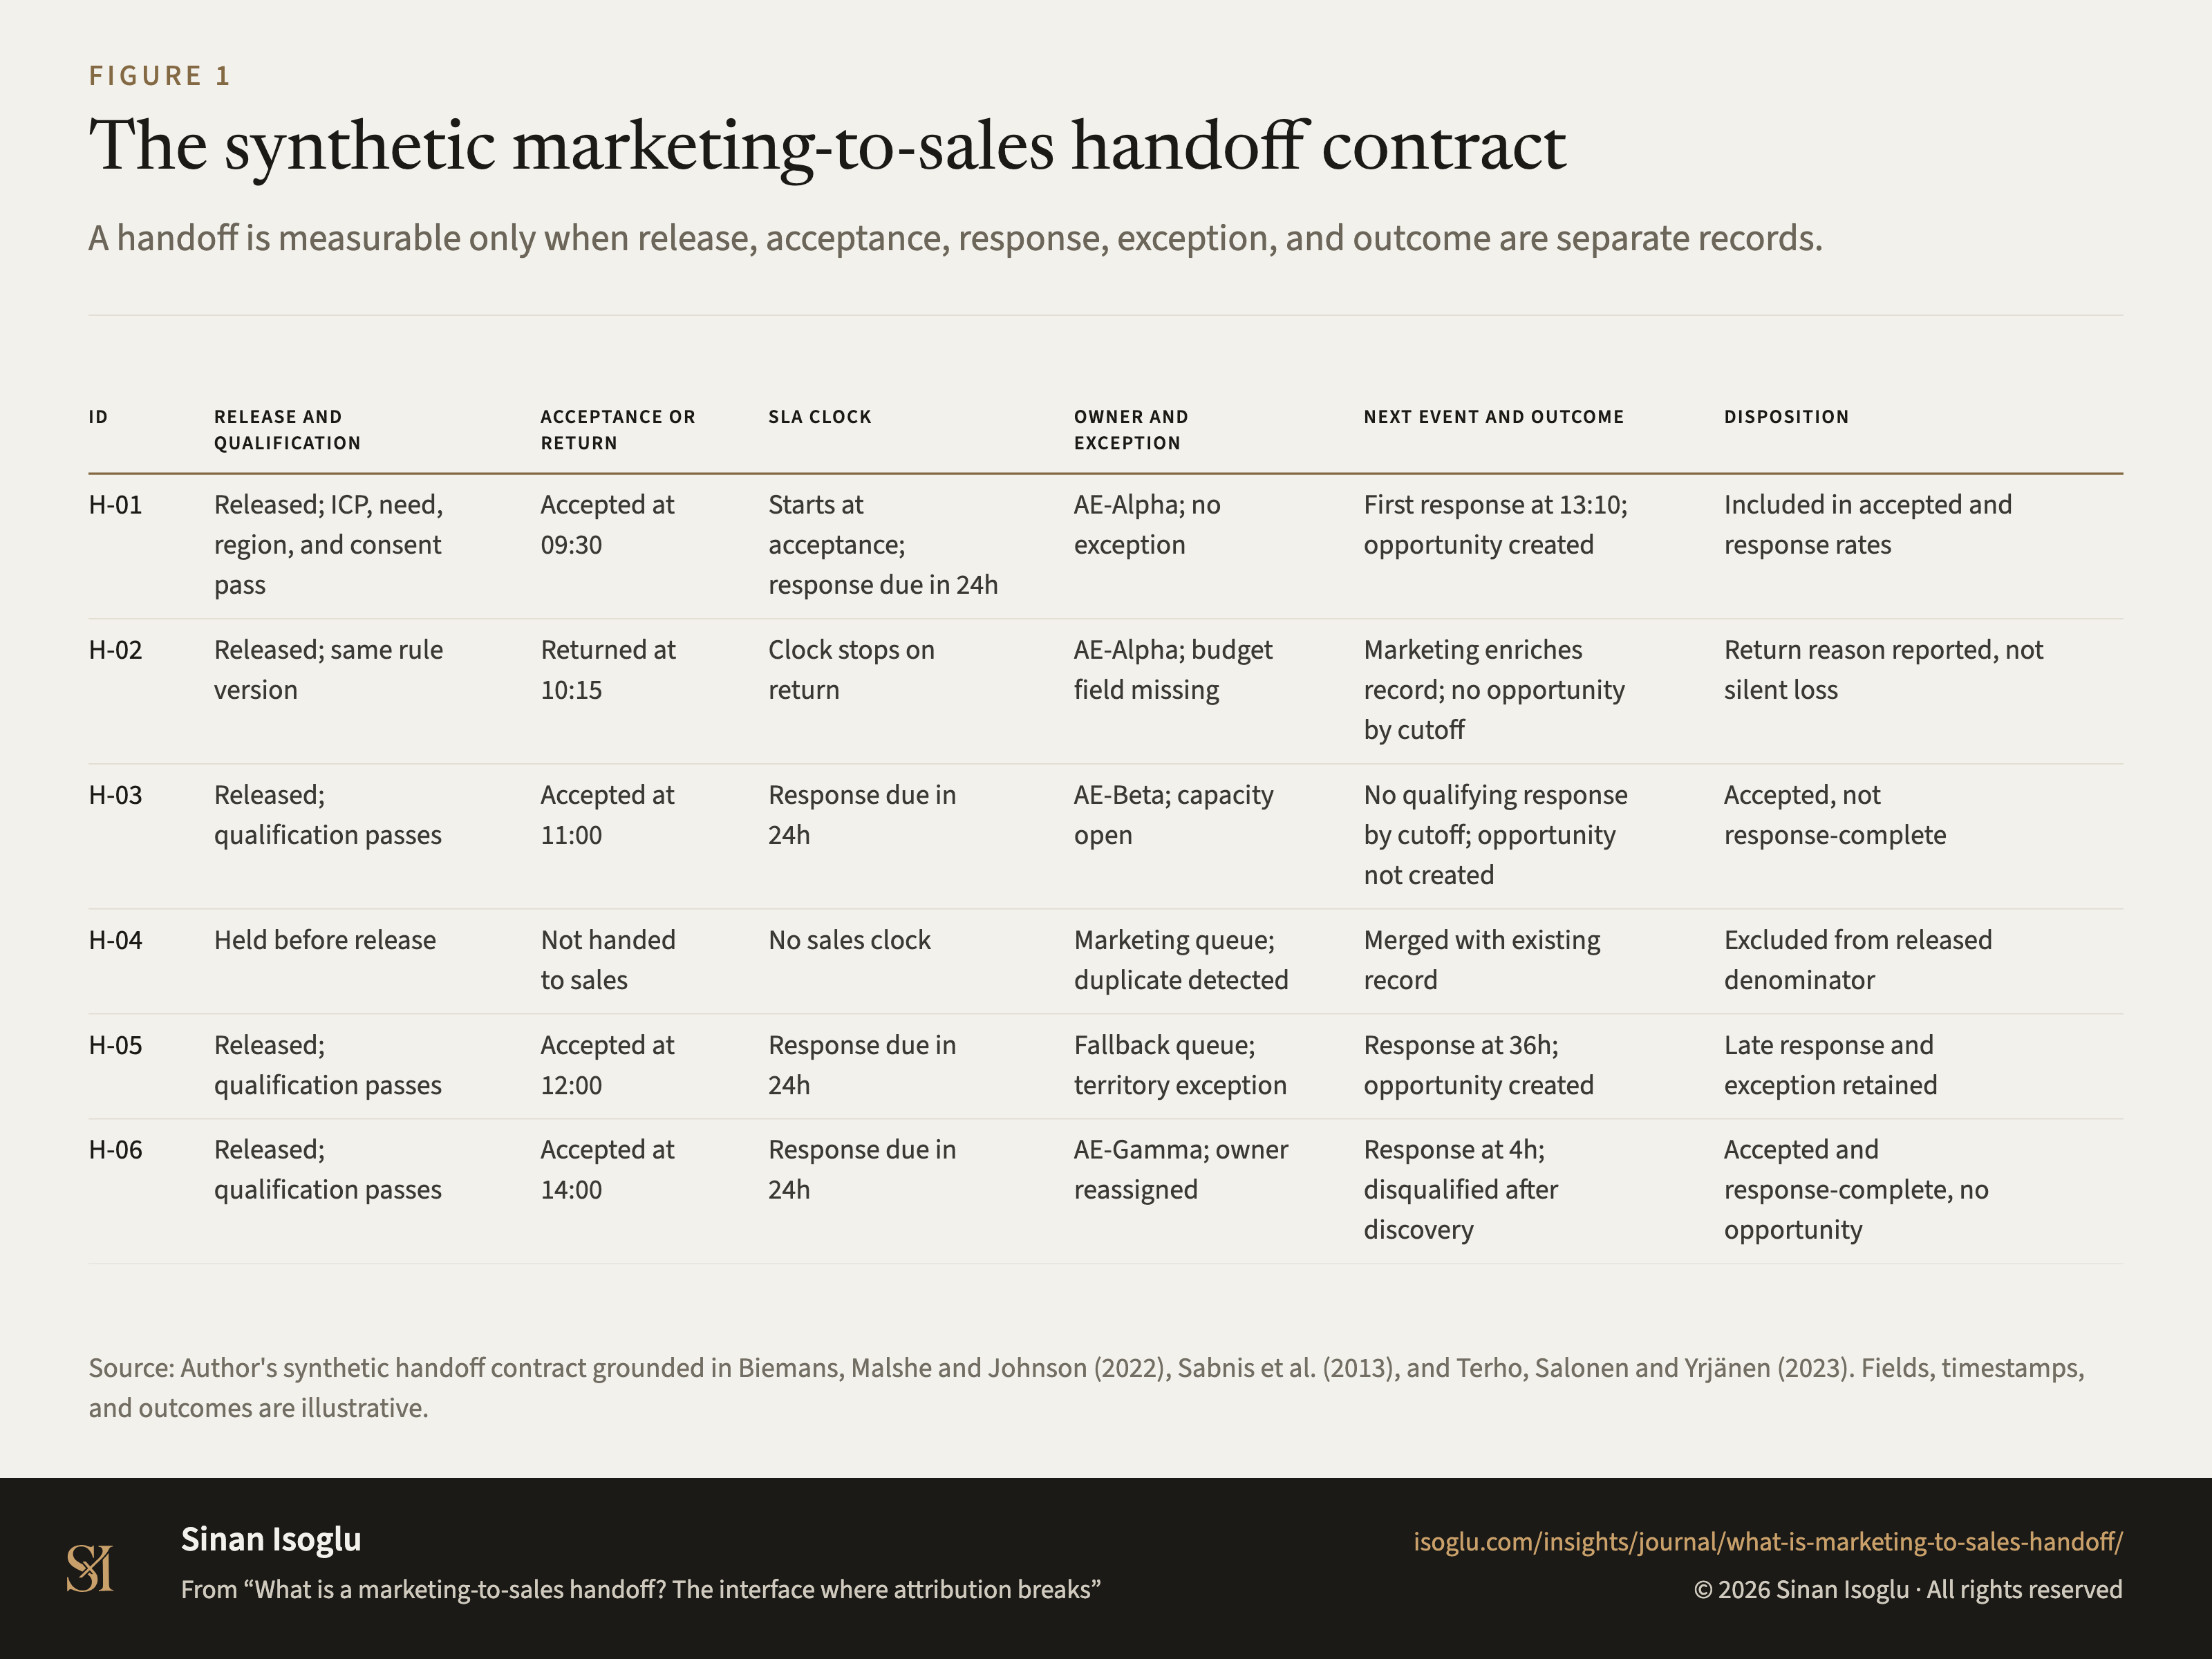
Abbildung 1Grafik
Der synthetische Übergabevertrag von Marketing an Vertrieb
Was ist die Übergabe von Marketing an Vertrieb? Die Schnittstelle, an der Attribution bricht
Kontakt
Schicken Sie die Frage, an der Sie arbeiten.
Forschung, ein Gastvortrag oder eine Frage aus der Praxis.