Tabelle 1Aus „Evidenz statt Anekdote – was eine Zahl überstanden haben muss.“
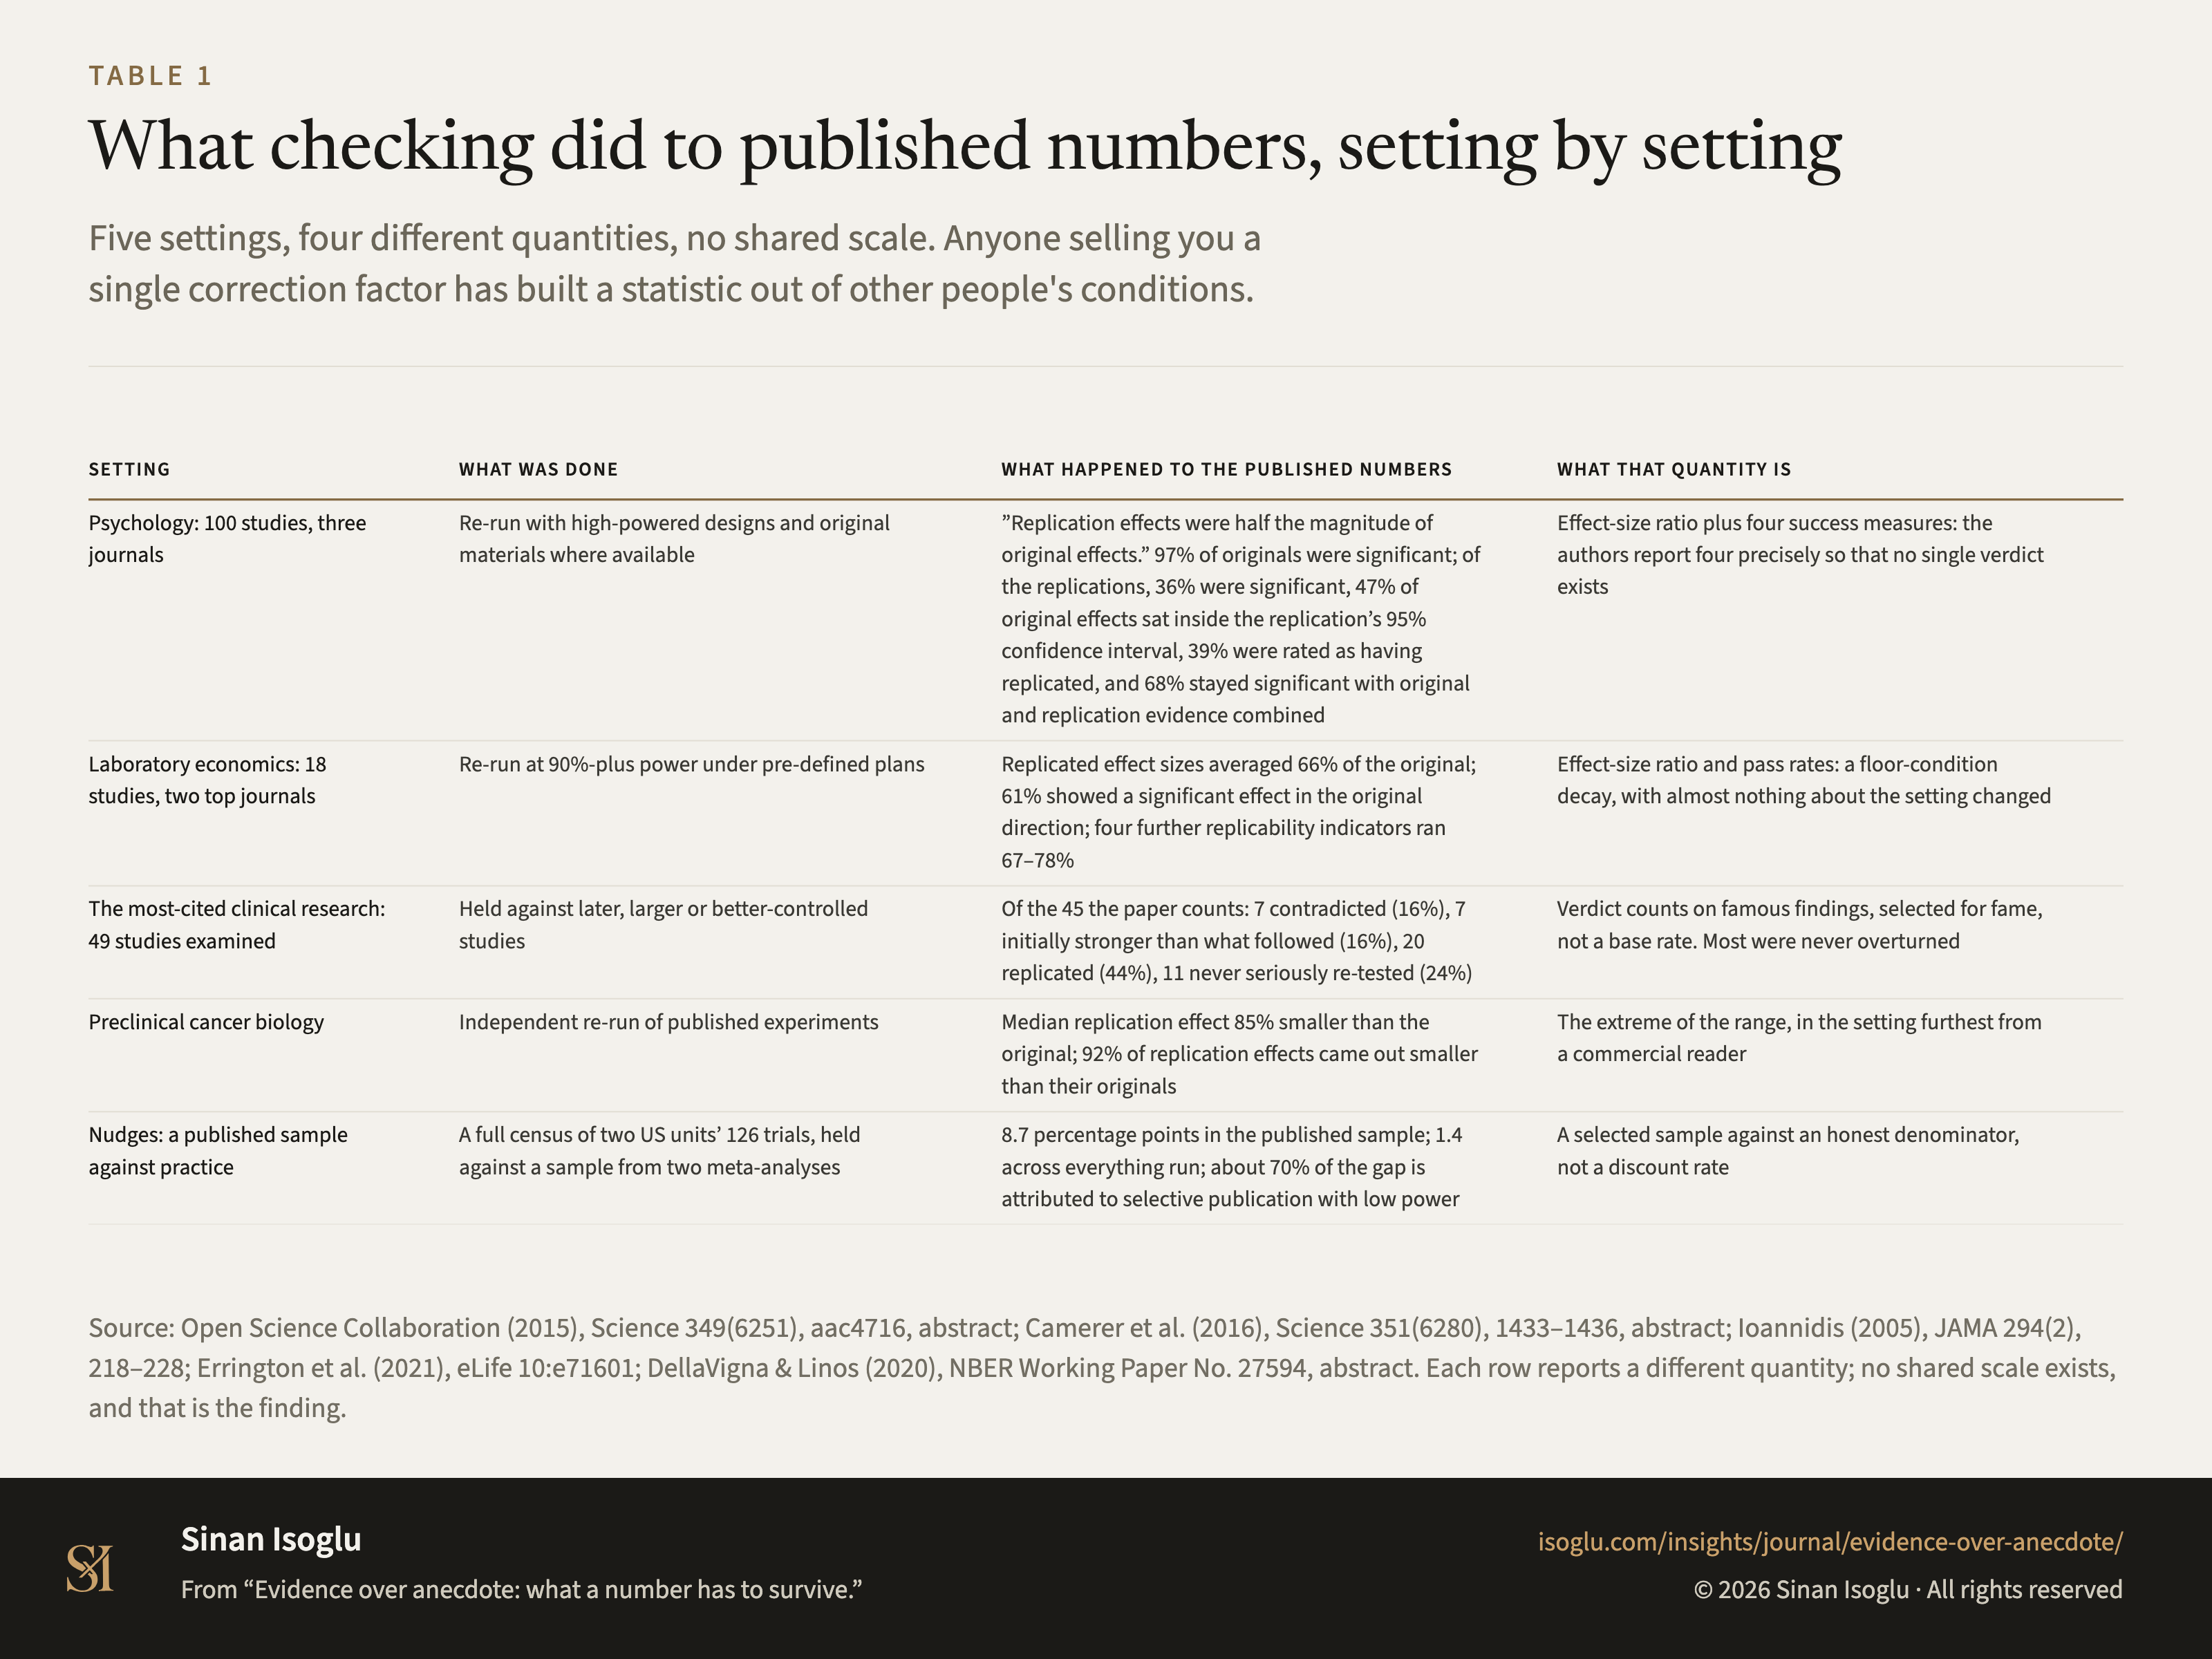
Was das Nachprüfen mit publizierten Zahlen getan hat, je Feld
Fünf Felder, vier verschiedene Größen, keine gemeinsame Skala. Wer Ihnen einen einheitlichen Korrekturfaktor verkauft, hat eine Statistik aus fremden Bedingungen gebaut.
Tabelle 1Was das Nachprüfen mit publizierten Zahlen getan hat, je Feld
| Feld | Was getan wurde | Was mit den publizierten Zahlen geschah | Welche Größe das ist |
|---|---|---|---|
| Psychologie: 100 Studien, drei Journale | Nachgemessen mit hoher Power und, wo verfügbar, Originalmaterialien | Replikationseffekte im Schnitt halb so groß wie die Originale; 97 Prozent der Originale signifikant. Von den Replikationen: 36 Prozent signifikant, 47 Prozent der Originaleffekte im 95-Prozent-Konfidenzintervall der Replikation, 39 Prozent als repliziert eingestuft, 68 Prozent signifikant bei kombinierter Evidenz | Effektstärken-Verhältnis plus vier Erfolgsmaße – die Autoren berichten bewusst vier, damit kein Einzelurteil existiert |
| Laborökonomie: 18 Studien, zwei Spitzenjournale | Nachgemessen mit mindestens 90 Prozent Power, nach vorab festgelegten Plänen | Replizierte Effektstärken im Schnitt 66 Prozent des Originals; 61 Prozent signifikant in der Originalrichtung; vier weitere Replikationsindikatoren: 67 bis 78 Prozent | Effektstärken-Verhältnis und Bestehensquoten – Schwund unter Idealbedingungen, an denen fast nichts verändert wurde |
| Die meistzitierte klinische Forschung: 49 untersuchte Studien | Gegen spätere, größere oder besser kontrollierte Studien gehalten | Von den 45, die der Aufsatz zählt: 7 widerlegt (16 Prozent), 7 anfangs stärker als das, was folgte (16 Prozent), 20 repliziert (44 Prozent), 11 nie ernsthaft nachgeprüft (24 Prozent) | Urteilszählung über berühmte Befunde – ausgewählt nach Ruhm, keine Basisrate. Die meisten wurden nie umgestoßen |
| Präklinische Krebsforschung | Unabhängige Wiederholung publizierter Experimente | Medianer Replikationseffekt 85 Prozent kleiner als das Original; 92 Prozent der Replikationseffekte fielen kleiner aus | Das Extrem der Spannweite, im Feld, das kommerziellen Lesern am fernsten liegt |
| Nudges: publizierte Stichprobe gegen Praxis | Alle vergleichbaren Studien zweier US-Einheiten, 126 von 165 durchgeführten, verglichen mit einer nach denselben Kriterien gefilterten Stichprobe aus zwei Metaanalysen | 8,7 Prozentpunkte in der publizierten Stichprobe; 1,4 über die 126 Studien der Einheiten; rund 70 Prozent der Lücke werden selektiver Publikation bei geringer Power zugeschrieben | Eine selektierte Stichprobe gegen einen ehrlichen Nenner – kein Abschlagsfaktor |
Bei breiten Tabellen horizontal wischen oder scrollen.
Quelle: Open Science Collaboration (2015), Science 349(6251), aac4716, Abstract; Camerer et al. (2016), Science 351(6280), 1433–1436, Abstract; Ioannidis (2005a), JAMA 294(2), 218–228; Errington et al. (2021), eLife 10:e71601; DellaVigna & Linos (2022), Econometrica 90(1), 81–116, Abstract und S. 82, 86. Jede Zeile berichtet eine andere Größe; eine gemeinsame Skala existiert nicht – genau das ist der Befund.
Quelle und Evidenz
Jede Zeile nennt eine Aussage zu dieser Abbildung, ihre Quelle und die Art ihrer Prüfung.
- B OSC15-C1 Ninety-seven percent of the originals were significant: "ninety sevenpercent of original studies had significant results p 05", against "thirty six percent of replications"Open Science Collaboration (2015), abstract
- B OSC15-C2 The headline, verbatim: "Replication effects were half the magnitude of original effects", over a set the authors describe as "We conducted replications of 100 experimental and correlational studies published in three psychology journals"Open Science Collaboration (2015), abstract
- B OSC15-C3 The original-side figure in the abstract's own words: "Ninety-seven percent of original studies had statistically significant results"Open Science Collaboration (2015), abstract
- B OSC15-C4 Four measures, not one, and they disagree: "thirty six percent of replications had significant results", "47 of original effect sizes were in the 95 confidence interval of the replication effect size", "39 of effects were subjectively rated to have replicated the original result", and combining both "left 68 with statistically significant effects"Open Science Collaboration (2015), abstract
- B CAMERER16-C1 The average replicated size, in the authors' words: "on average, the replicated effect size is 66% of the original", in a set where "we replicated 18 studies published in the American Economic Review and the Quarterly Journal of Economics between 2011 and 2014"Camerer et al. (2016), abstract
- B CAMERER16-C2 The direction test, verbatim: "We found a significant effect in the same direction as in the original study for 11 replications (61%)"Camerer et al. (2016), abstract
- B CAMERER16-C3 The design, and it is the reason the result carries: "they all have a statistical power of at least 90% to detect the original effect size at the 5% significance level"Camerer et al. (2016), abstract
- B CAMERER16-C4 The other indicators, in the abstract's own words: "The replicability rate varies between 67% and 78% for four additional replicability indicators"Camerer et al. (2016), abstract
- B IOANNIDIS05J-C1 The counts, verbatim from the abstract: "Of 49 highly cited original clinical research studies, 45 claimed that the inter"vention was effective, of which "7 (16%) were contradicted by subsequent studies, 7 others (16%) had found effects that were stronger than those of subsequent studies", while 20 "(44%) were replicated, and 11 (24%) remained largely unchallenged"Ioannidis (2005), JAMA abstract and results
- B IOANNIDIS05J-C2 The design contrast, verbatim: five of six highly "cited nonrandomized studies had been contradicted or had found stronger effects vs 9 of 39 randomized controlled trials"Ioannidis (2005), JAMA abstract and results
- A ERRINGTON21-C1 The size comparison, verbatim: "the median effect size in the replications was 85% smaller than the median effect size in the original experiments"Errington et al. (2021), eLife, results
- A ERRINGTON21-C2 The direction of nearly all of them: "92% of replication effect sizes were smaller than the original"Errington et al. (2021), eLife, results
- A DELLAVIGNA22-C1 The published-sample figure, verbatim: "an 8.7 percentage point take-up effect, which is a 33.4% increase over the average control", where "the average impact of a nudge is very large"DellaVigna & Linos (2022), Econometrica 90(1), 81–116, abstract
- A DELLAVIGNA22-C2 The decomposition, verbatim: "selective publication in the Academic Journals sample, exacerbated by low statistical power, explains about 70 percent of the difference in effect sizes between the two samples. Different nudge characteristics account for most of the residual difference." A model result, never a raw measurementDellaVigna & Linos (2022), Econometrica 90(1), 81–116, abstract
- A DELLAVIGNA22-C3 The at-scale average, verbatim: "still sizable and highly statistically significant, but smaller at 1.4 percentage points, an 8.0% increase"DellaVigna & Linos (2022), Econometrica 90(1), 81–116, abstract
- A DELLAVIGNA22-C4 The census, verbatim: "We assemble a unique data set of 126 RCTs covering 23 million individuals, including all trials run by two of the largest Nudge Units in the United States"DellaVigna & Linos (2022), Econometrica 90(1), 81–116, abstract
- A DELLAVIGNA22-C6 The census and the comparison sample: the Office of Evaluation Sciences (federal agencies) and the Behavioural Insights Team North America (mainly local governments) kept a record of all trials from 2015 and had run 165 by July 2019, with no scope for selective publication; OES was launched in 2015 as the core of the White House Social and Behavioral Sciences Team, BIT North America was aimed at supporting local governments, and its trials are designed by internal staff in collaboration with government partners; restrictions, in both samples, to randomized trials outside the laboratory (Figure 2: RCTs and non-lab studies) with a clear control group, no financial incentives, a binary outcome and no default change, default changes being excluded at the units (2 nudges in 1 trial) as the rare exception and substantively different, and in the published sample (2 trials); 126 trials, 241 nudges, over 23 million participants; 26 published trials from two meta-analyses under the same restrictions, 74 nudges, 505,337 participants; take-up is an outcome rate such as vaccination or savings plan enrolment; published sample 8.7 pp, 33.4% over an average control take-up of 26.0%; units 1.4 pp, 8.0% over an average control take-up of 17.3%; about one sixth; equal effect sizes rejected; the control group received the status quo communication or, in 61% of the unit trials and 43% of the published trials, none within the experiment (revised at G5 2026-10-16) (pp. 81 to 83, 85, 86, 88 to 90): "the Office of Evaluation Sciences (OES), which collaborates with federal government agencies"; "which worked primarily with local government agencies during the period in question"; "Both units kept a comprehensive record of all trials from inception in 2015"; "with no scope for selective publication"; "require that the trials have a clear control group"; "Finally, we exclude interventions with default changes (excluding 2 nudges in 1 trial)."; "since they are the rare exception among Nudge Unit interventions in our sample (only two treatment arms of one trial), and substantively different"; "Finally, we exclude default interventions, dropping just 2 trials"; "Our final sample includes 126 trials, involving 241 nudges and collectively impacting over 23 million participants."; "leaving a final sample of 26 RCTS, including 74 nudge treatments collectively affecting 505,337 participants"; "the vaccination rate or enrollment in a savings plan"; "a 33.4 percent increase over the average control group take-up of 26.0 percent"; "an 8.0 percent increase over an average control group take-up of 17.3 percent"; "it is about one sixth the size of the estimate in academic papers"; "we can reject the hypothesis of equal effect sizes in the two samples"; "As of July 2019, they conducted a total of 165 trials"; "OES was launched in 2015 under the Obama Administration as the core of the White House Social and Behavioral Sciences Team"; "aimed at supporting local governments to use behavioral science"; "are designed by internal staff in collaboration with government partners"; "RCTs and non-lab studies"; "The control group received the status quo email"; "In 61% of the Nudge Unit trials and in 43% of the Academic Journal trials, the researchers do not send the control group any communication within the field experiment"DellaVigna & Linos (2022), Econometrica 90(1), 81-116
Prüfgrade: A, gegen die gedruckte Seite der Primärquelle geprüft · B, Primärquelle, nur Textebene · C, belastbare Sekundärquelle · D, berichtet.
Aus dem Beitrag
Aus der Forschung
Evidenz statt Anekdote – was eine Zahl überstanden haben muss.
Was eine Promotion zu grenzüberschreitendem Wachstum über Beweise lehrt – und wie man die Zahl in einer kommerziellen Entscheidung am selben Maßstab hält.
Den Beitrag lesenDiese Abbildung gehört zu einem Essay: Die Zahlen stehen hier, das Argument dort.
Zitieren oder einbetten
Verwandte Abbildungen
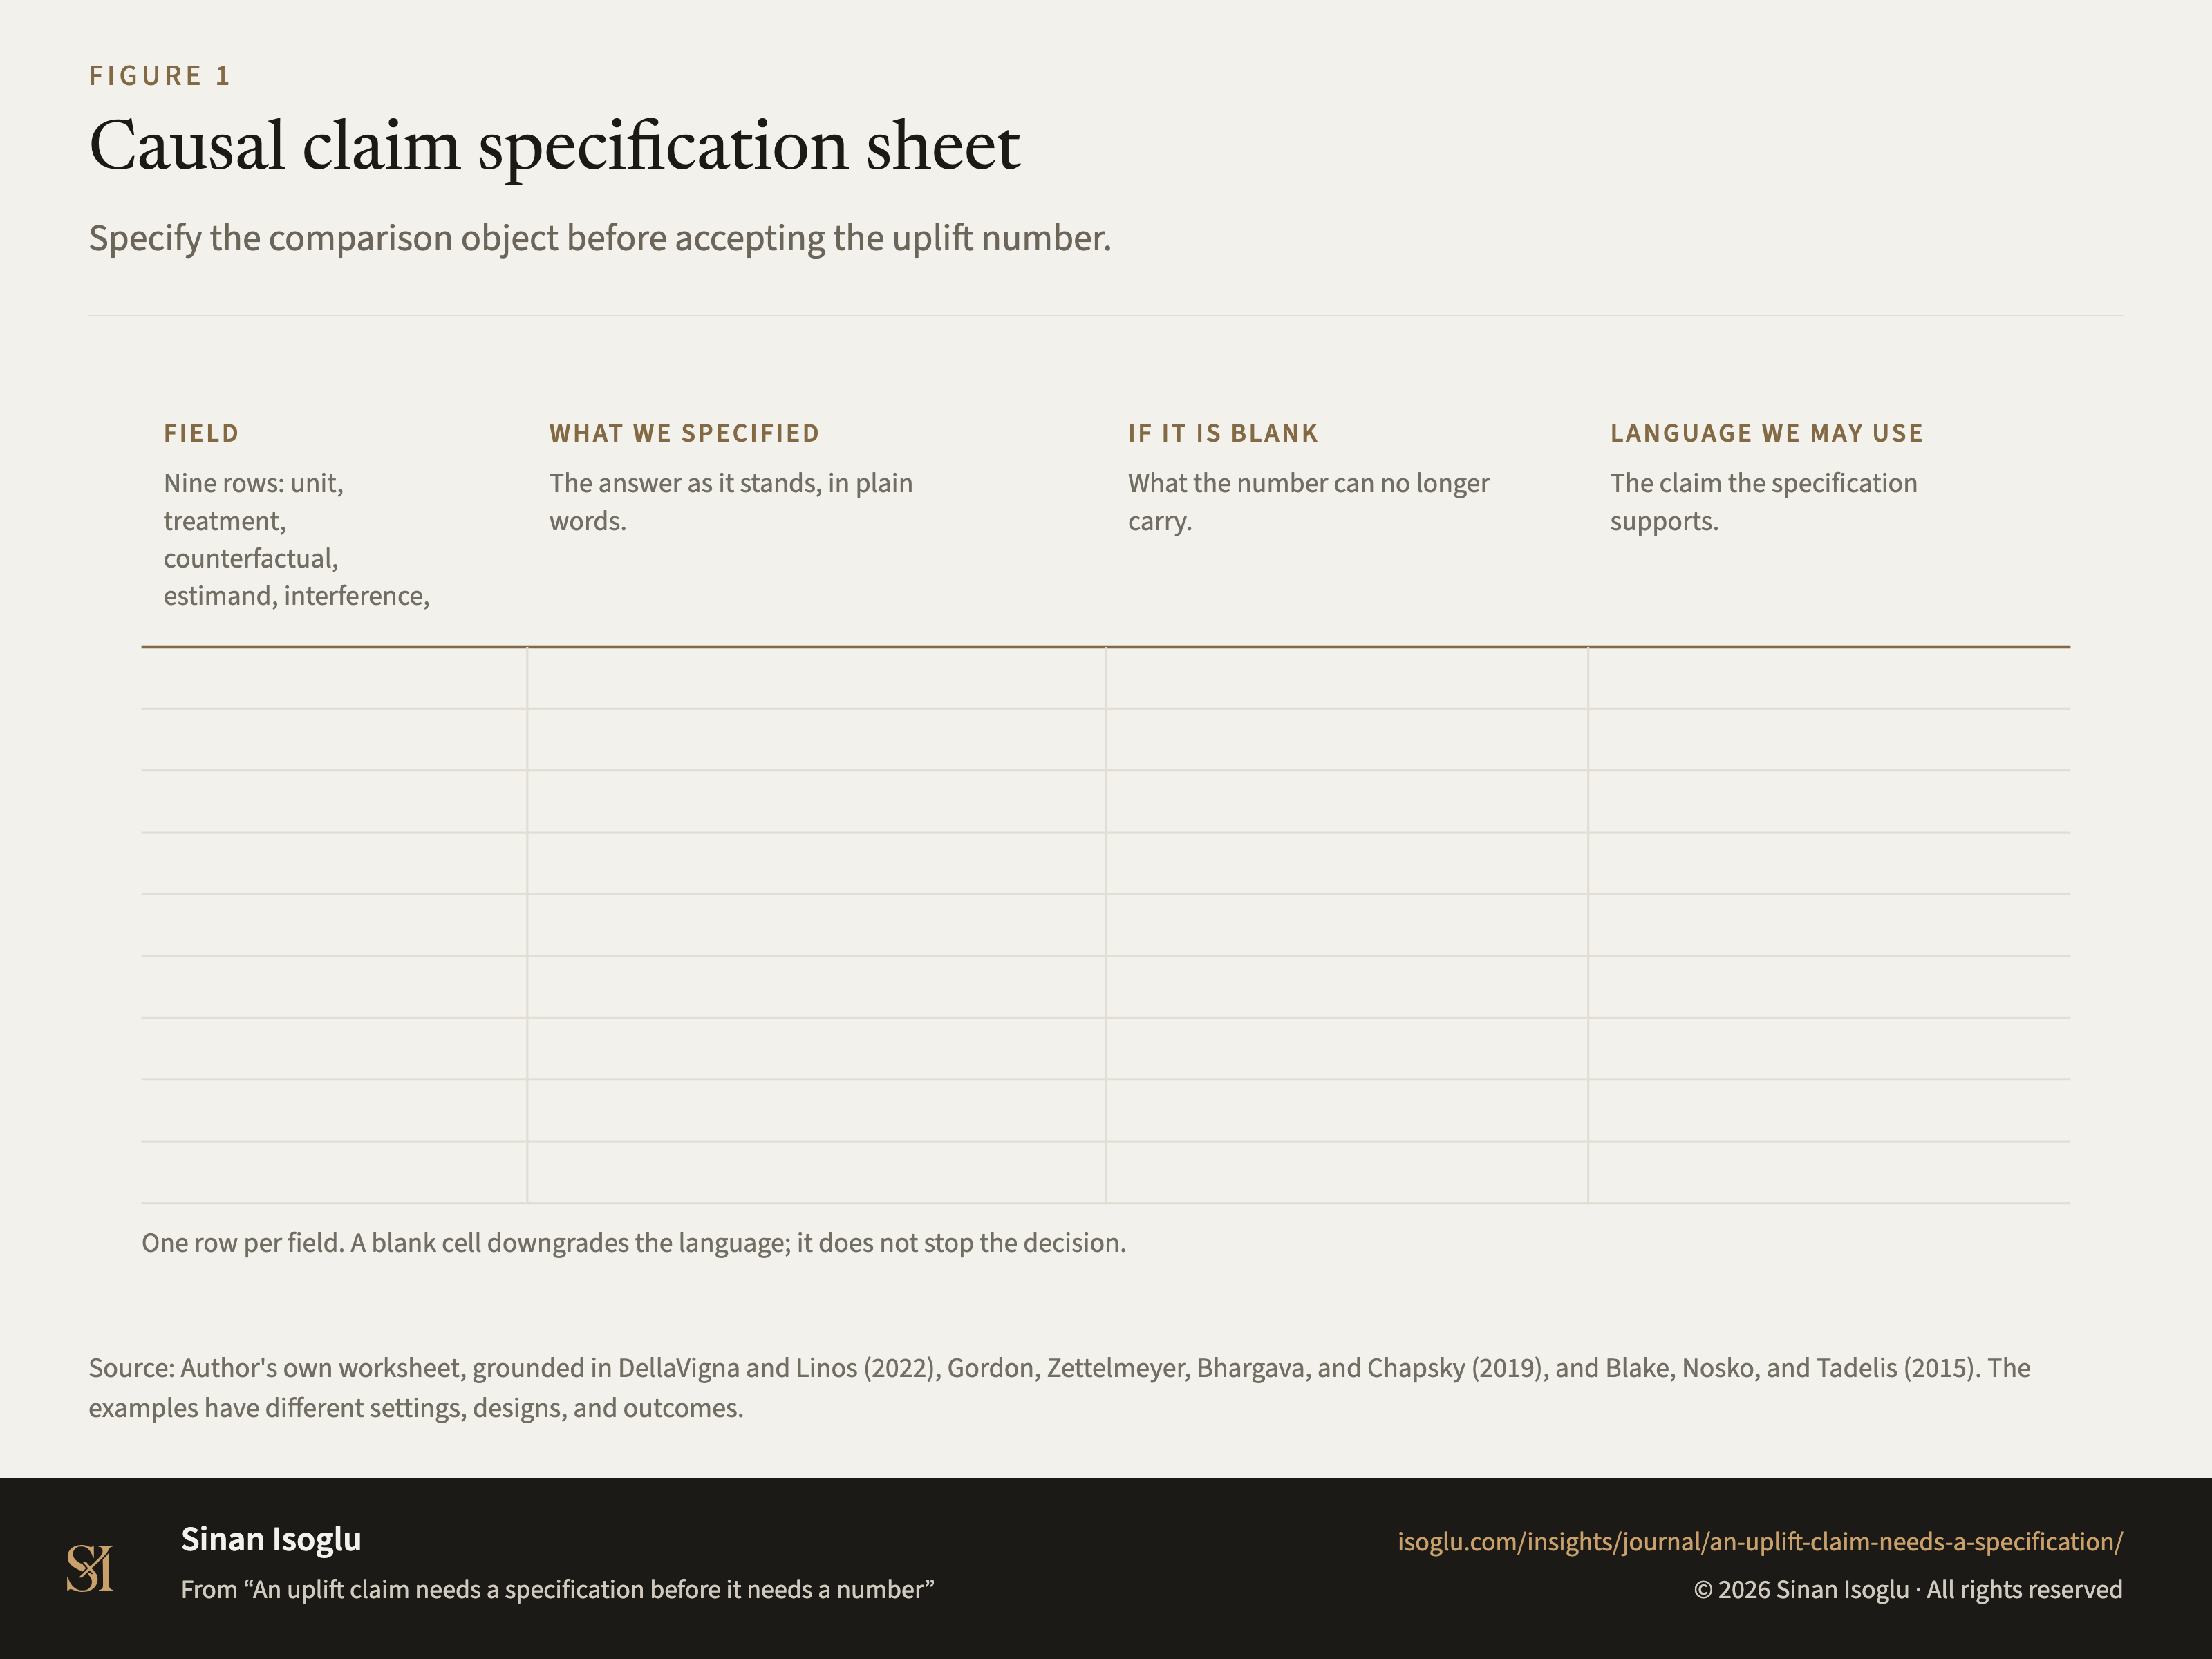
Abbildung 1Grafik
Spezifikationsblatt für kausale Aussagen
Ein Uplift braucht zuerst eine Spezifikation
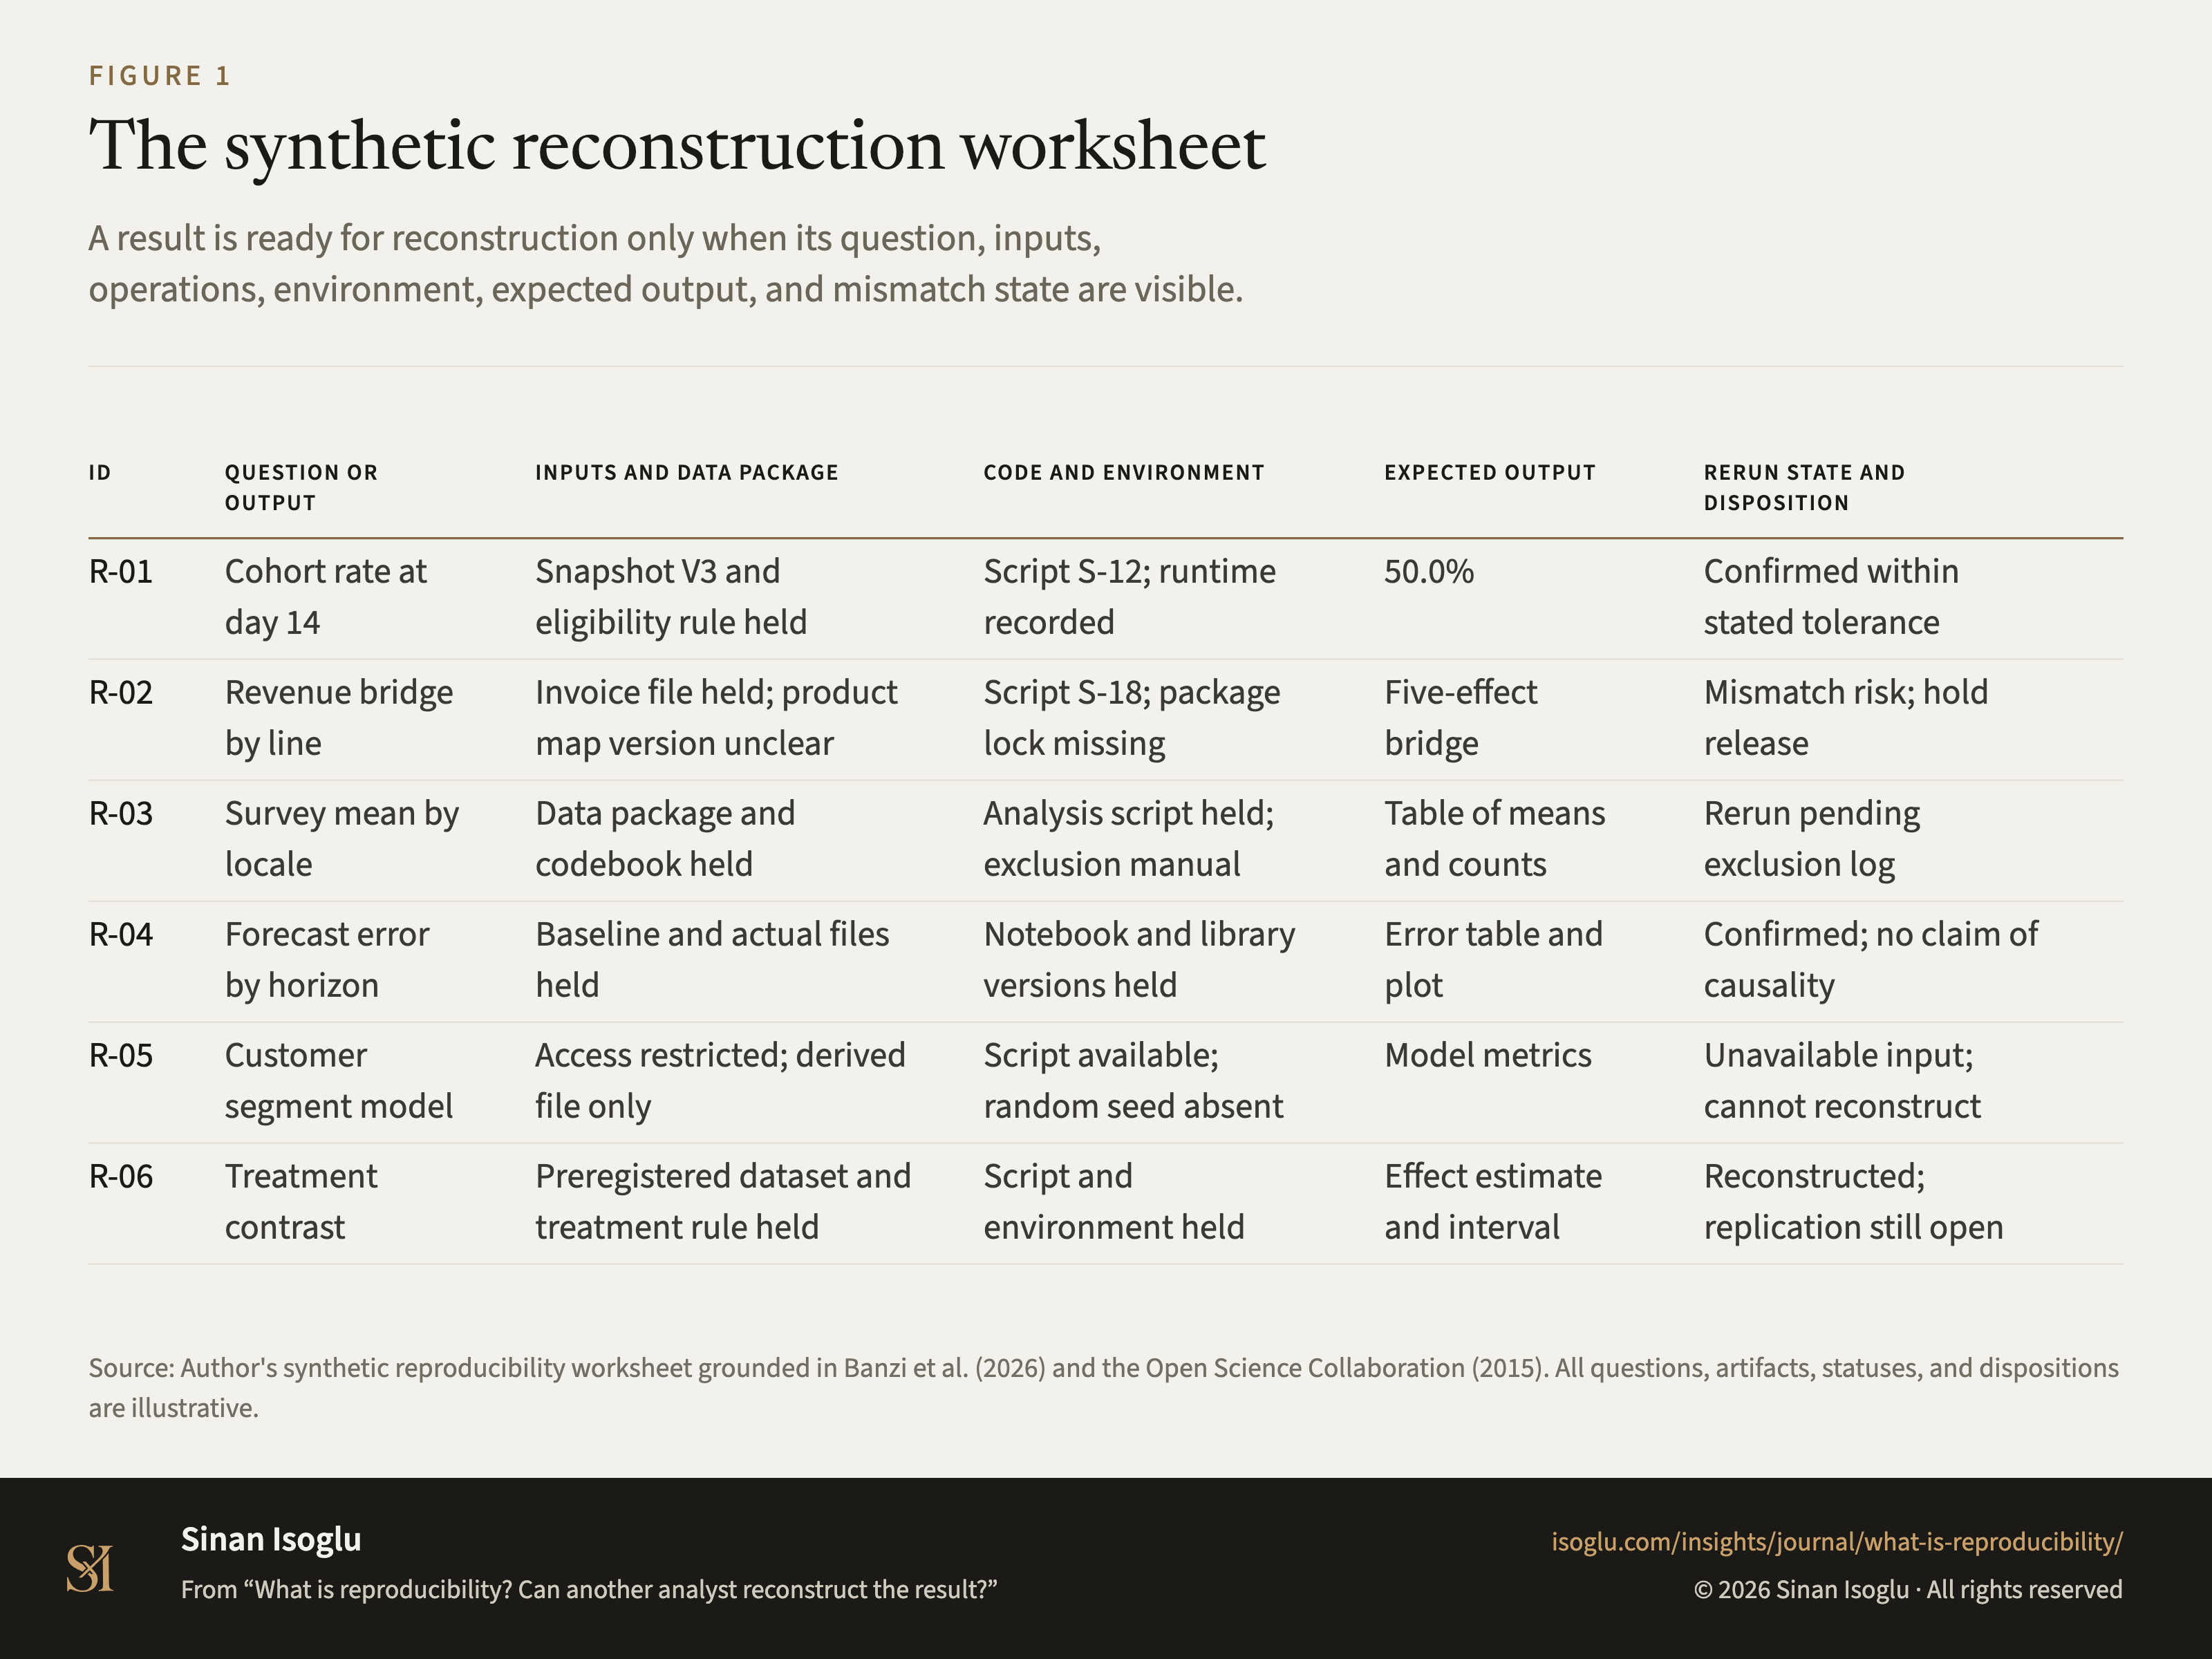
Abbildung 1Grafik
Das synthetische Rekonstruktions-Arbeitsblatt
Was ist Reproduzierbarkeit? Kann eine andere Person das Ergebnis rekonstruieren?
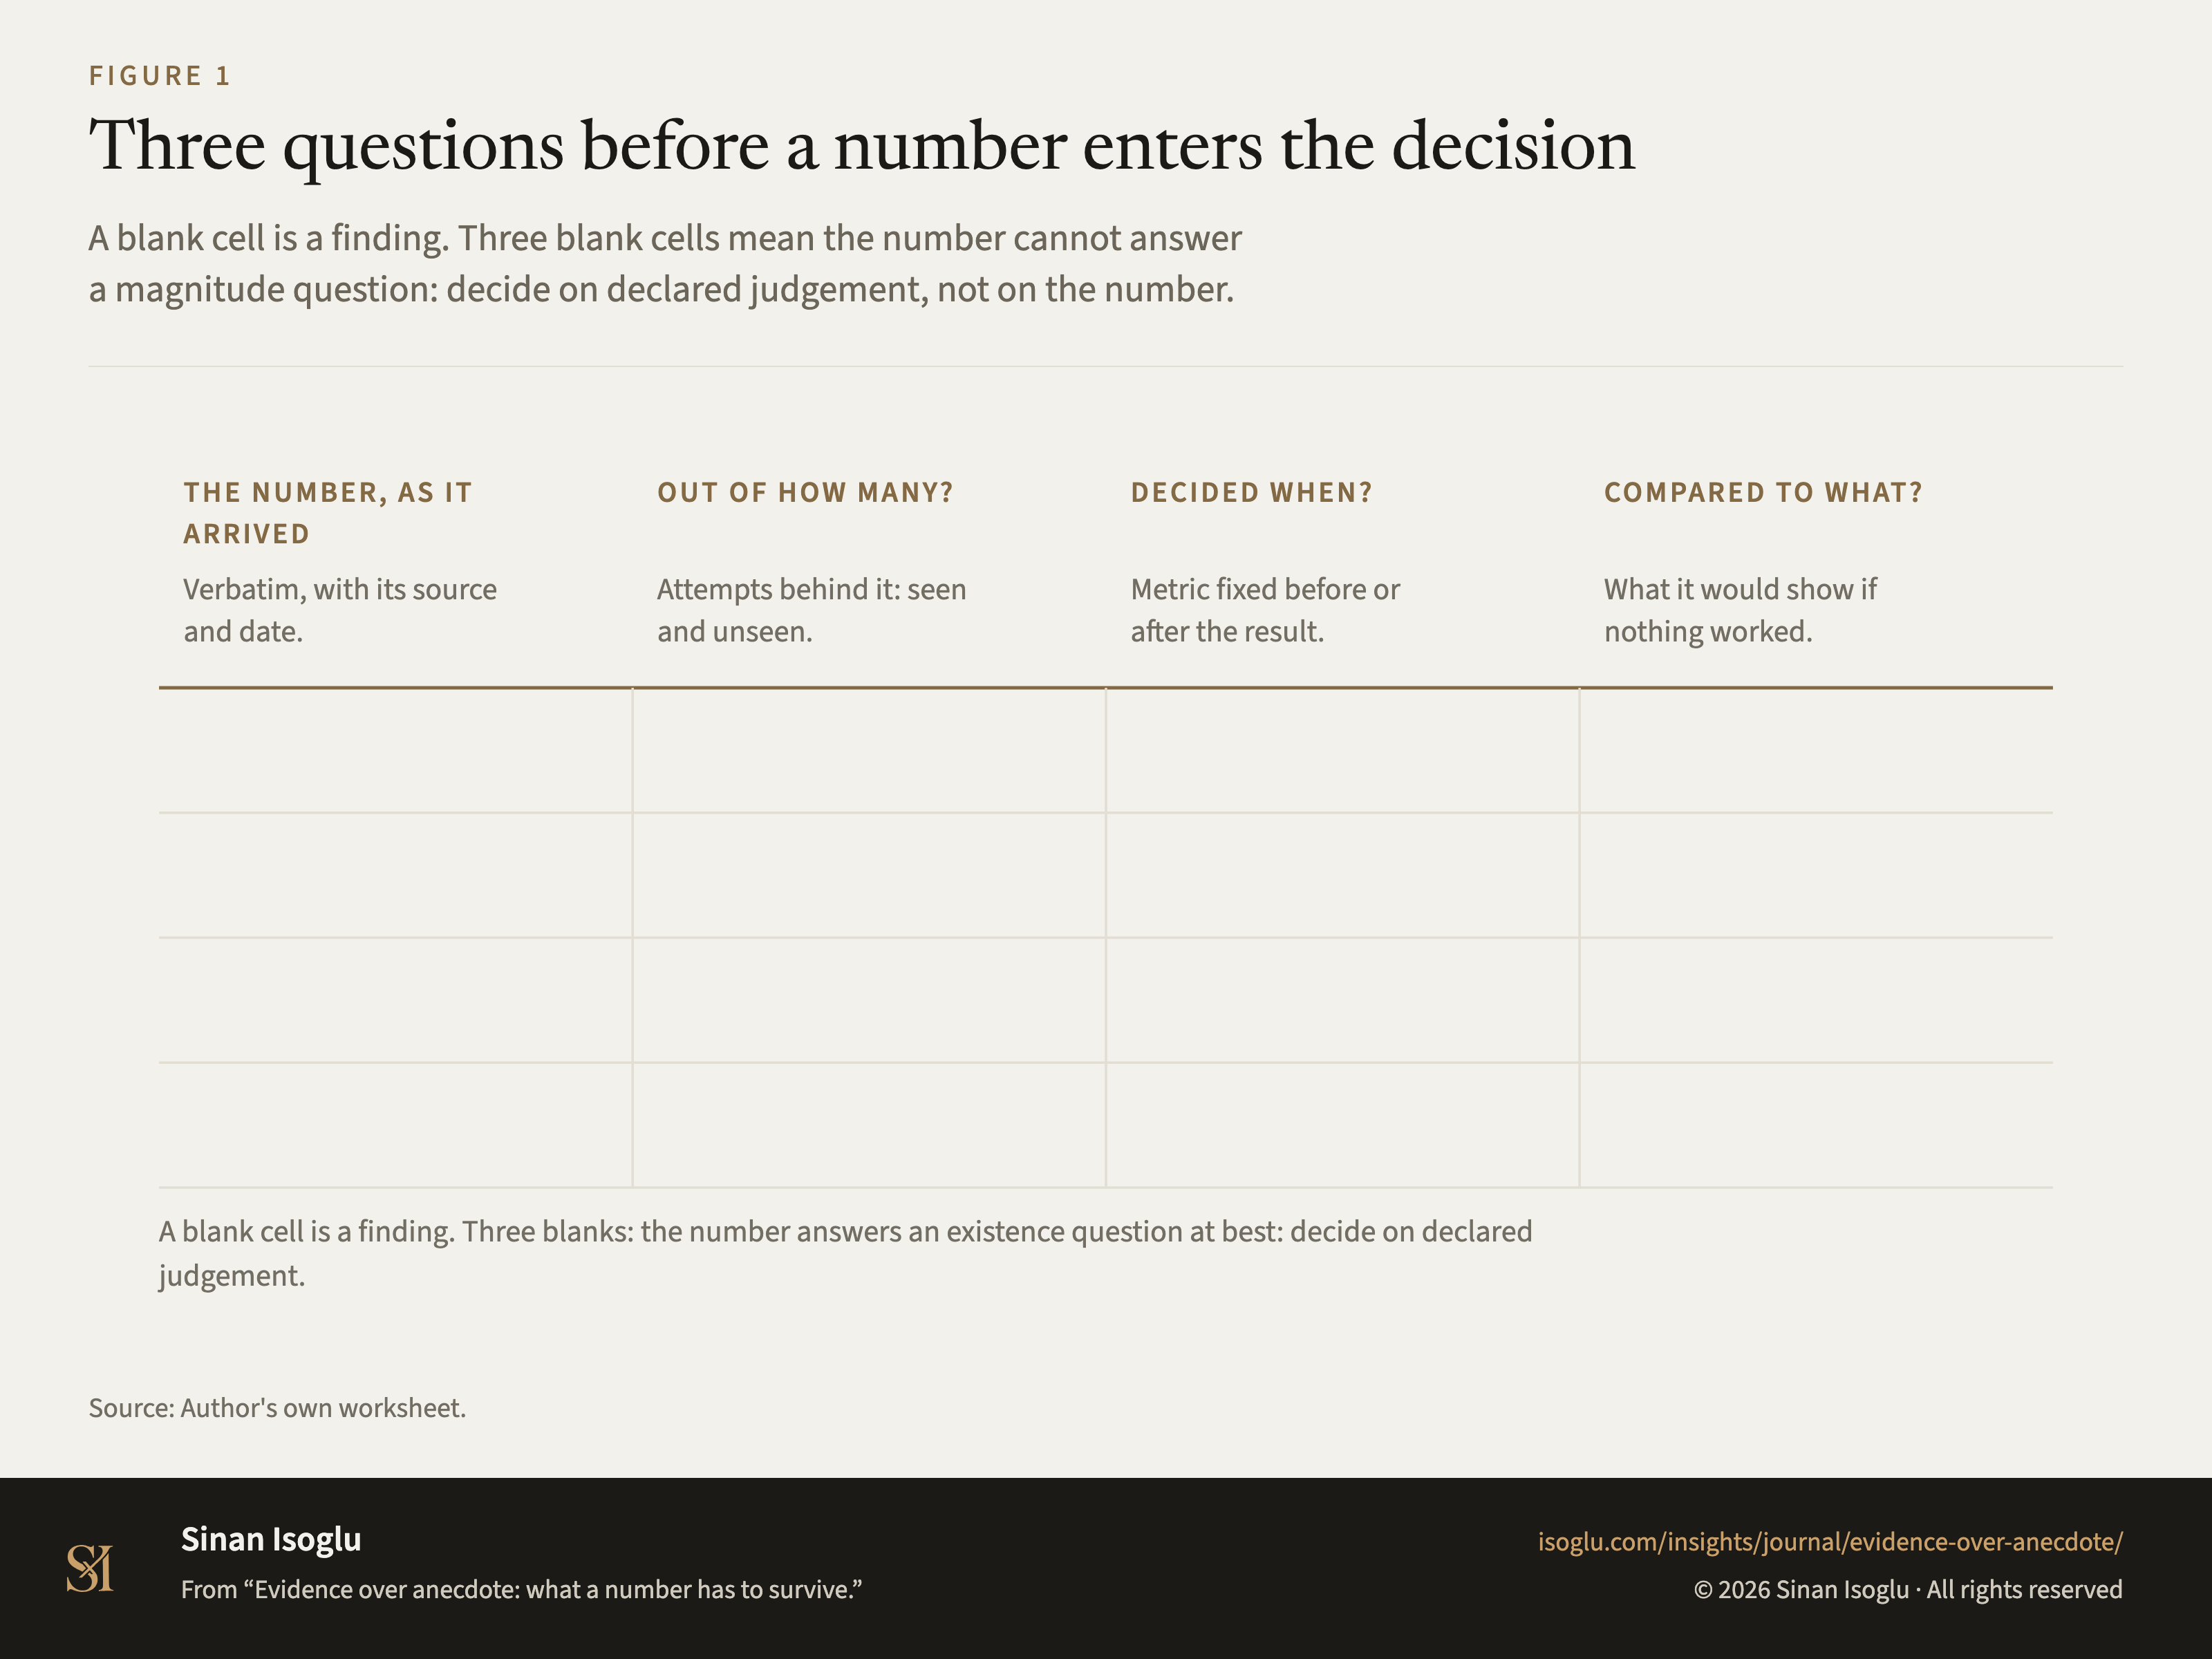
Abbildung 1Grafik
Drei Fragen, bevor eine Zahl in die Entscheidung einzieht
Evidenz statt Anekdote – was eine Zahl überstanden haben muss.
Kontakt
Schicken Sie die Frage, an der Sie arbeiten.
Forschung, ein Gastvortrag oder eine Frage aus der Praxis.